
Captive Power Plant Market Size, Share Analysis Report By Fuel Source (Coal, Natural Gas, Diesel/HFO, Renewable, Hybrid, Others), By Capacity Range (Up to 10 MW, 10 to 50 MW, 51 to 150 MW, Above 150 MW), By Technology (Gas Turbine, Reciprocating Engine, Combined Heat and Power (CHP), Renewable Microgrid (PV/Wind + BESS), Fuel Cells/Hydrogen), By End-use (Cement, Metals and Minerals (incl Steel), Petrochemicals, Data Centres, Pulp and Paper, Others) , By Region and Companies - Industry Segment Outlook, Market Assessment, Competition Scenario, Trends and Forecast 2025-2034
- Published date: Jan 2026
- Report ID: 173920
- Number of Pages: 271
- Format:
-
keyboard_arrow_up
Quick Navigation
Report Overview
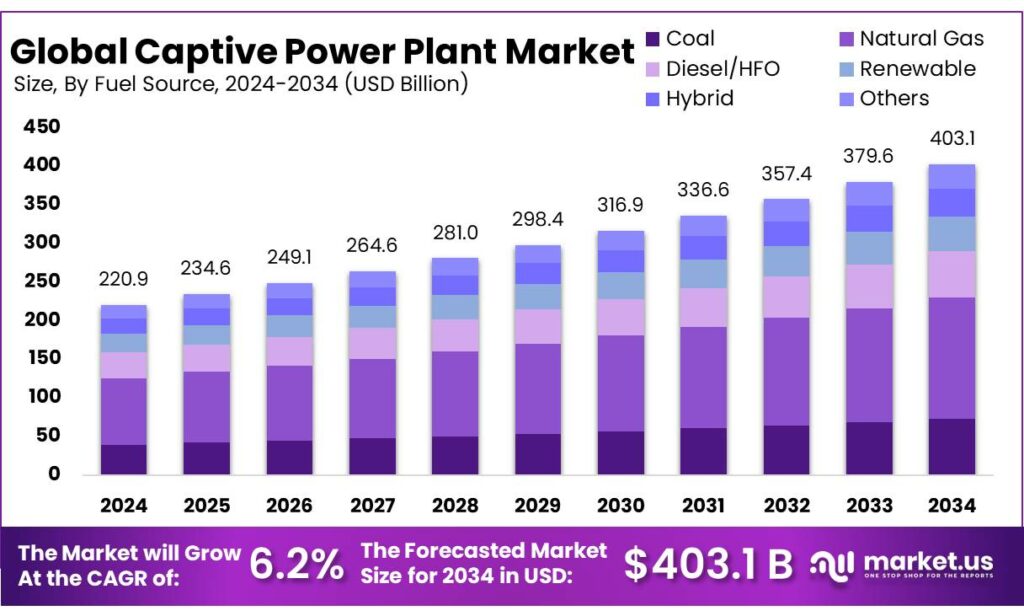
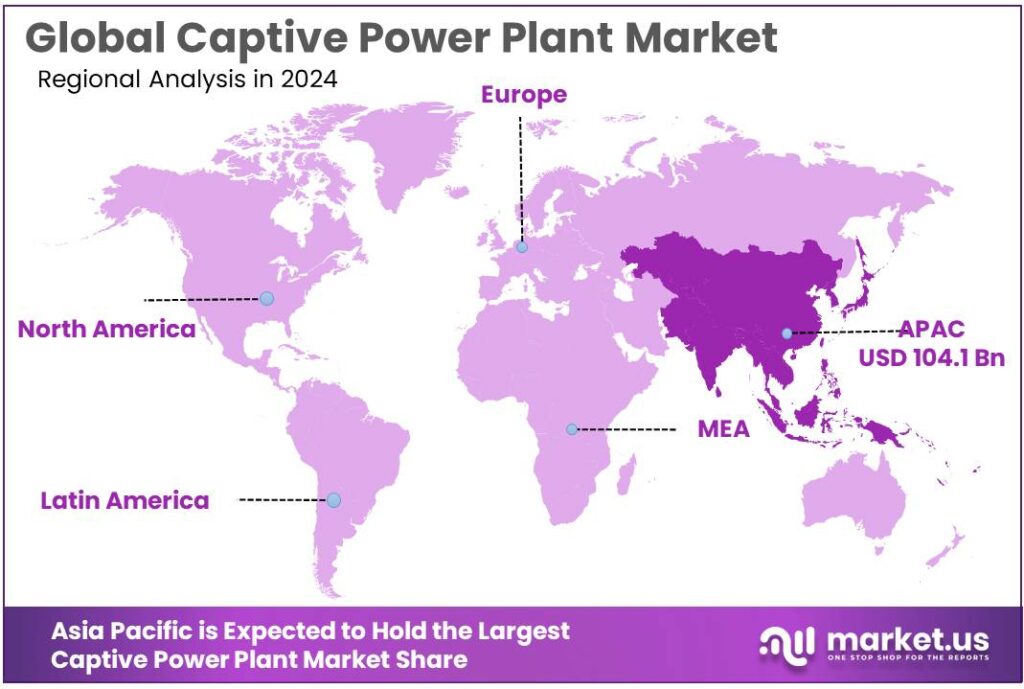
Global Power Plant Market size is expected to be worth around USD 403.1 Billion by 2034, from USD 220.9 Billion in 2024, growing at a CAGR of 6.2% during the forecast period from 2025 to 2034. In 2024 Asia Pacific held a dominant market position, capturing more than a 47.3% share, holding USD 104.1 Billion in revenue.
Captive power plants (CPPs) are on-site or dedicated off-site generating assets built primarily to supply electricity (and often steam/heat) to a specific industrial user. They are used when grid power is costly, unreliable, carbon-intensive, or when a plant needs stable quality power for continuous processes. In India, the regulatory idea of “captive” is tightly defined: under the Electricity Rules, at least 26% ownership must be held by the captive user(s) and at least 51% of the electricity generated (annual basis) must be consumed for captive use—conditions that determine whether the project qualifies for captive status and related charge exemptions.
Industrially, CPP adoption rises fastest in energy-intensive, always-on operations—food processing, dairies, cold chains, chemicals, metals, cement, textiles, and large campuses—where power interruptions directly translate into scrap, safety risks, and inventory losses. This urgency is reinforced by the scale of industrial energy demand: the industrial sector accounted for 37% (166 EJ) of global energy use in 2022, so even small reliability gains or tariff reductions have material bottom-line impact.
Key driving factors are strongly linked to operational risk and product integrity—especially in food value chains. Cold-chain interruptions can spoil inventory rapidly, so energy resilience becomes a core business requirement. India’s food-processing policy push is also adding throughput that must be powered reliably: the Production Linked Incentive Scheme for Food Processing (PLISFPI) runs from 2021–22 to 2026–27 with an outlay of ₹10,900 crore, and 172 food processing companies had been approved for assistance as of June 30, 2024. At the same time, cold-chain capacity gaps highlight why steady power matters: MoFPI’s annual reporting has cited a cold storage requirement of 61 million tonnes versus estimated existing capacity of about 32 million tonnes.
Policy is also pushing CPP strategies toward cleaner portfolios. India’s Ministry of Power notified the Green Energy Open Access Rules in June 2022, reducing the open-access threshold from 1 MW to 100 kW for green power, widening renewable procurement options for smaller industrial loads and enabling more hybrid “captive + open access renewables” structures. At the same time, India’s national direction is to scale non-fossil capacity to 500 GW by 2030, which increases grid renewable penetration and strengthens the business case for firming solutions around captive and contracted renewables.
Key Takeaways
- Power Plant Market size is expected to be worth around USD 403.1 Billion by 2034, from USD 220.9 Billion in 2024, growing at a CAGR of 6.2%.
- Natural Gas held a dominant market position, capturing more than a 39.8% share in the captive power plant market.
- 51 to 150 MW held a dominant market position, capturing more than a 37.2% share in the captive power plant market.
- Gas Turbine held a dominant market position, capturing more than a 31.7% share in the captive power plant market.
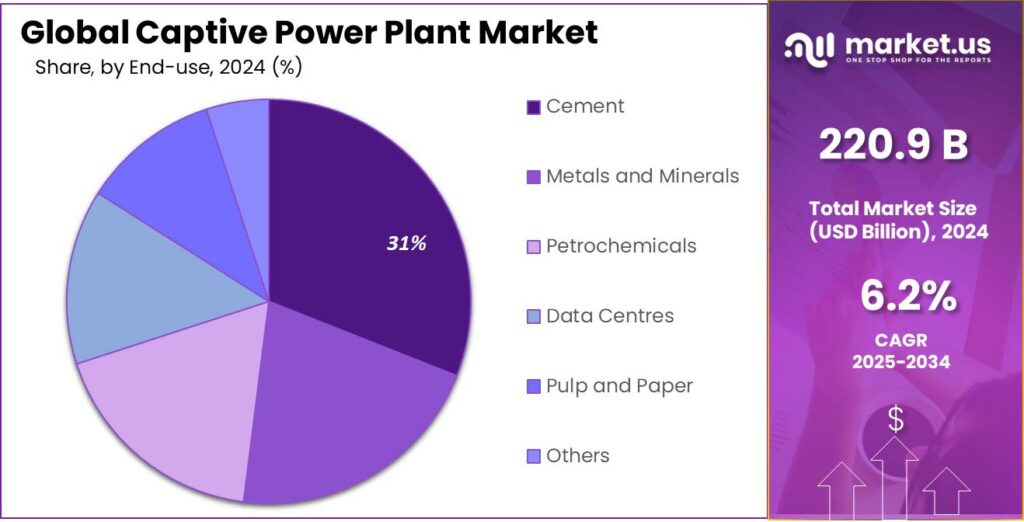
- Cement held a dominant market position, capturing more than a 31.6% share in the captive power plant market.
- Asia Pacific region established itself as the dominant force in the global captive power plant market, accounting for approximately 47.3% share and USD 104.1 billion.
By Fuel Source Analysis
Natural Gas dominates with 39.8% due to its stable supply and lower emission profile
In 2024, Natural Gas held a dominant market position, capturing more than a 39.8% share in the captive power plant market by fuel source. This leadership was supported by its reliable availability, faster start-up capability, and comparatively lower carbon emissions than coal and diesel-based systems. The segment benefited from growing industrial demand for uninterrupted and clean power, particularly in manufacturing, chemicals, and metals, where operational efficiency and compliance with environmental norms remained critical.
In 2024, the preference for natural gas was reinforced by expanding gas pipeline infrastructure and stable fuel pricing in key regions. Moving into 2025, adoption was further supported by industries shifting toward cleaner transitional fuels while maintaining cost control and energy security, positioning natural gas as a practical and balanced option for captive power generation.
By Capacity Range Analysis
51 to 150 MW dominates with 37.2% as it balances power reliability and cost efficiency
In 2024, 51 to 150 MW held a dominant market position, capturing more than a 37.2% share in the captive power plant market by capacity range. This segment was widely adopted by large manufacturing units, refineries, and metal processing facilities that required steady power without the high capital burden of very large plants. The capacity range was seen as suitable for meeting base-load demand while allowing operational flexibility and easier integration with gas, coal, or hybrid fuel systems.
During 2024, investments were driven by industries aiming to reduce grid dependency and control energy costs. In 2025, demand remained strong as expansion projects in industrial parks and special economic zones favored this capacity range for its scalability, faster commissioning, and predictable operating performance.
By Technology Analysis
Gas Turbine dominates with 31.7% due to high efficiency and fast power delivery
In 2024, Gas Turbine held a dominant market position, capturing more than a 31.7% share in the captive power plant market by technology. This dominance was supported by its ability to deliver large volumes of power with high efficiency and quick start-up times, making it suitable for industries with continuous and heavy energy demand.
In 2024, gas turbine systems were widely preferred in sectors such as oil & gas, chemicals, and large manufacturing units, where operational reliability and lower emissions were key priorities. The technology also benefited from compatibility with natural gas and combined heat and power applications, improving overall energy utilization. In 2025, adoption continued to grow as industries focused on upgrading older systems to more efficient technologies while aligning with stricter environmental standards and long-term energy cost stability.
By End-use Analysis
Cement leads with 31.6% driven by its high and continuous power needs
In 2024, Cement held a dominant market position, capturing more than a 31.6% share in the captive power plant market by end user. This strong position was mainly supported by the cement industry’s constant and energy-intensive production process, where uninterrupted power is critical to avoid operational losses. In 2024, many cement plants continued to rely on captive power to manage rising grid tariffs and ensure stable energy supply, especially in regions with frequent power fluctuations.
Waste heat recovery and fuel flexibility also supported adoption across large cement facilities. In 2025, demand remained steady as capacity expansion and modernization projects increased the need for reliable in-house power generation, reinforcing cement as a key end-user segment in the captive power plant market.
Key Market Segments
By Fuel Source
- Coal
- Natural Gas
- Diesel/HFO
- Renewable
- Hybrid
- Others
By Capacity Range
- Up to 10 MW
- 10 to 50 MW
- 51 to 150 MW
- Above 150 MW
By Technology
- Gas Turbine
- Reciprocating Engine
- Combined Heat and Power (CHP)
- Renewable Microgrid (PV/Wind + BESS)
- Fuel Cells/Hydrogen
By End-use
- Cement
- Metals and Minerals (incl Steel)
- Petrochemicals
- Data Centres
- Pulp and Paper
- Others
Emerging Trends
Captive power is shifting to solar-plus-storage hybrids
A major latest trend in captive power plants is the move away from “one big generator” toward hybrid captive systems—typically solar paired with battery storage, backed by limited conventional generation only for critical needs. The reason is practical: industries want the reliability of captive power, but they also want lower fuel risk and a cleaner electricity profile. This shift is happening while power systems are getting tighter. The International Energy Agency reports global electricity demand rose by 4.3% in 2024, a much faster pace than 2023.
Food and beverage plants are a clear example of why the hybrid trend is gaining traction. These sites run continuous lines, refrigeration, and automated packaging where even short disruptions can create waste and lost output. At the same time, global food brands are now publishing hard numbers on renewable electricity, which increases internal pressure to “green” plant power. Nestlé says renewable electricity sourced in its manufacturing sites reached 95.3% by end-2024. PepsiCo reports that in 2024, 89% of its direct global electricity needs were met with renewable electricity, and its total electricity use was about 4,400 GWh—with roughly 96% purchased from the grid and the rest self-generated.
A second “latest trend” inside this shift is the rise of state-level rules that actively push storage into captive solar and tighten captive compliance. For example, a recent Rajasthan Renewable Energy Corporation (RRECL) standard operating approach for large captive solar and third-party sales highlighted battery energy storage expectations for projects above 5 MW, and reiterated captive thresholds such as 26% minimum equity ownership and 51% consumption of generated power to retain captive status.
Storage economics and grid charges are also moving in a supportive direction. Reuters reported that India extended a waiver on inter-state transmission charges for eligible energy storage projects until June 2028, and noted that inter-state transmission charges can add about 7% to monthly transmission costs for electricity purchasers. The same report referenced a ₹54 billion plan to develop 30 GWh of battery storage, and reiterated India’s 500 GW clean energy target by 2030.
Drivers
Reliable, predictable power for continuous production
For most industries, the biggest reason to build a captive power plant is simple: it gives a factory dependable electricity when interruptions or unstable supply can stop production. This matters even more for plants that run 24/7 or depend on tight temperature control. The global backdrop is also getting tougher—world electricity demand grew by 4.3% in 2024, and industry contributed nearly 40% of that growth, which increases competition for firm power and puts pressure on grids.
Food and beverage operations show why “uptime” has real financial value. The U.S. Department of Energy’s footprint analysis for Food & Beverage manufacturing (NAICS 311/312) estimates the sector uses 1,934 TBtu of primary energy, and electricity generation accounts for 906 TBtu (about 47%) of that total—highlighting how electricity-heavy processing, refrigeration, and packaging lines can be. When power is interrupted, the risk is not only lost throughput but also product safety and waste. U.S. food-safety guidance notes that a refrigerator keeps food safe for up to 4 hours during a power outage; beyond that window, many refrigerated perishables should be discarded.
Another part of the reliability story is cost predictability. Many large food companies are actively managing electricity sourcing to reduce exposure to price swings and strengthen resilience. Nestlé reports that by the end of 2024 it sourced 95.3% renewable electricity in its manufacturing sites, showing how energy strategy is now tied to operational risk and long-term planning. PepsiCo reports that in 2024, 89% of its direct global electricity needs were met with renewable electricity, while most electricity was still purchased through the grid—an example of why some sites still consider partial self-generation to protect critical operations.
Government policy can amplify this driver by making self-supply and green procurement easier. In India, the Green Energy Open Access Rules, 2022 are positioned as a step to help consumers access green power at reasonable rates and support national emissions goals.India’s captive framework also matters for industrial buyers: captive projects typically hinge on thresholds such as ≥26% ownership and ≥51% consumption of generated electricity for captive use.
Restraints
High upfront cost and rising compliance risk
A major restraint for captive power plants is that they demand big money upfront and then face a moving target on compliance. A factory is not just buying a generator—it is taking on a mini-utility job: land, engineering, fuel handling, emissions control, ash/waste, water systems, grid interconnection, and a full-time operations team. Even when a captive plant lowers outage risk, the payback can be uncertain if regulations tighten or if a cleaner alternative becomes easier to procure.
Fuel-price volatility is another practical headache, especially for gas-based captive units. The IEA notes that natural gas price volatility in Europe in 2024 was still 50% above the 2010–2019 average, and spot LNG volatility in Asia in 2024 remained 90% above its 2010–2019 average. That volatility flows directly into captive power costs because the plant is exposed to fuel procurement risk. The same IEA framing explains why power generation costs spiked globally in 2022—surging natural gas and coal prices sharply escalated the cost of producing electricity. In short, captive can protect a plant from grid tariff swings, but it can also “swap” that risk for fuel-market swings.
Environmental permitting and emissions controls can also slow projects and add recurring costs. In the U.S., facilities can trigger Title V operating permit requirements depending on size and location; EPA lists lower “major source” thresholds for non-attainment areas—down to 50 tpy, 25 tpy, or even 10 tpy for ozone-related classifications in some cases, which makes project design and siting more complicated.
EPA proposed in November 22, 2024 to strengthen NOx limits for many new or modified stationary combustion turbines, and held a public hearing on January 8, 2025—a sign that compliance expectations can tighten during a captive asset’s life. Globally, lenders also look for “good practice” design; World Bank Group/IFC thermal power guidance highlights typical stack height examples up to about 200 m for large coal plants and around 80 m for large oil-fired plants—details that often translate into real civil and permitting cost.
Food and beverage companies feel this restraint because their energy strategies are increasingly judged through a climate lens. Many large brands are moving electricity supply toward renewables, which can make fossil-heavy captive investments harder to justify internally. Nestlé says it reached 95.3% renewable electricity sourcing in its manufacturing sites by end-2024. PepsiCo reports that in 2024, 89% of its direct global electricity needs were met with renewable electricity, and its total electricity use was about 4,400 GWh, with roughly 96% purchased through the grid and only the remainder self-generated.
Opportunity
Hybrid renewable captive plants with storage for round-the-clock power
A clear growth opportunity for captive power plants is the shift from “fuel-only captive” to hybrid captive systems—on-site or off-site solar/wind tied with battery energy storage and smart controls. The business logic is straightforward: factories want the reliability of captive power, but they also want to cut emissions and reduce exposure to fuel volatility. At the same time, electricity demand is rising fast. The International Energy Agency reports global electricity demand grew by 4.3% in 2024, and industry contributed nearly 40% of the growth.
Food and beverage plants are a strong fit for this model because many of them cannot tolerate power interruptions or unstable voltage. They run continuous lines, refrigeration, boilers, compressed air, and automation—loads that are expensive to restart. Large food companies are also putting numbers behind their clean electricity push, which creates internal pressure to upgrade how plants are powered. Nestlé reports that by end-2024, 95.3% of electricity in its manufacturing sites was sourced from renewable electricity. PepsiCo reports its total electricity use in 2024 was about 4,400 GWh, and 89% of direct global electricity needs were met with renewable electricity; it also notes roughly 96% of electricity was purchased through the grid, with the remainder self-generated.
Government moves are making this opportunity easier to execute, especially in India where “captive” and “open access” structures are common for industry. The Ministry of Power notified the Green Energy Open Access Rules, 2022 on 06.06.2022 to accelerate renewable programs and improve access to affordable, reliable, and green energy. In May 2023, India’s PIB explained that the green open access threshold was reduced from 1 MW to 100 kW, widening who can buy renewable power through open access.
Storage policy is also becoming a tailwind. Reuters reported India extended the inter-state transmission charge waiver for eligible energy storage projects until June 2028, and referenced a ₹54 billion plan to develop 30 GWh of battery energy storage systems.Storage policy is also becoming a tailwind. Reuters reported India extended the inter-state transmission charge waiver for eligible energy storage projects until June 2028, and referenced a ₹54 billion plan to develop 30 GWh of battery energy storage systems.
Regional Insights
Asia Pacific leads with 47.3% share and USD 104.1 Bn driven by rapid industrial growth and power demand
In 2024, the Asia Pacific region established itself as the dominant force in the global captive power plant market, accounting for approximately 47.3% share and USD 104.1 billion in market value. This commanding position was shaped by sustained industrial expansion in key economies such as China, India, and Southeast Asian nations, where manufacturing output and infrastructure development remained central to economic strategies.
The captive power segment in Asia Pacific was propelled by persistent challenges with grid reliability in several emerging markets, prompting industries to secure uninterrupted energy supply through onsite generation. China’s expansive manufacturing base and India’s heavy industrial demand were particularly influential, as both countries continued to invest in captive power solutions to mitigate grid instability and reduce operational risk, thereby reinforcing regional leadership.
Key Regions and Countries Insights
- North America
- US
- Canada
- Europe
- Germany
- France
- The UK
- Spain
- Italy
- Rest of Europe
- Asia Pacific
- China
- Japan
- South Korea
- India
- Australia
- Rest of APAC
- Latin America
- Brazil
- Mexico
- Rest of Latin America
- Middle East & Africa
- GCC
- South Africa
- Rest of MEA
Key Players Analysis
Siemens AG, headquartered in Germany, reported revenues of about €75.93 billion in 2024, with strong contributions from energy technologies used in captive power systems. The company employs over 327,000 people worldwide, deploying gas and steam turbines bundled with digital monitoring and automation solutions that improve efficiency for industrial captive plants.
Caterpillar Inc. is a major U.S. equipment manufacturer with a broad generator and engine portfolio for captive power use. In 2024, the company employed approximately 112,900 people worldwide and remains a key supplier of diesel and gas gensets for industrial and data center captive applications due to its global dealer network and strong aftermarket support.
Mitsubishi Heavy Industries (MHI) is a Japanese conglomerate with energy systems and turbine products crucial for large captive power projects. In 2023, the company reported revenues of ¥4,657.1 billion with over 100,000 employees globally, reinforcing its engineering strength in heavy industrial captive power installations and advanced turbine solutions.
Top Key Players Outlook
- General Electric Company
- Siemens AG
- Wärtsilä Oyj Abp
- Caterpillar Inc.
- Mitsubishi Heavy Industries Ltd.
- Bharat Heavy Electricals Ltd.
- ABB Ltd.
- Tata Power Renewable Energy
- AMP Solar Group Inc.
- JSW Energy Ltd.
Recent Industry Developments
In 2024, GE Vernova reported orders of USD 44.1 billion and total revenue of USD 34.9 billion, with the power segment, which includes gas generation equipment relevant to captive plants, delivering USD 21.8 billion in orders and USD 18.1 billion in revenue, reflecting strong market demand for high-efficiency turbines and services in industrial applications—particularly where grid reliability is limited and continuous power is essential.
In 2024, Siemens Energy reported revenue of approximately €34.5 billion and operating income of about €2.13 billion, underlining significant business activity in power generation and related services that are directly applicable to captive plant projects where consistent and efficient generation is required.
Report Scope
Report Features Description Market Value (2024) USD 220.9 Bn Forecast Revenue (2034) USD 403.1 Bn CAGR (2025-2034) 6.2% Base Year for Estimation 2024 Historic Period 2020-2023 Forecast Period 2025-2034 Report Coverage Revenue Forecast, Market Dynamics, Competitive Landscape, Recent Developments Segments Covered By Fuel Source (Coal, Natural Gas, Diesel/HFO, Renewable, Hybrid, Others), By Capacity Range (Up to 10 MW, 10 to 50 MW, 51 to 150 MW, Above 150 MW), By Technology (Gas Turbine, Reciprocating Engine, Combined Heat and Power (CHP), Renewable Microgrid (PV/Wind + BESS), Fuel Cells/Hydrogen), By End-use (Cement, Metals and Minerals (incl Steel), Petrochemicals, Data Centres, Pulp and Paper, Others) Regional Analysis North America – US, Canada; Europe – Germany, France, The UK, Spain, Italy, Rest of Europe; Asia Pacific – China, Japan, South Korea, India, Australia, Singapore, Rest of APAC; Latin America – Brazil, Mexico, Rest of Latin America; Middle East & Africa – GCC, South Africa, Rest of MEA Competitive Landscape General Electric Company, Siemens AG, Wärtsilä Oyj Abp, Caterpillar Inc., Mitsubishi Heavy Industries Ltd., Bharat Heavy Electricals Ltd., ABB Ltd., Tata Power Renewable Energy, AMP Solar Group Inc., JSW Energy Ltd. Customization Scope Customization for segments, region/country-level will be provided. Moreover, additional customization can be done based on the requirements. Purchase Options We have three licenses to opt for: Single User License, Multi-User License (Up to 5 Users), Corporate Use License (Unlimited User and Printable PDF) 
-
-
- General Electric Company
- Siemens AG
- Wärtsilä Oyj Abp
- Caterpillar Inc.
- Mitsubishi Heavy Industries Ltd.
- Bharat Heavy Electricals Ltd.
- ABB Ltd.
- Tata Power Renewable Energy
- AMP Solar Group Inc.
- JSW Energy Ltd.
Our Clients
- 173920
- Jan 2026


