
Global Canned Alcoholic Beverages Market Size, Share Analysis Report By Product (Wine, RTD Cocktail, Hard Seltzers), By Alcohol Content (No-alcohol products (0.05%-0.5% ABV), Low-alcohol products (20.5% 3.0% ABV), Standard-alcohol products (3.0% 8.0% ABV), High-alcohol products (>8.0% ABV)), By Distribution Channel (On-trade, Liquor Stores, Online, Others) , By Region and Companies - Industry Segment Outlook, Market Assessment, Competition Scenario, Trends and Forecast 2025-2034
- Published date: Jan 2026
- Report ID: 174291
- Number of Pages: 217
- Format:
-
keyboard_arrow_up
Quick Navigation
Report Overview
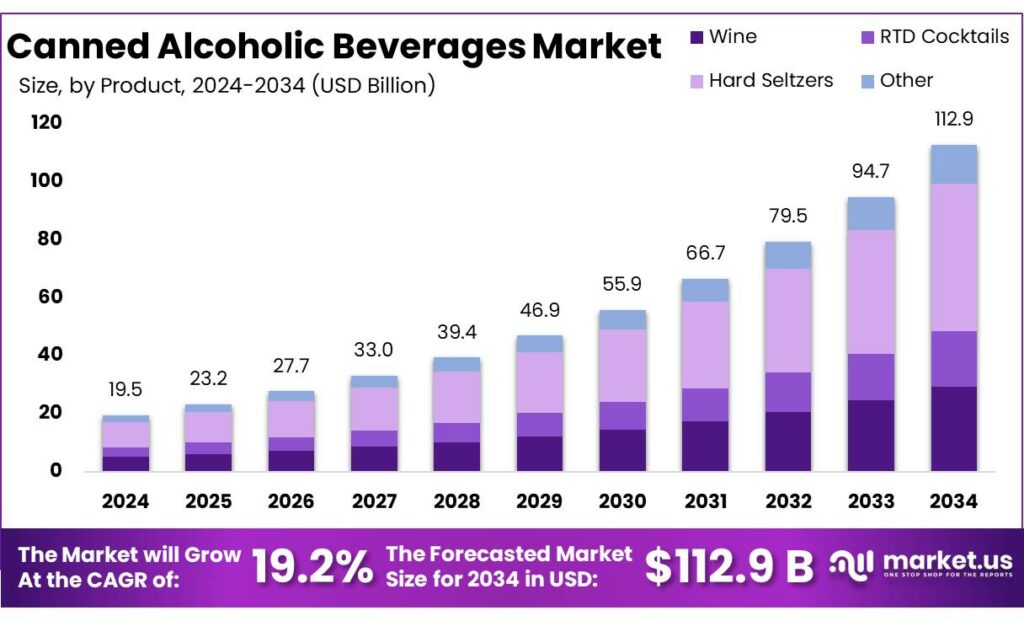
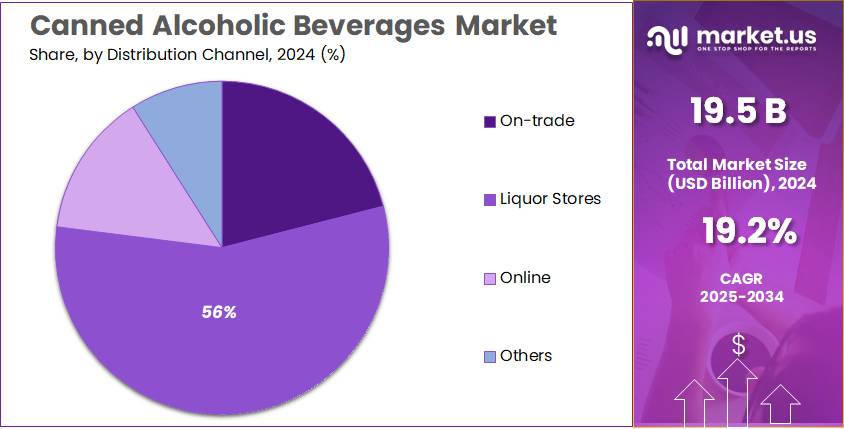
Global Canned Alcoholic Beverages Market size is expected to be worth around USD 112.9 Billion by 2034, from USD 19.5 Billion in 2024, growing at a CAGR of 19.2% during the forecast period from 2025 to 2034. In 2024 North America held a dominant market position, capturing more than a 42.7% share, holding USD 1.9 Billion in revenue.
Canned alcoholic beverages are a fast-evolving part of the broader “ready-to-drink” (RTD) universe, spanning canned beer, hard seltzers, canned cocktails, and spirit-based mixed drinks. The industrial appeal is simple: a can is lightweight, stackable, and easy to chill, which fits modern retail and “drink-anywhere” occasions.
- In the U.S. beer market, cans are already the dominant pack format—64.1% of beer volume was packaged in aluminum cans in 2023, compared with 26.9% in glass bottles and 8.9% in draft, highlighting how central cans have become to alcohol distribution and merchandising.
Demand is being pulled forward by convenience-led consumer behavior and by real category momentum in spirits-based RTDs. In the Distilled Spirits Council of the United States (DISCUS) 2025 economic briefing, spirits-based Cocktails/RTDs are shown at 73.1 million 9-liter cases in 2024 (volume measure), and the category remains one of the top revenue growers within spirits. On the beer side, overall U.S. beer production and imports were down 1% in 2024, and craft brewer volume sales declined 4%, which pushes many producers to seek higher-value “innovation lanes” such as flavored malt beverages and canned mixed drinks.
Key driving factors are consumer convenience, variety-led trial, and “occasion fit.” Cans support portion control and simpler serving, which is attractive as consumers moderate frequency and shift consumption into more casual settings. Public-health institutions also continue to influence policy and messaging: WHO highlights alcohol’s population health burden and reports significant gender differences in consumption (e.g., 2019 per-capita consumption averages of 8.2 litres for men vs 2.2 litres for women), reinforcing why lower-ABV and smaller-format products are gaining shelf space.
Government and trusted-policy signals also matter because they influence pack formats and operational decisions. In the U.S., the Alcohol and Tobacco Tax and Trade Bureau (TTB) maintains labeling resources to guide compliant alcohol beverage labels. Separately, a January 10, 2025 Federal Register publication finalizes updates to “standards of fill,” adding 13 container sizes for wine and 15 for distilled spirits, and removing the distinction between spirits “in cans” versus other containers—an example of regulation evolving to match how consumers now buy packaged alcohol.
Separately, a January 10, 2025 Federal Register publication finalizes updates to “standards of fill,” adding 13 container sizes for wine and 15 for distilled spirits, and removing the distinction between spirits “in cans” versus other containers—an example of regulation evolving to match how consumers now buy packaged alcohol.
Key Takeaways
- Canned Alcoholic Beverages Market size is expected to be worth around USD 112.9 Billion by 2034, from USD 19.5 Billion in 2024, growing at a CAGR of 19.2%.
- Hard Seltzers held a dominant market position, capturing more than a 45.8% share in the Canned Alcoholic Beverages Market.
- Standard-alcohol products (3.0%–8.0% ABV) held a dominant market position, capturing more than a 56.2% share in the Canned Alcoholic Beverages Market.
- Liquor Stores held a dominant market position, capturing more than a 56.1% share in the Canned Alcoholic Beverages Market.
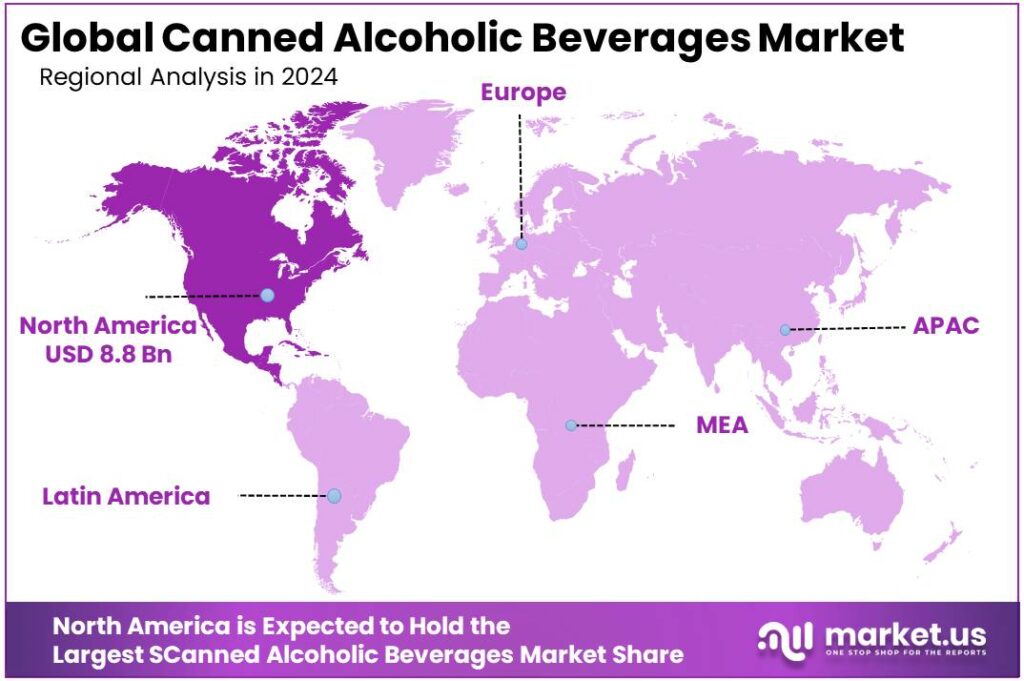
- North America led the canned alcoholic beverages market with a dominant 45.2% share, valued at USD 8.8 Bn.
By Product Analysis
Hard Seltzers dominate the Canned Alcoholic Beverages Market with 45.8% share in 2024 due to light taste and convenience.
In 2024, Hard Seltzers held a dominant market position, capturing more than a 45.8% share in the Canned Alcoholic Beverages Market by Product. This leadership reflects consumer preference for drinks that feel lighter and easier to enjoy compared with traditional beer or spirits. Many buyers see hard seltzers as a casual option that fits social occasions without feeling heavy.
By Alcohol Content Analysis
Standard-alcohol canned drinks (3.0%–8.0% ABV) dominate with 56.2% share in 2024 due to balanced strength.
In 2024, Standard-alcohol products (3.0%–8.0% ABV) held a dominant market position, capturing more than a 56.2% share in the Canned Alcoholic Beverages Market by Alcohol Content. This dominance comes from consumer preference for drinks that offer a noticeable alcohol effect without feeling too strong or overwhelming. The range suits casual social settings where moderation and easy drinking matter.
By Distribution Channel Analysis
Liquor Stores dominate the Canned Alcoholic Beverages Market with 56.1% share in 2024 due to wide choice.
In 2024, Liquor Stores held a dominant market position, capturing more than a 56.1% share in the Canned Alcoholic Beverages Market by Distribution Channel. This leadership reflects consumer trust in liquor stores as the primary destination for alcoholic drinks, especially when looking for variety and product authenticity. Shoppers prefer these stores because they offer multiple brands, pack sizes, and flavor options in one place.
Key Market Segments
By Product
- Wine
- Still
- Fortified
- Low-alcohol
- Sparkling
- RTD Cocktails
- Malt Based
- Spirit Based
- Wine Based
- Hard Seltzers
- Malt Based
- Spirit Based
- Wine Based
By Alcohol Content
- No-alcohol products (0.05%-0.5% ABV)
- Low-alcohol products (20.5% 3.0% ABV)
- Standard-alcohol products (3.0% 8.0% ABV)
- High-alcohol products (>8.0% ABV)
By Distribution Channel
- On-trade
- Liquor Stores
- Online
- Others
Emerging Trends
Spirits-Based Canned Cocktails Are “Trading Up” Fast
A clear latest trend in canned alcoholic beverages is the move away from “just flavored and fizzy” into more premium, spirits-based ready-to-drink (RTD) cocktails that feel closer to a bar drink—only packaged for a fridge. People still want convenience, but they also want a drink that tastes deliberate, not like a shortcut. That is why many brands are focusing on cocktail-style recipes (margarita-style, vodka soda twists, whiskey-based mixes), cleaner flavor profiles, and a more “adult” taste balance.
Industry data backs up this shift. The Distilled Spirits Council of the United States (DISCUS) reported that premixed cocktails (including spirits-based RTDs) rose 16.5% to $3.3 billion in 2024. That’s not a small bump—it signals that more shoppers are choosing the RTD shelf as a destination, not as a fallback.
What’s interesting is that premium isn’t only about price—it’s about where consumers place their trust. DISCUS also highlights premiumization inside these pre-mixed cocktails: high end & super premium made up 41.5% of volume in 2024, up from 40.9% in 2023. In plain terms, a bigger share of RTD cocktail buyers are choosing “top shelf” options even when money is tighter. This trend benefits canned formats because cans make premium easy: the drink is consistent, portioned, and doesn’t depend on someone mixing it right at home.
Regulation is quietly supporting this trend by allowing more practical package choices. In the U.S., the Alcohol and Tobacco Tax and Trade Bureau (TTB) finalized updates to “standards of fill,” adding 13 container sizes for wine and 15 for distilled spirits—and removing the old distinction between spirits “in cans” versus other containers. This matters because innovation in RTDs is often tied to pack sizes (single-serve, slim cans, multi-serve), trial packs, and venue-friendly formats. When legal container rules become more flexible, it becomes easier to launch new canned cocktails without redesigning a product strategy around outdated size limits.
Drivers
Convenience + “Grab-and-Go” Occasions Push Cans Forward
One major driving factor for canned alcoholic beverages is simple: they fit real life better than most mixed-drink routines. A can is portable, fast to chill, easy to carry to a get-together, and it removes the “do I have the right spirits, mixers, ice, and glassware?” friction. That convenience matters most on social occasions—when people want a drink that’s consistent every time and doesn’t slow the moment down. Even the beer industry’s own reporting leans into this idea: the Beer Institute says 66% of people who drink choose beer, and it highlights beer sales growing 1.6% in 2024 during weeks with holidays and major occasions—exactly the kind of moments where ready-to-serve cans win shelf space and attention.
The “grab-and-go” benefit becomes stronger when regulation supports more pack choices. In the U.S., the Alcohol and Tobacco Tax and Trade Bureau (TTB) finalized a rule that expands legal container sizes—adding 13 new standards of fill for wine and 15 for distilled spirits. That’s 28 additional approved sizes overall, which makes it easier for brands to sell canned cocktails, spritzers, and other ready-to-drink options in sizes that match how people actually buy: single-serve, convenience-store friendly, or variety-pack compatible. The TTB also explains these changes as giving industry more flexibility and consumers more purchasing options, which is a direct tailwind for canned formats.
Convenience also shows up in the way consumers “trade up” without changing behavior. A can lets someone buy a better-tasting drink without learning anything new—no bartending skills needed. Industry data from the Distilled Spirits Council of the United States (DISCUS) reinforces how ready-to-drink, spirits-based pre-mixed cocktails are being pulled into premium territory: “high end & super premium” accounted for 41.5% of volume in 2024 (up from 40.9% in 2023). That shift signals a clear consumer willingness to pay for a better canned drink as long as it stays easy and consistent.
Finally, the can format benefits from a strong (and improving) packaging sustainability story—important for retailers and younger adult shoppers. The Aluminum Association reports that 43% of aluminum cans shipped in the U.S. in 2023 were recycled, and it notes this rate is still higher than the equivalent recycling rate for glass (39.6%) and PET plastic bottles (20.0%). In parallel, the Can Manufacturers Institute highlights an industry target of a 70% U.S. aluminum beverage can recycling rate by 2030, which shows where the supply chain is trying to go.
Restraints
Stricter Health Rules And Labelling Slow Growth
A major restraining factor for canned alcoholic beverages is the steady tightening of public-health policy around alcohol. Governments and health bodies are putting more weight on warning labels, consumer information, and marketing limits because alcohol harm is large and visible. The World Health Organization (WHO) estimates around 2.6 million deaths worldwide were caused by alcohol consumption (2019), showing why regulators keep pushing for stronger policy tools that reduce risky drinking and make health risks clearer at the point of purchase.
Label compliance itself is a practical brake. In the U.S., the Alcohol and Tobacco Tax and Trade Bureau (TTB) states that a health warning statement must appear on all alcohol beverages sold or distributed in the country containing not less than 0.5% alcohol by volume. That requirement sounds simple, but it adds real operational work: artwork changes, approvals, inventory controls, and higher complexity for brands selling multiple SKUs and can sizes. For smaller producers, each label revision can mean extra design cycles, reprints, and slower launches—especially when seasonal flavors and limited editions are common in canned cocktails.
The compliance load can also expand over time. For example, TTB has proposed rulemaking related to major food allergen labeling for wines, distilled spirits, and malt beverages. If proposals like this move forward, canned alcoholic beverages made with flavorings or ingredients that trigger allergen disclosures may need additional label statements and documentation. That can reduce the “move fast, launch fast” advantage that helped RTDs grow, because each new formulation or supplier change may require more review and tighter controls.
Opportunity
Deposit-Return Rules Make Cans the “Easiest Win”
One big growth opportunity for canned alcoholic beverages is the fast spread of deposit-return systems and tighter packaging rules—especially in Europe—because they reward formats that are simple to collect, sort, and recycle at scale. This matters for canned RTDs because the product is already “single-serve and portable,” and now policy is pushing the market toward packaging that can be recovered more reliably after use.
This policy direction is happening at the same time packaging waste is becoming a public issue with hard numbers behind it. Eurostat reports the EU generated 79.7 million tonnes of packaging waste in 2023, equal to 177.8 kg per person. That scale keeps pressure on beverage brands and retailers to show progress on packaging outcomes, not just product taste. For canned alcoholic beverages, this creates a practical opportunity: if the supply chain can prove higher collection and recycling performance, cans become an easier “yes” for retailers that are trying to meet internal sustainability scorecards and national requirements at once.
Cans also have a stronger recycling baseline than several competing drink packages in the U.S., which helps multinational brands maintain one global story. The Aluminum Association reports 43% of aluminum cans shipped in the United States in 2023 were recycled. Importantly, it notes this is still higher than the equivalent recycling rate for glass (39.6%) and PET plastic bottles (20.0%). Even though the industry wants that can number to rise, it gives canned alcoholic beverages a clear advantage in conversations with distributors and retailers: the package already performs better than common alternatives, and deposit-return policy can push it even further.
Regional Insights
North America dominates the Canned Alcoholic Beverages Market with a 45.2% share, valued at USD 8.8 Bn in 2024.
In 2024, North America led the canned alcoholic beverages market with a dominant 45.2% share, valued at USD 8.8 Bn, supported by a strong ready-to-drink (RTD) culture built around convenience, portability, and “grab-and-go” occasions. The region’s growth mix is also changing: IWSR notes innovation is shifting away from hard seltzers, with hard seltzers falling from one in three new RTD launches in 2021 to one in nine in 2024, while flavoured alcoholic beverages (FABs) increased from 16% of launches in 2021 to 28% in 2024—a sign that North American demand is broadening beyond one category into more flavour-led, cocktail-style cans.
Regulation and compliance are another important regional factor shaping how brands compete in 2024 and into 2025. The U.S. Alcohol and Tobacco Tax and Trade Bureau (TTB) issued Industry Circular 2024-1 to remind companies that federal alcohol advertising rules apply across all media, including social media—pushing brands to be more disciplined about marketing claims and responsible messaging as canned RTDs expand.
Key Regions and Countries Insights
- North America
- US
- Canada
- Europe
- Germany
- France
- The UK
- Spain
- Italy
- Rest of Europe
- Asia Pacific
- China
- Japan
- South Korea
- India
- Australia
- Rest of APAC
- Latin America
- Brazil
- Mexico
- Rest of Latin America
- Middle East & Africa
- GCC
- South Africa
- Rest of MEA
Key Players Analysis
The Aquaponic Source — Founded in 2009, The Aquaponic Source focuses on aquaponic systems and farming education rather than canned alcohol. Its team notes operating a 3,000 sq ft aquaponic farm for 5+ years, and later building a 5,400 sq ft aquaponic greenhouse project (2015). These figures show a small, project-led operator in food production systems, not beverage manufacturing.
Hydrofarm Holdings Group, Inc. — Hydrofarm is a CEA/hydroponics supplier, not an RTD alcohol producer. In FY2024, it reported net sales of $190.3M (and $37.3M in Q4 2024, down 20.9% YoY). The business sells growing media, nutrients, and equipment—more aligned with indoor farming supply chains than canned alcoholic beverages distribution.
Greenlife Cyclopentanone — Online references for “Greenlife” point to multiple unrelated entities. One verified legal entity is GREENLIFE CHEM-SYNTHESIS PRIVATE LIMITED (India), incorporated 12 Dec 1995, with authorized share capital of ₹5,00,00,000 and paid-up capital of ₹4,44,78,000—a chemicals manufacturer profile, not a canned alcohol brand. If your “Greenlife Cyclopentanone” is different, it likely needs the exact legal name.
Top Key Players Outlook
- Bacardi Limited
- Diageo
- Brown-Forman
- Anheuser-Busch InBev
- Treasury Wine Estates
- Union Wine Company
- E. & J. Gallo Winery
- Asahi Group Holdings, Ltd.
- Pernod Ricard
- Integrated Beverage Group LLC (IBG)
Recent Industry Developments
In 2024, “Greenlife Cyclopentanone” does not show up as a canned alcoholic beverages company in credible public records; the closest verifiable match is GREENLIFE CHEM-SYNTHESIS PRIVATE LIMITED (India), a chemicals company incorporated on 12 Dec 1995. As of 21 Jun 2024, its reported authorized share capital is ₹5,00,00,000 and paid-up capital is ₹4,44,78,000—numbers that fit a chemical manufacturing/distribution profile, not an RTD alcohol brand.
Report Scope
Report Features Description Market Value (2024) USD 19.5 Bn Forecast Revenue (2034) USD 112.9 Bn CAGR (2025-2034) 19.2% Base Year for Estimation 2024 Historic Period 2020-2023 Forecast Period 2025-2034 Report Coverage Revenue Forecast, Market Dynamics, Competitive Landscape, Recent Developments Segments Covered By Product (Wine, RTD Cocktail, Hard Seltzers), By Alcohol Content (No-alcohol products (0.05%-0.5% ABV), Low-alcohol products (20.5% 3.0% ABV), Standard-alcohol products (3.0% 8.0% ABV), High-alcohol products (>8.0% ABV)), By Distribution Channel (On-trade, Liquor Stores, Online, Others) Regional Analysis North America – US, Canada; Europe – Germany, France, The UK, Spain, Italy, Rest of Europe; Asia Pacific – China, Japan, South Korea, India, Australia, Singapore, Rest of APAC; Latin America – Brazil, Mexico, Rest of Latin America; Middle East & Africa – GCC, South Africa, Rest of MEA Competitive Landscape Bacardi Limited, Diageo, Brown-Forman, Anheuser-Busch InBev, Treasury Wine Estates, Union Wine Company, E. & J. Gallo Winery, Asahi Group Holdings, Ltd., Pernod Ricard, Integrated Beverage Group LLC (IBG) Customization Scope Customization for segments, region/country-level will be provided. Moreover, additional customization can be done based on the requirements. Purchase Options We have three licenses to opt for: Single User License, Multi-User License (Up to 5 Users), Corporate Use License (Unlimited User and Printable PDF)  Canned Alcoholic Beverages MarketPublished date: Jan 2026add_shopping_cartBuy Now get_appDownload Sample
 -
-
- Bacardi Limited
- Diageo
- Brown-Forman
- Anheuser-Busch InBev
- Treasury Wine Estates
- Union Wine Company
- E. & J. Gallo Winery
- Asahi Group Holdings, Ltd.
- Pernod Ricard
- Integrated Beverage Group LLC (IBG)
Our Clients
- 174291
- Jan 2026


