
Global Caffeinated Beverages Market Size, Share Analysis Report By Product (Wine, RTD Cocktails, Hard Seltzers), By Alcohol Content (No-alcohol Products (0.05%-0.5% ABV), Low-alcohol Products (Greater-than 0.5%-3.0% ABV), Standard-alcohol Products (3.0%-8.0% ABV), High-alcohol Products (Greater-than8.0% ABV)), By Distribution Channel (On-trade, Liquor Stores, Online, Others) , By Region and Companies - Industry Segment Outlook, Market Assessment, Competition Scenario, Trends and Forecast 2025-2034
- Published date: Dec 2025
- Report ID: 172498
- Number of Pages: 308
- Format:
-
keyboard_arrow_up
Quick Navigation
Report Overview
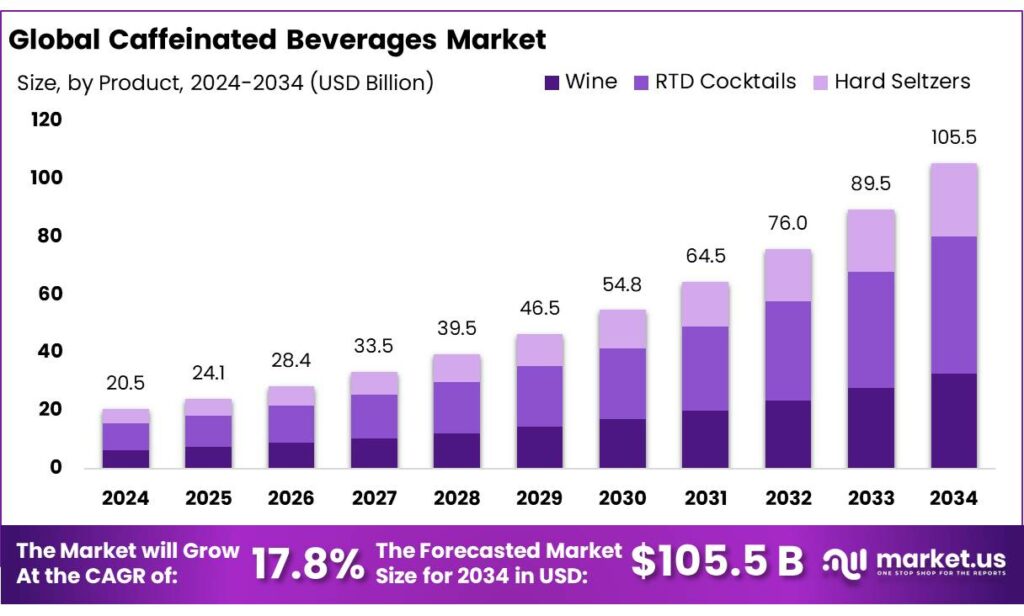
The Global Caffeinated Beverages Market size is expected to be worth around USD 105.5 Billion by 2034, from USD 20.5 Billion in 2024, growing at a CAGR of 17.8% during the forecast period from 2025 to 2034. In 2024 North America held a dominant market position, capturing more than a 45.9% share, holding USD 9.4 Billion in revenue.
Caffeinated beverages sit at the center of everyday “alertness” routines, spanning coffee, tea, cola soft drinks, and energy drinks. On the supply side, the industry is anchored by two huge agricultural value chains—coffee and tea—then extended by industrial caffeine (often sourced from coffee/tea extracts or synthesized) that is formulated into ready-to-drink (RTD) products. Demand is broad-based: coffee and tea remain the default daily choices, while energy drinks and caffeinated sodas compete on convenience, flavor innovation, and performance-style positioning.
- In the 2023/24 coffee year, world coffee consumption is estimated at about 177.0 million 60-kg bags, reflecting the category’s deep penetration across both producing and non-producing countries. Tea is similarly industrialized: FAO notes world tea production reached 6.8 million tonnes in 2023, and tea imports totaled 1.8 million tonnes—signals of a highly traded market with large blending, packing, and brand-led distribution networks.
Key driving factors combine lifestyle and regulation-led reformulation. Faster work patterns and longer screen-time culture keep “energy management” demand steady, while product design shifts toward lower sugar, cleaner labels, and more transparent caffeine communication. In the U.S., FDA consumer guidance commonly cited by industry references 400 mg/day of caffeine for most healthy adults as an amount not generally associated with negative effects—encouraging brands to portion caffeine responsibly and communicate content more clearly.
- In the EU, Regulation (EU) 1169/2011 requires a “high caffeine” warning and quantitative caffeine indication for beverages containing more than 150 mg/L caffeine, shaping how energy drinks are labeled and marketed.
Government and public-health initiatives increasingly influence the category’s future shape, especially for sugary caffeinated drinks. WHO recommends reducing “free sugars” to <10% of total energy intake, with additional benefits at <5% (about 25 g/day), reinforcing pressure on sweetened colas and energy drinks to reformulate. Policy tools are also spreading: the World Bank’s global SSB tax database notes national-level sugar-sweetened beverage taxes are in effect in more than 100 countries and territories, which tends to accelerate low/zero-sugar line extensions and pricing architecture changes.
Key Takeaways
- Caffeinated Beverages Market size is expected to be worth around USD 105.5 Billion by 2034, from USD 20.5 Billion in 2024, growing at a CAGR of 17.8%.
- RTD Cocktails held a dominant market position, capturing more than a 45.8% share in the caffeinated beverages market.
- Standard-alcohol Products (3.0%–8.0% ABV) held a dominant market position, capturing more than a 48.2% share.
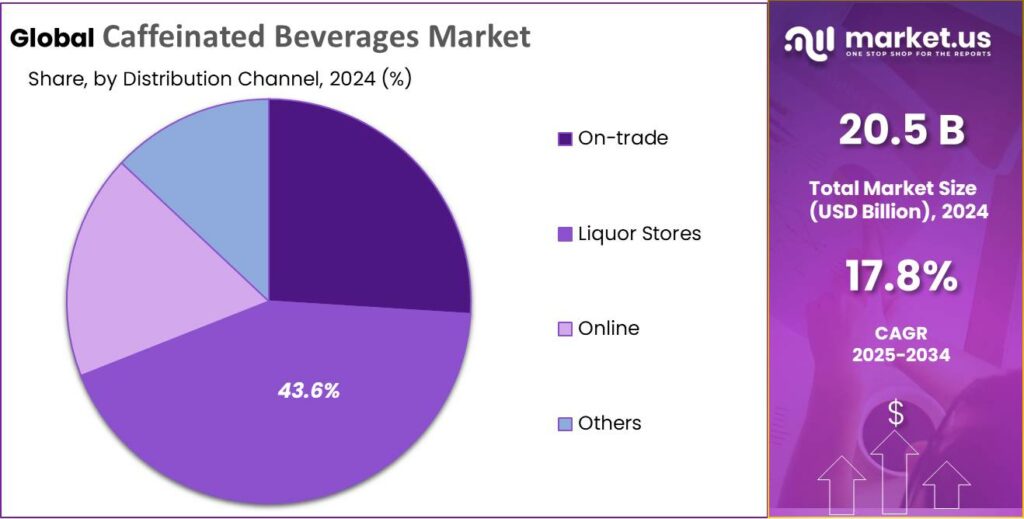
- Liquor Stores held a dominant market position, capturing more than a 43.6% share in the caffeinated beverages market.
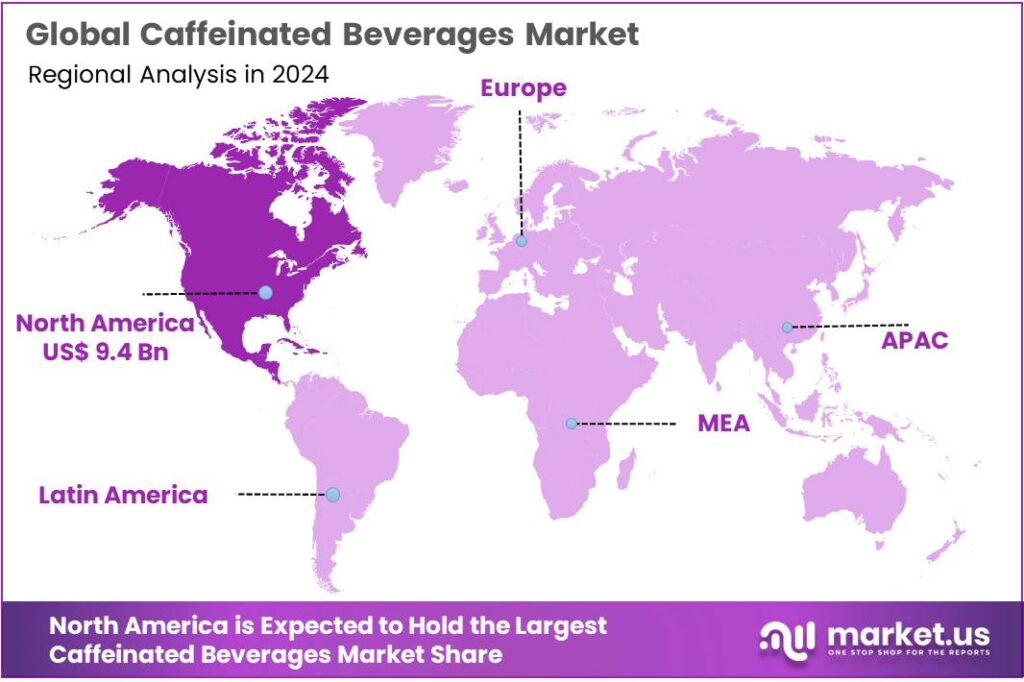
- North America region emerged as a dominant force in the global caffeinated beverages market, capturing a 45.9% share and generating approximately USD 9.4 billion.
By Product Analysis
RTD Cocktails dominate with a 45.8% share, supported by convenience and on-the-go consumption trends.
In 2024, RTD Cocktails held a dominant market position, capturing more than a 45.8% share in the caffeinated beverages market, as consumers increasingly preferred ready-to-drink formats that combine energy, flavor, and ease of use. The segment benefited from strong demand among younger adults seeking convenient beverages suited for social occasions without the need for preparation.
The presence of caffeine further supported demand by appealing to consumers looking for mild stimulation alongside refreshment. Moving into 2025, adoption remained steady as lifestyle patterns continued to favor quick-serve beverage options aligned with busy urban routines. The segment’s strong position was reinforced by evolving drinking habits, increased acceptance of canned alcoholic and non-alcoholic cocktails, and growing preference for products that offer both functional and experiential value in a single serving.
By Alcohol Content Analysis
Standard-alcohol products lead with a 48.2% share, balancing taste, effect, and responsible consumption.
In 2024, Standard-alcohol Products (3.0%–8.0% ABV) held a dominant market position, capturing more than a 48.2% share in the caffeinated beverages market, as they aligned well with consumer demand for moderate alcohol strength combined with functional stimulation. These products were widely preferred for social and casual drinking occasions, where consumers sought controlled alcohol intake without compromising flavor or experience.
The standard-alcohol range offered a balanced profile, making it suitable for repeat consumption and longer social settings. Moving into 2025, demand remained stable as consumers continued to favor beverages that deliver mild energy support alongside moderate alcohol content. The segment’s strong position was further supported by regulatory acceptance, broad availability across retail formats, and its appeal to health-conscious adults looking for moderation without sacrificing enjoyment.
By Distribution Channel Analysis
Liquor stores lead distribution with a 43.6% share, supported by strong in-store visibility and trusted purchase habits.
In 2024, Liquor Stores held a dominant market position, capturing more than a 43.6% share in the caffeinated beverages market, as they remained the primary point of sale for alcohol-based functional drinks. Consumers continued to rely on liquor stores for product variety, verified alcohol content, and immediate availability, which supported consistent footfall throughout 2024. The channel benefited from well-established retail networks and trained staff that helped guide purchasing decisions, especially for newer caffeinated beverage formats.
Moving into 2025, liquor stores maintained their relevance as impulse purchases and single-serve packs gained popularity, particularly in urban areas. The segment’s leadership was further strengthened by strong shelf placement, promotional displays, and consumer preference for physical inspection before purchase, reinforcing liquor stores as a trusted and convenient distribution channel for caffeinated alcoholic beverages.
Key Market Segments
By Product
- Wine
- Still
- Fortified
- Low-alcohol
- Sparkling
- RTD Cocktails
- Malt based
- Spirit based
- Wine based
- Hard Seltzers
- Malt based
- Spirit based
- Wine based
By Alcohol Content
- No-alcohol Products (0.05%-0.5% ABV)
- Low-alcohol Products (>0.5%-3.0% ABV)
- Standard-alcohol Products (3.0%-8.0% ABV)
- High-alcohol Products (>8.0% ABV)
By Distribution Channel
- On-trade
- Liquor Stores
- Online
- Others
Emerging Trends
Rise of Functional and Health-Conscious Caffeinated Beverages
One of the most notable current trends in caffeinated beverages is the shift toward functional, health-oriented drinks that offer energy along with wellness benefits, lower sugar, and smarter ingredients. This trend is not just a marketing angle—it reflects real changes in what people choose to drink every day.
A clear way to see this trend is in how caffeine consumption patterns are shifting. In the United States, for example, coffee supplies the largest share of daily caffeine intake at 69%, followed by carbonated soft drinks at 15.4%, tea at 8.8%, and energy drinks at 6.3%. This breakdown shows that even traditional caffeine sources are being repurposed in lighter, more functional formats as overall tea and soft drink consumption declines while caffeine intake rises.
Part of what is driving this trend is consumer demand for reduced sugar and cleaner labels. Many people today know that high sugar intake can contribute to obesity and other health problems, so they are looking for caffeinated drinks that don’t undo their health goals. Worldwide, the World Health Organization has recommended reducing free sugars in beverages, and research suggests that increasing the price of sugar-sweetened drinks by at least 20% can significantly cut consumption.
- According to recent industry data, in 2023 more than 1,900 new caffeine-based food and beverage products were launched globally, totaling over 7,400 metric tons of caffeine ingredient demand—with caffeinated beverages dominating with 161,000 metric tons used that year.
Drivers
Health Rules Are Reshaping Caffeinated Beverage Demand
One major driving factor for caffeinated beverages is the way health policy and public guidance are pushing the whole category to “feel lighter” while still delivering energy. People still want caffeine for focus and daily routines, but they are also paying closer attention to sugar, calories, and serving size. That mix is changing what sells fastest: low- or no-sugar energy drinks, cold coffees with simpler labels, unsweetened teas, and smaller cans designed for controlled intake.
Government action is a big part of this shift because it directly changes how products are formulated and priced. In the UK, the Soft Drinks Industry Levy (SDIL) has become a strong example of policy shaping what manufacturers put on shelves. The UK government reports that after SDIL-driven reformulation, 89% of soft drinks in scope were brought below 5g sugar per 100ml, and the country saw a 47% average reduction in sugar in drinks covered by the levy between 2015 and 2024.
The market pull is also backed by trusted public health guidance on caffeine itself. The U.S. FDA cites 400 mg per day as an amount “not generally associated with negative effects” for most adults, while noting that sensitivity varies from person to person. That single number shapes how brands design products: it influences can size, “per serving” caffeine positioning, and the rise of “moderate energy” options meant for everyday use. It also supports clearer consumer education—many buyers want the benefit of caffeine without crossing into the level that makes them feel jittery or disrupts sleep.
- The International Coffee Organization estimates world coffee consumption rebounded to about 177.0 million 60-kg bags in 2023/24, showing how steady coffee drinking remains even during supply and price swings. Tea is similarly large-scale: FAO reports global tea production reached 6.8 million tonnes in 2023, with tea imports totaling 1.8 million tonnes the same year, highlighting how trade and packaged formats keep tea widely accessible.
Restraints
Health Concerns and Regulation: A Real Restraining Force on Caffeinated Beverages
One of the strongest restraining forces holding back the growth of caffeinated beverages is public health concerns and regulatory action driven by governments and world health authorities. As people become more aware of the health risks associated with excessive intake of caffeine, sugar, and related stimulants, both consumers and policymakers are pushing back against products they see as potentially harmful. This trend doesn’t just influence consumer choice; it shapes how companies develop, market, and even label their products.
Health concerns around caffeinated drinks are not new, but they are becoming more widely recognized in official guidance and research. Multiple studies show that too much caffeine or frequent consumption of high-caffeine products—particularly energy drinks—can cause headaches, sleep disturbances, and nervous system discomfort, especially when intake is heavy or poorly managed.
Caffeine is a stimulant that can affect heart rate and sleep patterns, and while moderate intake up to 400 mg per day is often cited as generally safe for healthy adults by the U.S. Food and Drug Administration, exceeding that can lead to negative effects for many people. The FDA itself points out that pure or highly concentrated caffeine products are so strong that they “can have serious health consequences, including death” at roughly 1,200 mg or lower of rapid intake.
Beyond these general health limits, the broader concern about sugar and caffeine together has led to active steps by governments to deter consumption of sugar-sweetened and high-stimulation beverages. The World Health Organization has recommended global action to curb sugary drink consumption, finding that fiscal policies that raise prices by at least 20% can lead to proportional drops in consumption and related health improvements such as reductions in obesity and type 2 diabetes.
Opportunity
Low-Sugar RTD Coffee and Tea Is a Clear Growth Opening
A major growth opportunity in caffeinated beverages is the fast expansion of ready-to-drink (RTD) coffee and tea that delivers everyday energy with less sugar and clearer caffeine information. This opportunity is growing because many shoppers still want caffeine for work, travel, and study, but they also want to feel in control of what they drink. RTD formats make that easy: a bottle or can is portable, consistent in taste, and simple to track as a single serving.
Health policy is quietly turning this into a bigger commercial runway. The World Health Organization has said that fiscal measures that raise sugary drink retail prices by at least 20% are expected to lead to proportional reductions in consumption. That message matters for caffeinated beverages because many high-caffeine products historically relied on sweetness to balance bitterness.
The UK offers a practical example of how policy creates whitespace for better-for-you caffeinated options. Government documentation on the Soft Drinks Industry Levy (SDIL) notes 46% reduction in sugar in soft drinks in scope of the levy and shows how reformulation pushed a large share of products below the key threshold, with 89% of the market moving to less than 5g sugar per 100ml. More recently, the UK has moved to tighten the levy further by lowering the lower threshold to 4.5g sugar per 100ml, and reporting indicates the expanded approach is expected to raise up to £45 million per year from 2028.
At the same time, the underlying caffeine base is huge and dependable, which makes innovation less risky. The International Coffee Organization estimates world coffee consumption rebounded to about 177.0 million 60-kg bags in 2023/24. Tea is also massive: FAO reports that world tea production reached 6.8 million tonnes in 2023, and total tea imports were 1.8 million tonnes in the same year. Another reason this is a strong opportunity is that trusted health guidance supports “moderate caffeine” positioning. The U.S. FDA notes that 400 mg per day is an amount not generally associated with negative effects for most adults.
Regional Insights
North America leads caffeinated beverage demand with a 45.9% share and USD 9.4 billion in 2024, buoyed by robust consumption patterns.
In 2024, the North America region emerged as a dominant force in the global caffeinated beverages market, capturing a 45.9% share and generating approximately USD 9.4 billion in revenue, underpinned by strong consumer preference for coffee, energy drinks, and carbonated caffeinated formats. This leadership reflected well-established consumption habits supported by high disposable incomes, mature retail and foodservice networks, and a pervasive culture of on-the-go beverage consumption that spans urban and suburban populations throughout the United States and Canada.
The region’s demand was further strengthened by ongoing product innovation, including low-sugar and plant-based caffeinated options that resonate with health-conscious adults and younger consumers seeking functional benefits alongside traditional taste appeal. Retail channels such as convenience stores, supermarkets, and quick-service outlets played a central role in supporting accessibility and trial purchases, contributing to broad market reach.
North America maintained its dominant position, with sustained consumer interest in ready-to-drink coffee and energy solutions that align with busy lifestyles and wellness trends. Continued investment by beverage manufacturers in premium formats, new flavor extensions, and expanded distribution helped reinforce the region’s strong performance.
Key Regions and Countries Insights
- North America
- US
- Canada
- Europe
- Germany
- France
- The UK
- Spain
- Italy
- Rest of Europe
- Asia Pacific
- China
- Japan
- South Korea
- India
- Australia
- Rest of APAC
- Latin America
- Brazil
- Mexico
- Rest of Latin America
- Middle East & Africa
- GCC
- South Africa
- Rest of MEA
Key Players Analysis
Bacardi Limited: Bacardi Limited is one of the world’s largest privately held spirits producers, offering a broad portfolio of more than 200 brands including rum, vodka, gin, and tequila, which increasingly extend into caffeinated RTD cocktails and ready-serve mixes to meet evolving consumer tastes. Headquartered in Bermuda and operating in over 150 countries with 8 000+ employees, Bacardi drives product innovation and global distribution reach across traditional and emerging beverage segments.
Brown-Forman: Brown-Forman Corporation is a major U.S. spirits and wine producer with USD 5.37 billion in revenue in 2025, known for flagship brands such as Jack Daniel’s, Woodford Reserve, and Korbel. The company’s broad portfolio serves multiple beverage categories, including contributions to caffeinated mixers and RTD collaborations that appeal to contemporary cocktail consumers across global markets.
Anheuser-Busch InBev: Anheuser-Busch InBev (AB InBev) is the world’s largest brewer, generating over USD 54 billion in revenue in recent reporting periods, with global brands like Budweiser and Corona. The company’s expanding non-beer and flavored malt beverage lines increasingly factor caffeination and hybrid formats into its product mix to capture shifts in adult beverage consumption patterns.
Top Key Players Outlook
- Bacardi Limited
- Diageo
- Brown-Forman
- Anheuser-Busch InBev
- Treasury Wine Estates
- Union Wine Company
- E. & J. Gallo Winery
- Asahi Group Holdings, Ltd.
- Pernod Ricard
- Integrated Beverage Group LLC (IBG)
Recent Industry Developments
In 2024, Diageo plc held a strong position in the caffeinated beverages and broader alcoholic drinks sector, with a reported USD 20.269 billion in revenue, supported by its wide portfolio of spirits and ready‑to‑drink products that increasingly include caffeinated formats such as coffee‑inspired liqueurs and mixed cocktails.
In 2024, Anheuser‑Busch InBev (AB InBev) remained the world’s largest brewer with a strong footprint in beverages that intersect with caffeinated and ready‑to‑drink trends, reporting USD 59.8 billion in revenue and operating in more than 150 countries with a portfolio of over 500 global and local brands.
Report Scope
Report Features Description Market Value (2024) USD 20.5 Bn Forecast Revenue (2034) USD 105.5 Bn CAGR (2025-2034) 17.8% Base Year for Estimation 2024 Historic Period 2020-2023 Forecast Period 2025-2034 Report Coverage Revenue Forecast, Market Dynamics, Competitive Landscape, Recent Developments Segments Covered By Product (Wine, RTD Cocktails, Hard Seltzers), By Alcohol Content (No-alcohol Products (0.05%-0.5% ABV), Low-alcohol Products (Greater-than 0.5%-3.0% ABV), Standard-alcohol Products (3.0%-8.0% ABV), High-alcohol Products (Greater-than8.0% ABV)), By Distribution Channel (On-trade, Liquor Stores, Online, Others) Regional Analysis North America – US, Canada; Europe – Germany, France, The UK, Spain, Italy, Rest of Europe; Asia Pacific – China, Japan, South Korea, India, Australia, Singapore, Rest of APAC; Latin America – Brazil, Mexico, Rest of Latin America; Middle East & Africa – GCC, South Africa, Rest of MEA Competitive Landscape Bacardi Limited, Diageo, Brown-Forman, Anheuser-Busch InBev, Treasury Wine Estates, Union Wine Company, E. & J. Gallo Winery, Asahi Group Holdings, Ltd., Pernod Ricard, Integrated Beverage Group LLC (IBG) Customization Scope Customization for segments, region/country-level will be provided. Moreover, additional customization can be done based on the requirements. Purchase Options We have three licenses to opt for: Single User License, Multi-User License (Up to 5 Users), Corporate Use License (Unlimited User and Printable PDF)  Caffeinated Beverages MarketPublished date: Dec 2025add_shopping_cartBuy Now get_appDownload Sample
 -
-
- Bacardi Limited
- Diageo
- Brown-Forman
- Anheuser-Busch InBev
- Treasury Wine Estates
- Union Wine Company
- E. & J. Gallo Winery
- Asahi Group Holdings, Ltd.
- Pernod Ricard
- Integrated Beverage Group LLC (IBG)
Our Clients
- 172498
- Dec 2025


