


Global Air Conditioning Market Overview
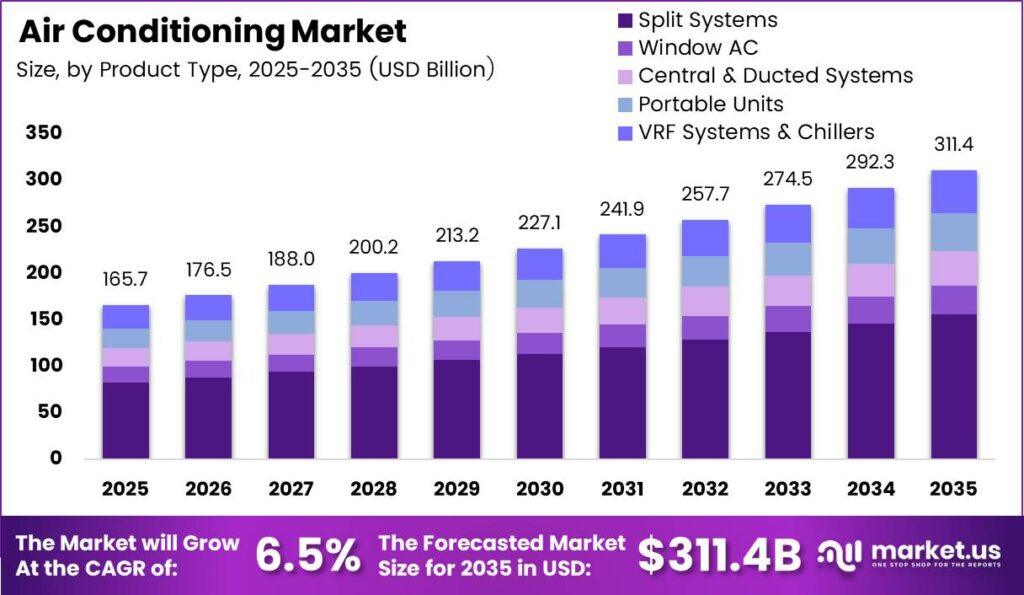
The global Air Conditioning Market is undergoing a structural transition, projected to scale from USD 165.7 Billion in 2025 to USD 311.4 Billion by 2035, expanding at a value CAGR of 6.5% during the forecast period 2026 to 2035. Concurrently, physical factory production will grow at a volume CAGR of 5.0%, lifting annual global shipments from 200.0 million units in 2024 to 342.1 million units by 2035. This structural growth premium—where revenue expansion outpaces physical volume—reflects a rising global Average Selling Price (ASP) per unit driven by strict energy efficiency mandates, the transition to low-GWP refrigerants, and premium variable-speed tech adoption.
The air conditioning market covers mechanical cooling systems designed to regulate indoor temperature, humidity, and air quality across residential, commercial, and industrial settings. Product categories include split systems, window units, central and ducted systems, portable units, variable refrigerant flow systems, and chillers. Distribution occurs through offline showrooms and wholesale channels as well as online e-commerce platforms.
Core Strategic Takeaways
- Product Type Dominance: Split Systems dominate the global structural architecture, capturing a 48.30% market share due to their flexible installation and residential suitability.
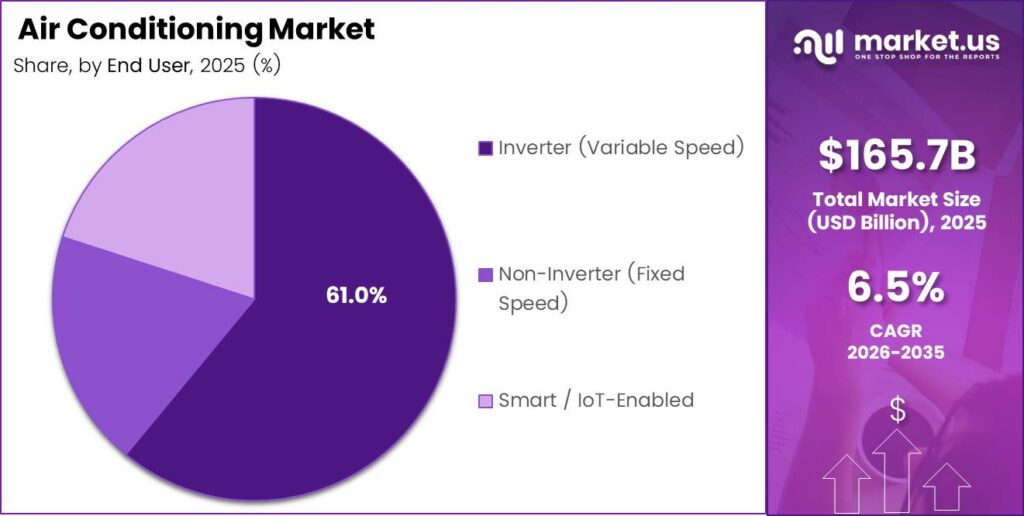
- Technology Leadership: Inverter (Variable Speed) systems lead the technological landscape with a 61.00% share, driven by output modulation that yields 30% to 50% energy savings over fixed-speed alternatives.
- Application Splits: Residential holds the largest application share at 54.60%, anchored by household-level replacement and massive first-time ownership demand in cooling-deprived, high-temperature emerging markets.
- Distribution Footprint: Offline channels (Showrooms, Wholesale) continue to dominate the procurement landscape with a 74.80% market share.
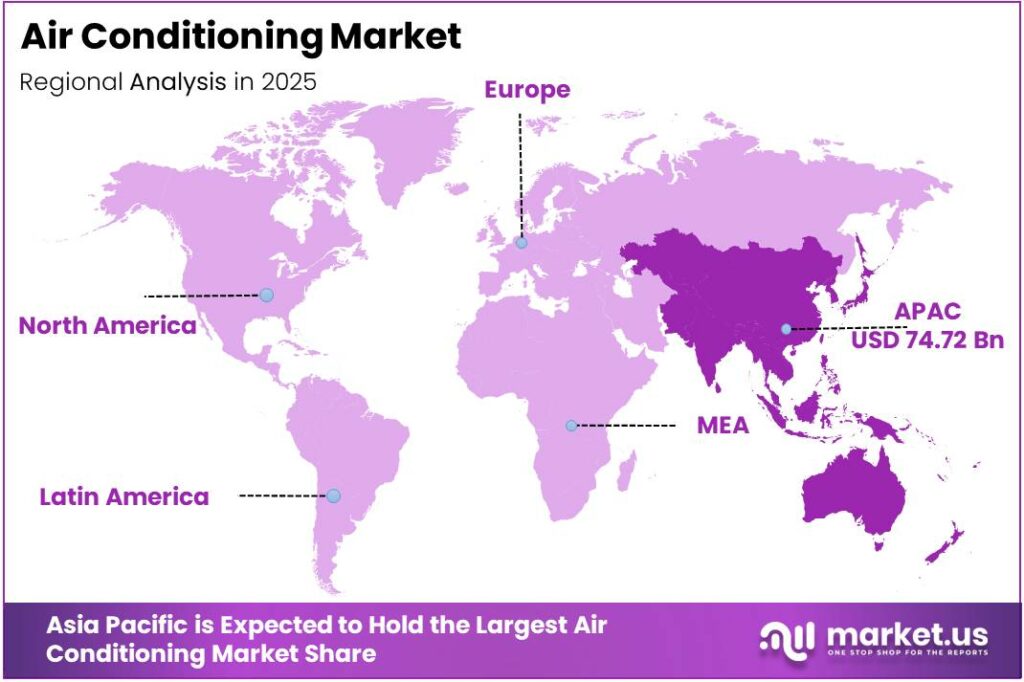
- Geographic Anchors: Asia Pacific is the dominant region with a 45.10% market share, valued at USD 74.72 Billion. Europe represents the fastest-growing regional market by value, accelerated by strict regulatory pushes.
Governments across South Asia and Southeast Asia are tightening minimum energy performance standards to reduce peak electricity loads from cooling. The European Union has introduced refrigerant placement bans effective from January 2025, prohibiting single-split systems using high-global-warming-potential F-gases. These regulations accelerate product replacement cycles and raise the floor for technology investment across the supply chain.
According to the International Energy Agency, global air conditioner sales reached 200 million units in 2024, signaling that cooling has become a mass-market necessity rather than a discretionary purchase. Global electricity demand for space cooling reached around 2,900 TWh, having increased 50% since 2015, as reported by the International Energy Agency. This consumption trajectory means grid operators, utilities, and equipment manufacturers all face rising pressure to deliver efficiency gains at scale.
Air Conditioning Market Volume Forecast
Driven by expanding electrification, rising global temperatures, and rapid urbanization across emerging economies, global air conditioner shipment volume is projected to scale from 200.0 million units in 2024 to 342.1 million units by 2035.
While the broader air conditioning market revenue expands at a CAGR of 6.5%, physical factory shipments will grow at a slightly more conservative volume CAGR of 5.0%. This divergence indicates a structural rise in the Average Selling Price (ASP) per unit, shifting from approximately $789 in 2025 to over $910 by 2035. This pricing trajectory is primarily driven by the forced adoption of premium components, intelligent IoT integrations, and stricter regulatory baselines.
Annual Shipments vs. Revenue Expansion (2024–2035)
| Year | Market Revenue (USD Billion) | Shipment Volume (Million Units) | Year-over-Year Volume Growth |
|---|---|---|---|
| 2024 (Base) | 155.6 | 200.0 | — |
| 2025 | 165.7 | 210.0 | 5.0% |
| 2026 | 176.5 | 220.5 | 5.0% |
| 2027 | 187.9 | 231.5 | 5.0% |
| 2028 | 200.2 | 243.1 | 5.0% |
| 2029 | 213.2 | 255.3 | 5.0% |
| 2030 | 227.0 | 268.0 | 5.0% |
| 2031 | 241.8 | 281.4 | 5.0% |
| 2032 | 257.5 | 295.5 | 5.0% |
| 2033 | 274.2 | 310.3 | 5.0% |
| 2034 | 292.1 | 325.8 | 5.0% |
| 2035 (Target) | 311.4 | 342.1 | 5.0% |
Source:Market.us
Structural Volume Drivers
- The Emerging Market Penetration Gap: Volume scaling is heavily back-weighted toward first-time retail buyers in South Asia, Southeast Asia, and Sub-Saharan Africa. Lower-cost window units and entry-level split systems drive massive initial volume additions, offsetting the lower revenue per unit in these regions.
- Regulatory Compression on Fixed-Speed Units: Stringent minimum energy performance standards (MEPS) globally are systematically squeezing fixed-speed units out of production. Manufacturers are aggressively retooling factories to prioritize variable-speed inverter compressors, altering global bulk manufacturing volume balances.
- Commercial Replacement and Infrastructure Cycles: Commercial demand is sustained by a continuous replacement cycle, where aging rooftop units and central chillers are swapped for high-efficiency VRF systems. Global investments in digital infrastructure—specifically data centres—maintain high-volume demand for heavy industrial chillers to manage thermal baselines.
Product Type Analysis
Split Systems dominate with 48.30% due to flexible installation and residential suitability.
In 2025, Split Systems held a dominant market position in the By Product Type segment of the Air Conditioning Market, with a 48.30% share. These systems suit a wide range of installation environments, from single rooms to multi-room configurations, without requiring ductwork. This structural flexibility makes them the default choice for both residential developers and commercial fit-out contractors, reinforcing their share advantage across all major regional markets.
Window AC units address price-sensitive first-time buyers in emerging urban markets where installation complexity is a barrier. These units offer the lowest entry cost and require no professional split-system installation, making them accessible to lower-income households. As per our research, Window AC remains a meaningful volume category in South Asia, Africa, and Latin America, where affordability drives the initial purchase decision ahead of energy efficiency.
Central and Ducted Systems serve large commercial buildings, hospitality properties, and institutional facilities where centralized control and uniform air distribution are priorities. These systems command higher per-unit revenue and generate recurring service and maintenance contracts. Trane Technologies reported a commercial HVAC backlog of USD 10.7 Billion in Q1 2026, more than 30% above year-end 2025 levels, confirming that commercial demand for large-system cooling remains structurally strong.
Portable Units, VRF Systems, and Chillers collectively address the remaining share. Portable units serve temporary or rental environments. VRF systems suit mid-rise commercial buildings requiring zone-level control. Chillers support large-scale district and industrial cooling, with a growing role in data-center thermal management as digital infrastructure investment expands globally.
Technology Analysis
Inverter (Variable Speed) dominates with 61.00% due to energy savings and lower operating costs.
In 2025, Inverter (Variable Speed) systems held a dominant market position in the By Technology segment of the Air Conditioning Market, with a 61.00% share. Inverter compressors modulate output to match cooling load rather than cycling on and off at full power. This approach delivers energy savings of 30 to 50% versus fixed-speed alternatives, a performance gap that governments are increasingly encoding into mandatory efficiency standards, making inverter adoption self-reinforcing across regulated markets.
According to the International Energy Agency, air conditioners and electric fans account for nearly 20% of electricity used in buildings globally, equivalent to about 10% of total global electricity consumption. This consumption concentration creates direct regulatory and economic pressure on buyers to select higher-efficiency inverter units over fixed-speed alternatives. Distributors and retailers who prioritize inverter models in their floor mix capture both the premium price point and stronger after-sale service attachment.
Non-Inverter (Fixed Speed) systems retain relevance in price-sensitive markets where upfront cost outweighs lifetime operating savings. European Commission data shows that the EU installed 2.11 million heat pumps in 2024, after 2.7 million in 2023 and 2.8 million in 2022, reflecting a policy-driven shift toward variable-capacity and reversible systems that compresses remaining fixed-speed demand in regulated markets. This creates a structural ceiling on non-inverter volume in Europe and accelerates its decline in any market that adopts comparable efficiency mandates.
Smart and IoT-Enabled systems represent the highest-growth technology sub-segment. These systems connect to building management platforms, enable remote diagnostics, and generate operational data that supports predictive maintenance contracts. As per our research, smart AC penetration remains in the low single digits as a share of the total installed base, positioning the sub-segment as an early-stage but high-value opportunity for manufacturers and software-enabled service providers.
Application Analysis
Residential dominates with 54.60% due to household-level replacement and first-time ownership demand.
In 2025, Residential held a dominant market position in the By Application segment of the Air Conditioning Market, with a 54.60% share. Data from the International Energy Agency shows that about 3.5 billion people live in high-temperature regions but only approximately 15% own an air conditioner. This penetration gap represents the single largest volume opportunity in the market, as rising incomes and urban migration convert latent demand into active purchasing across South Asia, Southeast Asia, and Sub-Saharan Africa.
Commercial applications cover office buildings, retail spaces, hospitality properties, and healthcare facilities. Commercial operators face stronger regulatory pressure on energy efficiency and indoor air quality than residential buyers, which raises average unit value and accelerates replacement cycles. Trane Technologies reported a commercial HVAC backlog of USD 10.7 Billion in Q1 2026, more than 30% above year-end 2025, confirming that commercial end-user demand remains structurally elevated above pre-2024 levels.
Industrial applications serve process cooling, cold-chain logistics, pharmaceutical manufacturing, and data-center thermal management. This sub-segment has a lower unit count than residential or commercial but commands substantially higher per-installation revenue. Voltas signed a binding term sheet with Atomberg Innovation for a Chennai compressor-manufacturing joint venture targeting 2.8 million units of annual capacity with planned investment of approximately INR 200 crore in FY2027, signaling that India-based manufacturers are building domestic supply chains to serve both commercial and industrial segments at scale.
Distribution Channel Analysis
Offline (Showrooms, Wholesale) dominates with 74.80% due to product demonstration and installer relationships.
In 2025, Offline (Showrooms, Wholesale) held a dominant market position in the By Distribution Channel segment of the Air Conditioning Market, with a 74.80% share. Physical retail and trade channels remain dominant because AC purchases are high-involvement decisions where buyers seek in-person demonstration, financing support, and installation coordination. Wholesale networks also serve the installer and contractor base that accounts for the majority of commercial and new-build residential volume.
As per our research, India’s projected cooling demand trajectory implies demand for one new air conditioner every 15 seconds by 2037. This installation rate creates structural demand for a deep and dense offline dealer and installer network that online channels alone cannot support. Carrier reported USD 21.75 Billion in full-year 2025 sales, while generating USD 909 million in free cash flow, confirming that manufacturers with broad physical distribution retain strong earnings capacity relative to the channel’s revenue base.
Online channels hold the remaining 25.20% share and are growing as e-commerce penetration deepens in urban markets. Digital platforms reduce customer acquisition costs and enable direct-to-consumer pricing transparency. However, last-mile installation logistics and the need for certified technicians constrain the fully self-serve online model, meaning e-commerce growth supplements rather than replaces the offline installer channel in most markets.
Air Conditioning Market Key Segments
By Product Type
- Split Systems
- Window AC
- Central & Ducted Systems
- Portable Units
- VRF Systems & Chillers
By Technology
- Inverter (Variable Speed)
- Non-Inverter (Fixed Speed)
- Smart / IoT-Enabled
By Application
- Residential
- Commercial
- Industrial
By Distribution Channel
- Offline (Showrooms, Wholesale)
- Online (E-commerce)
Air Conditioning Market Regional Analysis
Asia Pacific Dominates the Air Conditioning Market with a Market Share of 45.10%, Valued at USD 74.72 Billion
Asia Pacific commands the largest share of the global air conditioning market, underpinned by high population density, rising urban incomes, and intensifying heat events. Data from the International Energy Agency shows India sold a record 14 million air-conditioning units in 2024, 27% above the 11 million sold in 2023. Fewer than 20% of Indian households owned an air conditioner in 2024, confirming that first-time ownership will drive volume in the region for at least the next decade.
India’s cooling infrastructure is scaling rapidly to meet this demand. Cooling contributed an estimated 60 GW to India’s total peak electricity load in 2024, while each additional 1°C of daily average temperature added more than 7 GW of additional daily peak demand, as reported by the International Energy Agency. India’s peak electricity load rose from 148 GW in 2014 to 250 GW in 2024, a 68% increase. Carrier announced a USD 100 million investment to expand manufacturing in Sri City, India, while LG received eligibility for INR 705.74 crore in incentives tied to its Ranjangaon, Maharashtra expansion, underscoring how global manufacturers are committing capital to serve Indian demand directly from domestic facilities.
Voltas reported segment revenue of INR 4,157 crore in FY ended March 2025, up 13% from INR 3,683 crore the prior year, while consolidated total income reached INR 15,737 crore, a 24% increase from INR 12,734 crore. This revenue trajectory confirms that India-focused players are capturing outsized growth relative to the global market average, creating a competitive intensity that global entrants must account for when pricing and distributing in the subcontinent.
Europe is the fastest-growing regional market, driven by heat-pump adoption, energy-efficiency mandates, and building electrification programs. Preliminary data across 13 EU member states indicated heat-pump market growth of 11% in 2025, reaching 2.34 million units, as reported by the European Commission. Around 28 million heat pumps were installed in Europe as of 2025, including approximately 26 million in the European Union. The EU heat-pump industry maintained annual production capacity of 7.7 million units in 2025, and Finland reached 524 heat pumps per 1,000 households, the highest reported level in the EU, setting a benchmark for what deep electrification of building cooling and heating can achieve at national scale.
North America: High-Value Replacements and Data-Center Precision Cooling
- Market Characterization: North America stands as a highly mature, high-value market segment second only to Asia Pacific in revenue generation, with the United States acting as the primary volume anchor. Rather than first-time buyer acquisition, the regional market velocity is heavily sustained by the upgrade and replacement of aging infrastructures across residential and commercial properties.
- Regulatory Compliance Compression: The regional environment is governed by strict, rolling regulatory changes. System designs are closely tied to Seasonal Energy Efficiency Ratio (SEER2) baselines and federal tax credits, driving automated consumer transitions toward premium, smart-enabled cooling and heat pump frameworks.
- The Hyperscale Infrastructure Boom: A notable structural growth factor is the aggressive expansion of hyperscale and colocation data centers catering to modern artificial intelligence (AI) workloads. North America commands a dominant global share of this digital infrastructure sector, creating dense, non-discretionary volume demand for heavy industrial chillers and specialized liquid precision cooling machinery.
Middle East and Africa (MEA): Extreme Climate Mandates and Infrastructure Giga-Projects
- Market Characterization: The Middle East represents an intense, climate-linked market sector where continuous indoor mechanical cooling is categorized as a baseline survival necessity rather than a discretionary purchase. The regional market landscape is highly localized, with Saudi Arabia and the UAE serving as the core investment engines.
- Giga-Project Demand Pipelines: Growth is heavily driven by unprecedented capital expenditures channeled into mixed-use real estate developments, transport networks, and urban megaprojects. These massive architectural spaces demand sweeping, master-planned cooling frameworks right from the initial foundation phases.
- The Transition to Variable Refrigerant Flow (VRF): Because regional ambient summer temperatures consistently breach 45°C, cooling represents an enormous draw on national energy grids. To combat this, regional building codes are aggressively shifting away from traditional packaged rooftop systems toward highly versatile VRF configurations, which decrease localized energy draw by up to 52% under harsh, dry conditions.
Air Conditioning Market Key Regions and Countries
North America
- US
- Canada
Europe
- Germany
- France
- The UK
- Spain
- Italy
- Rest of Europe
Asia Pacific
- China
- Japan
- South Korea
- India
- Australia
- Rest of APAC
Latin America
- Brazil
- Mexico
- Rest of Latin America
Middle East and Africa
- GCC
- South Africa
- Rest of MEA
Drivers
Extreme heat events are converting air conditioning from a discretionary appliance into a resilience purchase, shortening replacement cycles and lifting first-time installation rates in hot-climate markets. Global air-conditioner shipments reached approximately 200 million units during 2024 heatwaves, while cooling-related peak electricity demand reached roughly 1,400 GW in 2025. These operating conditions increase consumer willingness to pay for higher-capacity, inverter-driven units.
The estimated +1.4% incremental contribution to the 6.5% baseline CAGR reflects stronger seasonal sell-through, greater dealer inventory turns, and a larger installed base for replacement, maintenance, and warranty revenue. Sellers who position reliability and performance credentials ahead of price will capture disproportionate share during peak-demand buying windows.
| Driver | (~) % Impact on CAGR Forecast | Geographic Relevance | Impact Timeline |
|---|---|---|---|
| Extreme-heat replacement demand | +1.4% | Global, highest in South Asia, Southeast Asia, Middle East, Africa and Southern Europe | Short term (≤ 2 years) |
| Urban household formation | +1.1% | India, ASEAN, China, Middle East, Africa and Latin America | Medium term (2–4 years) |
| Commercial retrofit demand | +0.8% | North America, Europe, Gulf Cooperation Council and advanced Asian markets | Short term (≤ 2 years) |
| Inverter efficiency adoption | +0.7% | Asia-Pacific, Europe, North America and urban Latin America | Medium term (2–4 years) |
| Data-centre thermal loads | +0.5% | North America, India, China, Europe, Singapore and Middle East | Medium term (2–4 years) |
| Hospitality capacity expansion | +0.3% | Middle East, India, Southeast Asia, Mediterranean Europe and North America | Medium term (2–4 years) |
Market Restraints and Grid Challenges
While structural demand indicators point to a robust market expansion, the global air conditioning industry faces critical macroeconomic bottlenecks, regulatory friction, and infrastructure limitations that threaten to cap long-term capacity delivery.
Electrical Grid Overload and Macro Stability Risks
- The Infrastructure Choke Point: Peak cooling demands are fundamentally outpacing baseline utility modernization. In highly populated developing economies across South Asia and Southeast Asia, localized distribution networks face chronic structural instability due to massive peak-load spikes.
- The Blackout Threat: The International Energy Agency’s recorded trajectory of a 50% increase in space cooling electricity consumption since 2015 directly exposes municipal grids to rolling blackouts during extreme heat waves. This vulnerability forces regulatory bodies to mandate aggressive consumer curtailment policies, directly capping market velocity.
Elevated Upfront Costs and Affordability Horizons
- The Premium Tech Penalty: The legislative and market shift toward high-efficiency variable speed technology increases production costs. Inverter architecture demands premium components like advanced power electronics and variable-frequency drives, creating a price floor that limits rapid adoption in emerging retail segments.
- The Installation Pricing Barrier: Complex mechanical configurations, specific regulatory installation criteria, and certified technician requirements push total initial cash outlays up significantly. In low-to-middle income regions, the initial setup cost can account for up to 47% of lifetime equipment ownership expenses, stalling the conversion of latent regional demand into completed transactions.
Supply Chain Friction and Compliance Disruption
- The F-Gas Transition Tax: Strict regulatory timelines, led by the European Union’s January 2025 single-split system F-gas placement bans, create immediate friction across production floors. Manufacturers are forced to execute rapid, capital-intensive assembly line overhauls to safely process low-GWP, often mildly flammable refrigerants (such as R-32 or R-290 propane alternatives).
- Retooling Constraints: Component sourcing pipelines remain fragile as global production bases adjust to strict material mandates. Small-to-mid-sized HVAC suppliers are facing a margin squeeze or elimination risks as they lack the scale needed to quickly absorb these regulatory technology compliance shifts.
Challenges
The refrigerant transition is a persistent engineering and service-network challenge, not an immediate market-wide freeze. Manufacturers must redesign platforms, qualify compressors and heat exchangers, update charging procedures, certify safety controls, and retrain technicians while maintaining installed-base support. The European Union prohibited single-split systems containing less than 3 kg of F-gases with global-warming potential of at least 750 from January 2025, with stricter thresholds continuing through the late 2020s.
This transition creates an estimated -1.0% friction drag on maximum market growth through duplicate tooling, certification cycles, constrained component availability, and technician-training expense. Manufacturers that move early on low-GWP platform qualification protect margin and distribution relationships, while those that delay face inventory write-downs and installer pushback as legacy refrigerant supply tightens.
| Challenge | (~) % CAGR Friction Drag | Geographic Relevance | Mitigation Horizon |
|---|---|---|---|
| Low-GWP refrigerant transition | -1.0% | Europe, Japan, North America, China, India and global export supply chains | Medium term (2–4 years) |
| Installer skills shortages | -0.8% | Global, particularly emerging urban markets | Medium term (2–4 years) |
| Compressor supply concentration | -0.6% | Global manufacturing hubs and import-dependent markets | Medium term (2–4 years) |
| Copper price volatility | -0.5% | Global | Short term (≤ 2 years) |
| Connected-device cybersecurity | -0.4% | North America, Europe, China, Japan, South Korea and Gulf states | Long term (≥ 4 years) |
| Climate design uncertainty | -0.3% | Global, especially heat-stressed urban regions | Long term (≥ 4 years) |
Opportunities
Cooling-as-a-service remains largely untapped because most room and light-commercial air-conditioning transactions still depend on an upfront equipment sale, leaving customers to absorb installation cost, maintenance risk, and volatile peak-power bills. A provider that retains asset ownership can bundle equipment, preventive maintenance, remote monitoring, and performance commitments into a recurring contract, lowering initial customer cash outlay by roughly 60 to 80%.
If deployed selectively in creditworthy commercial, multifamily, and small-business segments, this model could add approximately +1.2% above the 6.5% baseline CAGR. Lifetime gross-margin potential can improve by roughly 5 to 10 percentage points through service attachment, replacement planning, and energy optimization. Early movers who establish financing infrastructure and asset-recovery processes will build durable competitive positions before the model scales broadly.
| Opportunity | (~) % Potential CAGR Upside | Geographic Relevance | Execution Window |
|---|---|---|---|
| Cooling-as-a-service platforms | +1.2% | India, Southeast Asia, Middle East, Africa, Latin America and commercial global markets | Medium term (2–4 years) |
| Building energy-management integration | +1.0% | North America, Europe, China, Japan, South Korea and Gulf states | Medium term (2–4 years) |
| District cooling conversion | +0.8% | Gulf Cooperation Council, India, Southeast Asia and dense urban China | Long term (≥ 4 years) |
| Certified refurbishment networks | +0.7% | Europe, North America, India, Latin America and Africa | Medium term (2–4 years) |
| Precision cooling verticals | +0.6% | North America, India, China, Europe, Singapore and Middle East | Medium term (2–4 years) |
| Integrated solar-cooling bundles | +0.5% | India, Middle East, Africa, Australia, Southeast Asia and Latin America | Long term (≥ 4 years) |
Air Conditioning Market Company Insights
Daikin Industries holds a structural advantage as the global market leader through its breadth across residential, commercial, and applied cooling segments. Daikin’s Air-Conditioning and Refrigeration Equipment segment recorded ¥ 4,621,131 million in FY2025 sales, with operating profit of ¥ 376,991 million. Daikin committed USD 28.6 million for a new Australian factory, reinforcing its strategy of local manufacturing to reduce logistics exposure and serve regional markets with faster lead times.
Midea Group leverages high-volume manufacturing scale and an aggressive international expansion posture to challenge established players across price tiers. Midea reported RMB 128.4 billion in Q1 2025 revenue with net profit attributable to shareholders of RMB 12.4 billion, up 38.0% year over year. This profitability growth at scale reflects effective cost management and a product mix shift toward higher-margin inverter and smart systems that reduces Midea’s exposure to commoditized fixed-speed volume.
The International Energy Agency projects space-cooling energy demand to rise by nearly 4% annually to 2035 under current policy settings. This trajectory means every player in the market faces sustained volume tailwinds, but margin outcomes will separate those with efficient manufacturing and service infrastructure from those competing solely on unit price.
The World Bank estimates India’s sustainable-cooling opportunity could total USD 1.6 trillion by 2040, and cooling demand there could reach 8 times current levels by 2037. Trane Technologies invested more than USD 50 million during 2024 to 2025 in its Advanced Technology and Training Center and engineering R&D laboratory, while its 12-month HVAC electrification retrofit at 55 Water Street in New York enabled approximately USD 14.5 million in incentives, demonstrating that integrated service delivery generates measurable financial returns beyond equipment sales.
Panasonic agreed to invest € 30 million in tado°, supporting home-energy-management and air-conditioning controls integration. Haier Air-Conditioner agreed to acquire specified assets for RMB 267.24 million excluding tax, extending its manufacturing and product scope. Voltas’ consolidated total income reached INR 15,737 crore in FY2025, a 24% increase, confirming that India-focused players are growing revenues at rates well above the global market average.
Key Players
- Daikin Industries, Ltd.
- Midea Group Co., Ltd.
- Gree Electric Appliances, Inc.
- Carrier Global Corporation
- LG Electronics Inc.
- Mitsubishi Electric Corporation
- Haier Smart Home Co., Ltd.
- Trane Technologies plc
- Panasonic Holdings Corporation
- Samsung Electronics Co., Ltd.
- Johnson Controls-Hitachi Air Conditioning
- Lennox International Inc.
- Fujitsu General Ltd.
- Voltas Limited (Tata)
- Bosch Thermotechnology
Recent Developments
- December 2025 – Daikin Applied announced a USD 163 million investment in an advanced R&D test lab for data-centre and HVAC innovation.
- May 2025 – Carrier announced an additional USD 1 billion investment over 5 years in US manufacturing, R&D, and workforce expansion, expected to create 4,000 skilled jobs.
- June 2026 – Trane Technologies invested USD 348 million in R&D during 2025 and introduced 110 new products and services.
- September 2025 – Midea’s Thailand air-conditioner plant, backed by approximately USD 168 million of investment, covers 208,000 square metres and is projected to achieve 6 million units of annual output by 2026.
- May 2025 – LG began construction of a Sri City manufacturing facility on 247 acres with planned investment of approximately USD 600 million (INR 5,001 crore) over 4 years to manufacture AC compressors and air conditioners.
- June 2025 – Panasonic committed approximately ¥ 20 billion (€ 145 million) to its Czech facility through FY ending March 2026 to increase air-to-water heat-pump production.
- September 2025 – Haier committed more than INR 1,000 crore for Greater Noida AC and injection-moulding facilities during 2024 to 2028, targeting AC capacity growth from 1.5 million to 4.0 million units annually.
- January 2025 – Voltas reported spending roughly INR 400 crore on its Chennai AC plant and earmarked roughly INR 400 to 450 crore more to scale production from 1 million units toward 2 million units.
- February 2026 – Panasonic India launched 57 new smart and energy-efficient air-conditioner models for its 2026 portfolio and stated an aim to reach approximately 2 million AC units by FY2028.
Report Scope
| Report Features | Description |
|---|---|
| Market Value (2025) | USD 165.7 Billion |
| Forecast Revenue (2035) | USD 311.4 Billion |
| CAGR (2026-2035) | 6.5% |
| Base Year for Estimation | 2025 |
| Historic Period | 2020-2024 |
| Forecast Period | 2026-2035 |
| Report Coverage | Revenue Forecast, Market Dynamics, Market Opportunity Analysis, Technology and Innovation Landscape, Competitive Landscape, Recent Developments |
| Segments Covered | By Product Type (Split Systems, Window AC, Central & Ducted Systems, Portable Units, VRF Systems & Chillers), By Technology (Inverter (Variable Speed), Non-Inverter (Fixed Speed), Smart / IoT-Enabled), By Application (Residential, Commercial, Industrial), By Distribution Channel (Offline (Showrooms, Wholesale), Online (E-commerce)) |
| Regional Analysis | North America (US and Canada), Europe (Germany, France, The UK, Spain, Italy, and Rest of Europe), Asia Pacific (China, Japan, South Korea, India, Australia, and Rest of APAC), Latin America (Brazil, Mexico, and Rest of Latin America), Middle East and Africa (GCC, South Africa, and Rest of MEA) |
| Competitive Landscape | Daikin Industries, Ltd., Midea Group Co., Ltd., Gree Electric Appliances, Inc., Carrier Global Corporation, LG Electronics Inc., Mitsubishi Electric Corporation, Haier Smart Home Co., Ltd., Trane Technologies plc, Panasonic Holdings Corporation, Samsung Electronics Co., Ltd., Johnson Controls-Hitachi Air Conditioning, Lennox International Inc., Fujitsu General Ltd., Voltas Limited (Tata), Bosch Thermotechnology |
| Customization Scope | Customization for segments, region/country-level will be provided. Additional customization can be done based on requirements. |
| Purchase Options | We have three licenses to opt for: Single User License, Multi-User License (Up to 5 Users), Corporate Use License (Unlimited User and Printable PDF) |





































