
Quick Navigation
- Report Overview
- Key Takeaway
- Efficiency and Operational Statistics
- Drivers Impact Analysis
- Risk Impact Analysis
- Restraint Impact Analysis
- Component Analysis
- Deployment Analysis
- Application Analysis
- Sports Type Analysis
- Organization Size Analysis
- End-User Analysis
- Regional Analysis
- Investor Type Impact Matrix
- Technology Enablement Analysis
- Driver Analysis
- Restraint Analysis
- Opportunity Analysis
- Challenge Analysis
- Emerging Trends
- Growth Factors
- Key Market Segments
- Key Players Analysis
- Top 5 Companies
- Recent Developments
- Report Scope
Report Overview
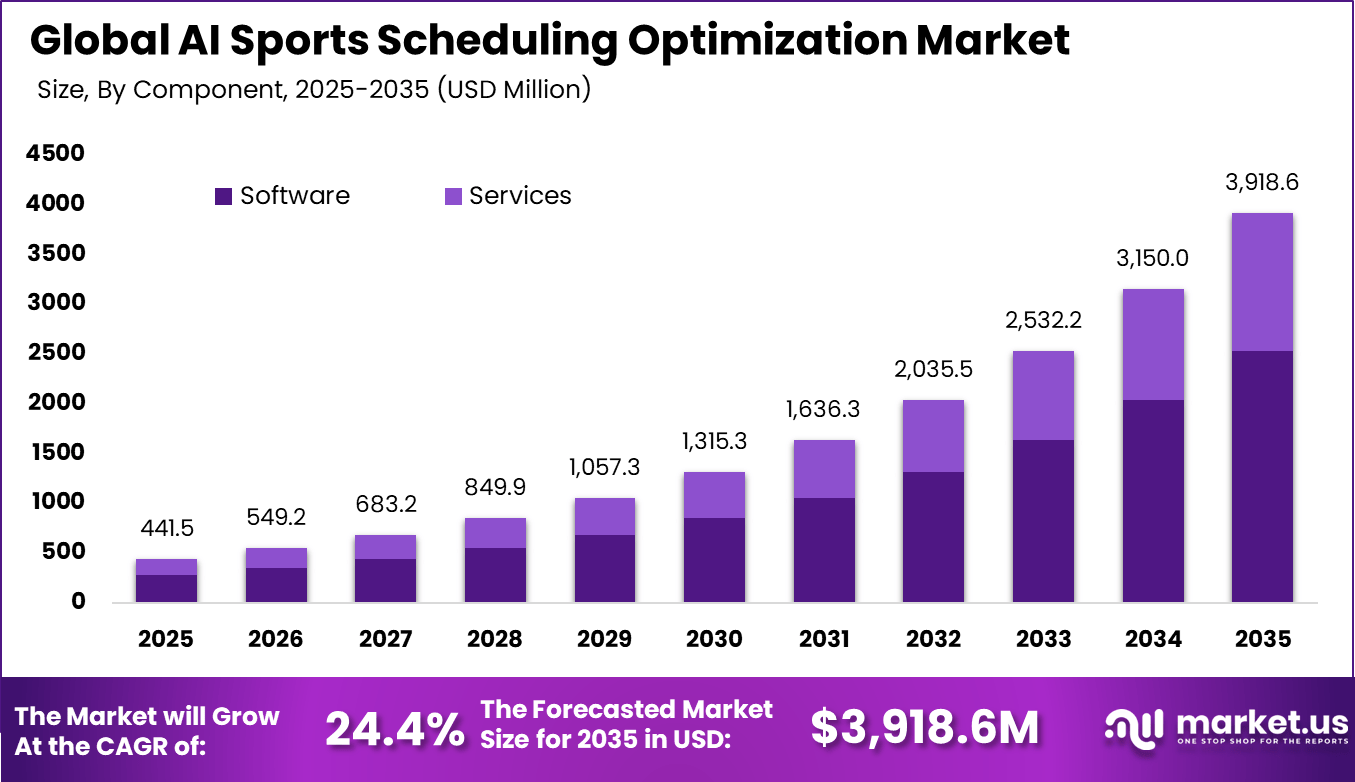
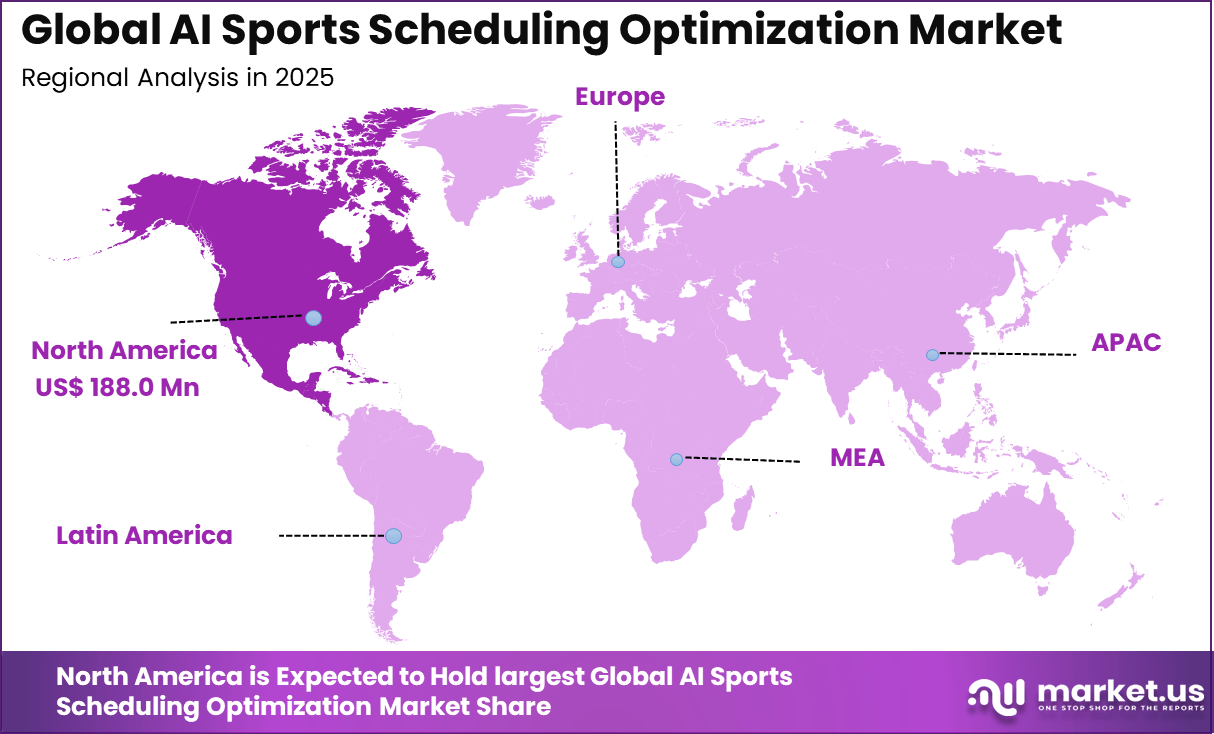
The Global AI Sports Scheduling Optimization Market size is expected to be worth around USD 3,918.6 million by 2035, from USD 441.5 million in 2025, growing at a CAGR of 24.4% during the forecast period from 2025 to 2035. North America held a dominant market position, capturing more than a 42.6% share, holding USD 188.0 million in revenue.
The AI sports scheduling optimization market refers to software solutions that use artificial intelligence to design, adjust, and manage sports schedules efficiently. These platforms consider multiple factors such as team availability, venue capacity, travel distance, rest periods, and broadcast requirements. AI-based scheduling tools are used by sports leagues, federations, tournament organizers, and broadcasters. They help reduce conflicts and improve schedule fairness. Adoption supports smoother competition planning and execution.
One major driving factor of the AI sports scheduling optimization market is the need to reduce scheduling conflicts and inefficiencies. Overlapping matches and venue clashes disrupt operations and fan experience. AI systems evaluate constraints and generate optimized schedules. Reduced conflicts improve operational stability. Complexity management drives adoption.
For instance, in August 2024, Stats Perform unveiled OptaAI Studio, an AI platform with Opta Search, Live, and Graphics tools for broadcasters and teams to analyze data trends and create schedules. It streamlines fixture planning, saves hours in preparation, and boosts data-driven storytelling across sports.
Demand for AI sports scheduling optimization solutions is influenced by expansion of professional leagues and tournaments. More teams and matches increase scheduling complexity. Organizers require scalable tools to manage this growth. AI systems handle large datasets efficiently. Expansion drives demand.
Key Takeaway
- Software led the market in 2025 with a 64.7% share, driven by advanced AI scheduling, simulation, and optimization platforms.
- Cloud-based deployment dominated with a 70.3% share, supported by scalability, real-time updates, and centralized schedule management.
- Professional sports leagues accounted for 53.8%, reflecting large-scale league operations and complex fixture requirements.
- Football (soccer) held a 41.5% share, due to dense match calendars, global tournaments, and travel-intensive leagues.
- Large enterprises captured 76.2%, supported by higher budgets and long-term investments in AI-driven scheduling systems.
- Tournament organizers and leagues represented 42.9%, highlighting demand for fair, balanced, and conflict-free event planning.
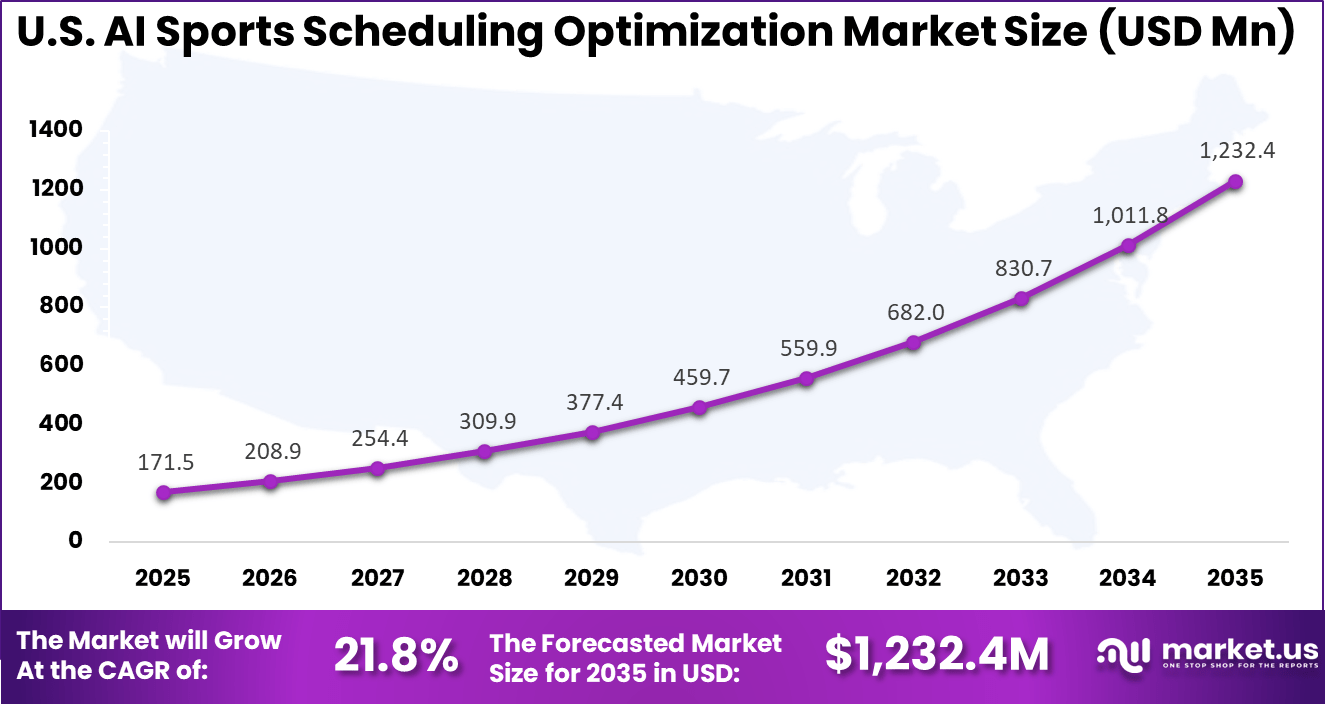
- The U.S. market reached USD 171.5 million in 2025, expanding at a strong 21.8% CAGR.
- North America led globally with more than a 42.6% share, supported by advanced sports infrastructure and early AI adoption.
Efficiency and Operational Statistics
- AI scheduling solutions reduce manual scheduling effort and rework by 30%-60%, lowering operational overhead.
- AI powered systems generate and update complex schedules up to 4.5× faster than traditional planning methods.
- Scheduling conflicts decline by an average of 85% with AI driven optimization.
- Optimized venue coordination reduces required hotel nights for teams by 15%, improving travel efficiency and cost control.
- AI scheduling models improve rest equity variance by 30%-50%, ensuring fair recovery time between games.
- Geographically optimized schedules reduce travel miles and logistics costs by 8%-15% for professional teams.
- Optimized routing lowers travel-related CO₂ emissions by 8%-15%, supporting sustainability goals.
- Teams report a 96% satisfaction rate with AI-generated schedules due to improved fairness and balance.
- AI reduces exposure to high-risk scheduling slots by 20%-40%, including weather-sensitive outdoor events.
Drivers Impact Analysis
| Driver Category | Key Driver Description | Estimated Impact on CAGR (%) | Geographic Relevance | Impact Timeline |
|---|---|---|---|---|
| Expansion of professional sports leagues | Complex multi venue scheduling needs | ~6.7% | North America, Europe | Short Term |
| Growth in broadcast and media rights | Optimized fixtures for viewership | ~5.8% | Global | Short Term |
| Adoption of AI optimization algorithms | Reduced scheduling conflicts | ~4.9% | Global | Mid Term |
| Increase in international tournaments | Cross border calendar coordination | ~4.1% | Global | Mid Term |
| Focus on cost and logistics efficiency | Travel and venue optimization | ~2.9% | Global | Long Term |
Risk Impact Analysis
| Risk Category | Risk Description | Estimated Negative Impact on CAGR (%) | Geographic Exposure | Risk Timeline |
|---|---|---|---|---|
| Data dependency | Inaccurate team or venue data | ~4.6% | Global | Short Term |
| Integration complexity | Alignment with league management systems | ~3.9% | Global | Short to Mid Term |
| Algorithm transparency concerns | Limited trust in AI decisions | ~3.2% | Global | Mid Term |
| High customization requirements | League specific rule complexity | ~2.7% | Global | Mid Term |
| Vendor concentration | Limited specialized solution providers | ~2.1% | Global | Long Term |
Restraint Impact Analysis
| Restraint Factor | Restraint Description | Impact on Market Expansion (%) | Most Affected Regions | Duration of Impact |
|---|---|---|---|---|
| High initial deployment cost | Enterprise grade optimization platforms | ~5.1% | Emerging Markets | Short to Mid Term |
| Limited SME adoption | Budget constraints for smaller leagues | ~4.2% | Global | Mid Term |
| Change management resistance | Manual scheduling preferences | ~3.5% | Global | Mid Term |
| Interoperability issues | Legacy scheduling tools | ~2.8% | Global | Long Term |
| Unclear ROI for smaller events | Lower scale benefits | ~2.2% | Global | Long Term |
Component Analysis
Software accounts for 64.7% of the AI sports scheduling optimization market, reflecting its central role in automating complex scheduling tasks. Scheduling platforms process large datasets related to teams, venues, travel, and broadcast requirements. AI-driven software helps reduce manual planning effort and scheduling conflicts.
Sports organizations rely on software solutions to simulate multiple scheduling scenarios. These systems optimize fixture allocation while considering operational constraints. The ability to adjust schedules dynamically improves planning accuracy.
As leagues expand and competition formats become more complex, demand for advanced scheduling software continues to grow. Software flexibility supports customization for different sports and formats. This sustains its leading position in the market.
Deployment Analysis
Cloud-based deployment holds a 70.3% share, driven by the need for scalability and collaboration. Cloud platforms allow multiple stakeholders to access scheduling systems in real time. This supports coordination among leagues, teams, and broadcasters. Cloud deployment enables rapid updates and centralized data management.
Scheduling changes can be implemented efficiently without system downtime. This improves responsiveness during season planning and live events. The preference for cloud-based systems is also influenced by cost efficiency. Organizations avoid heavy infrastructure investments. Cloud deployment remains the dominant model for AI scheduling solutions.
Application Analysis
Professional sports leagues account for 53.8% of application demand, making them the primary users of scheduling optimization tools. Leagues manage large numbers of teams, fixtures, and venues across long seasons. AI helps balance competitive fairness and logistical efficiency. Scheduling optimization improves travel planning and reduces player fatigue.
AI systems consider rest periods, venue availability, and broadcast requirements. This supports smoother season execution. As leagues seek operational efficiency and fan engagement, AI-based scheduling becomes essential. Professional leagues continue to invest in optimization tools. This drives sustained adoption in this segment.
Sports Type Analysis
Football represents 41.5% of market adoption by sports type. The sport’s global scale and dense competition calendars create complex scheduling challenges. AI tools help manage domestic leagues, international tournaments, and club competitions. Football scheduling requires coordination across multiple stakeholders.
AI systems optimize match timing to balance competitive integrity and commercial value. This reduces scheduling conflicts and delays. The high volume of matches supports strong demand for automation. Football organizations prioritize efficient scheduling solutions. This keeps football as a leading sport type in the market.
Organization Size Analysis
Large enterprises account for 76.2% of market demand, reflecting their capacity to adopt advanced AI solutions. Major leagues and organizations manage extensive schedules and operational complexity. AI helps them streamline planning and decision-making. Large organizations require systems that handle high data volumes and multiple constraints.
AI scheduling platforms meet these needs effectively. Integration with other sports management systems further enhances value. As competition and operational scale increase, large enterprises continue to invest in optimization technologies. Their resource availability supports early adoption. This segment remains dominant.
End-User Analysis
Tournament organizers and leagues represent 42.9% of end-user demand. These entities are responsible for event planning, match sequencing, and venue coordination. AI scheduling tools help ensure efficient tournament execution. AI systems enable organizers to adapt schedules based on unforeseen changes.
This improves event reliability and stakeholder coordination. Reduced planning time supports cost control. As tournament formats evolve, demand for intelligent scheduling increases. Organizers seek tools that improve accuracy and flexibility. This supports steady adoption in this end-user segment.
Regional Analysis
North America holds a 42.6% share of the AI sports scheduling optimization market, supported by advanced sports management practices. Professional leagues in the region adopt AI to improve operational efficiency. Digital infrastructure supports rapid technology integration.
For instance, in May 2025, AWS expanded its collaboration with the NFL, using Amazon EC2–powered algorithms and machine learning to evaluate hundreds of thousands of schedule scenarios and optimize the 2025–26 season calendar for competitiveness, travel, and broadcast priorities, reinforcing North America’s lead in AI-driven sports scheduling optimization.
| Region | Primary Growth Driver | Regional Share (%) | Regional Value (USD Mn) | Adoption Maturity |
|---|---|---|---|---|
| North America | Large scale professional leagues | 42.6% | USD 188.1 Mn | Advanced |
| Europe | Dense football league calendars | 31.8% | USD 140.4 Mn | Advanced |
| Asia Pacific | Expansion of regional sports leagues | 18.9% | USD 83.5 Mn | Developing to Advanced |
| Latin America | Growth in domestic tournaments | 4.1% | USD 18.1 Mn | Developing |
| Middle East and Africa | Early sports infrastructure digitization | 2.6% | USD 11.5 Mn | Early |
The United States contributes USD 171.5 million in market value, driven by adoption among major leagues and tournament organizers. Scheduling efficiency supports broadcasting and fan engagement goals. A CAGR of 21.8% indicates strong growth momentum across the region. Increasing complexity of sports calendars supports expansion. North America remains a key market for AI scheduling optimization.
For instance, in May 2025, Stats Perform won the 2025 “Broadcast Technology of the Year” award for its OptaAI Studio platform, which uses AI and advanced data pipelines to generate real-time insights that feed directly into broadcasters’ planning and scheduling of live sports content, strengthening U.S.-based leadership in AI-powered scheduling and programming decisions.
Investor Type Impact Matrix
| Investor Type | Adoption Level | Contribution to Market Growth (%) | Key Motivation | Investment Behavior |
|---|---|---|---|---|
| Tournament organizers and leagues | Very High | ~42.9% | Fixture efficiency and fairness | Platform wide deployment |
| Professional sports leagues | Very High | ~53.8% | Revenue and logistics optimization | Long term contracts |
| Broadcasters and media partners | Moderate | ~14% | Audience maximization | Selective integration |
| Sports federations | Moderate | ~11% | Calendar coordination | Program based adoption |
| Amateur leagues | Low | ~6% | Cost sensitive scheduling | Limited usage |
Technology Enablement Analysis
| Technology Layer | Enablement Role | Impact on Market Growth (%) | Adoption Status |
|---|---|---|---|
| Optimization algorithms | Fixture and calendar optimization | ~6.5% | Growing |
| Machine learning models | Predictive conflict resolution | ~5.7% | Growing |
| Cloud computing platforms | Scalable scheduling simulations | ~4.9% | Mature |
| Data integration engines | Venue, team, and travel data fusion | ~3.8% | Developing |
| Visualization dashboards | Scenario comparison and approvals | ~2.9% | Developing |
Driver Analysis
The AI sports scheduling optimization market is being driven by the increasing need to balance performance, logistics, and fan engagement across competitive sports calendars. Traditional manual scheduling methods often struggle to address complex constraints such as venue availability, travel distances, broadcast windows, rest periods for athletes, and stakeholder preferences.
AI-enabled scheduling solutions use machine learning and optimisation algorithms to analyse large sets of variables simultaneously and generate efficient schedules that minimise conflicts, reduce travel fatigue, and maximise revenue potential. These capabilities are particularly valuable for leagues, tournaments, and multi-sport events that require precise coordination among teams, venues, and commercial partners.
Restraint Analysis
A significant restraint in the AI sports scheduling optimization market relates to the complexity of integrating diverse operational data and stakeholder requirements into automated models. Scheduling involves many interdependent factors, including competitive fairness, regulatory compliance, travel logistics, broadcast commitments, and venue constraints.
Capturing these factors accurately in data structures and optimisation frameworks requires detailed information and substantial domain expertise. Organisations with fragmented data, inconsistent formats, or limited digitisation may find it challenging to deploy sophisticated AI solutions effectively, which can delay adoption.
Opportunity Analysis
Emerging opportunities in the AI sports scheduling optimization market are linked to expanding use cases that extend beyond basic fixture generation to dynamic adjustment, real-time conflict resolution, and scenario modelling. AI platforms that incorporate predictive analytics can anticipate potential disruptions, such as weather impacts or venue changes, and suggest alternative plans that minimise disruption and cost.
There is also opportunity in tailoring scheduling tools to specific league formats, youth and amateur competitions, and international tournaments where bespoke constraints vary widely. Enhanced visualisation and collaboration capabilities further support stakeholders in understanding implications of schedule choices before finalisation.
Challenge Analysis
A central challenge confronting this market involves balancing algorithmic efficiency with human oversight and strategic judgment. While AI systems can generate technically optimal schedules based on quantitative data, sports organisations often need flexibility to account for qualitative considerations such as rivalries, traditional matchups, fan travel patterns, and commercial sensitivities.
Ensuring that automated recommendations are interpretable and adjustable by scheduling committees is essential to build trust and practical usability. Providing clear reasoning for AI-derived schedules and enabling human-guided refinements remains a nuanced implementation requirement.
Emerging Trends
Emerging trends within the AI sports scheduling optimization landscape include the integration of machine learning with simulation models that test multiple what-if scenarios before final schedule approval. These systems can evaluate the impact of different constraints and priorities on outcomes such as rest periods, travel costs, and audience reach.
Another trend is the use of real-time optimisation that adapts schedules in response to live inputs, such as changes in weather forecasts, operational delays, or updated broadcast requirements. Visual analytics dashboards and interactive planning interfaces are also becoming more common to support stakeholder engagement and decision transparency.
Growth Factors
Growth in the AI sports scheduling optimization market is supported by the increasing complexity of modern sports calendars, heightened expectations for fairness and athlete welfare, and the commercial imperatives of broadcast partnerships and fan engagement metrics.
The proliferation of data sources, including travel analytics, venue utilisation logs, and historical scheduling performance, enhances the inputs available for optimisation models. Advances in artificial intelligence, computational efficiency, and cloud-based deployment make sophisticated scheduling tools more accessible to organisations of varied sizes.
As sports leagues and event organisers prioritise operational efficiency and strategic flexibility, AI-enabled scheduling remains a valuable tool for optimising competitive and commercial outcomes across seasons and competitions.
Key Market Segments
By Component
- Software
- Services
By Deployment
- Cloud-based
- On-premise
By Application
- Professional Sports Leagues
- Amateur Sports Leagues
- Educational Institutions
- Sports Clubs & Academies
By Sport Type
- Football (Soccer)
- Basketball
- Tennis
- Cricket
- Others (Hockey, Volleyball, etc.)
By Organization Size
- Small & Medium Enterprises (SMEs)
- Large Enterprises
By End User
- Tournament Organizers & Leagues
- Sports Teams & Coaches
- Sports Federations & Associations
Key Players Analysis
Technology leaders such as Amazon Web Services, Inc., IBM Corporation, and SAP SE provide AI and cloud platforms for large scale sports scheduling. Their solutions process complex constraints such as venue availability, travel logistics, and broadcast requirements. AI models help optimize fixture planning and reduce operational conflicts. These providers are preferred by large leagues due to scalability, security, and integration capabilities.
Sports data and performance specialists such as Stats Perform, Catapult Sports, and Hawk-Eye Innovations apply AI to scheduling linked with performance and workload data. Opta, Second Spectrum, and Sportradar AG strengthen predictive scheduling accuracy. Their insights help leagues balance player health, competitive fairness, and fan engagement. Adoption is strong among professional leagues and federations.
Consulting and analytics firms such as Accenture, Deloitte, and PwC support strategy and implementation. NTT DATA adds system integration expertise. Visualization platforms from QlikTech International AB and Tableau Software improve decision making. Other vendors expand regional reach. This ecosystem supports efficient and data-driven sports scheduling operations.
Top 5 Companies
| Company | Core Solution Focus | AI & Analytics Strength | Primary Customer Base | Role in Fraud Detection | Competitive Positioning |
|---|---|---|---|---|---|
| Sportradar AG | Sports integrity and betting monitoring | Advanced AI pattern recognition, real time anomaly detection | Sportsbooks, leagues, regulators | Detects match manipulation and suspicious betting patterns | Market leader with deep league partnerships |
| Genius Sports | Betting data and integrity services | Machine learning for odds movement and fraud signals | Betting operators, sports leagues | Monitors abnormal wagering behavior | Strong global sportsbook integration |
| Stats Perform | Sports data intelligence and analytics | AI driven statistical modeling and risk analysis | Sportsbooks, federations, media | Identifies data anomalies and betting risks | Trusted analytics provider with Opta data |
| Amazon Web Services, Inc. | Cloud infrastructure and AI services | Scalable AI, real time data processing | Betting platforms, analytics vendors | Enables large scale fraud detection systems | Dominant cloud backbone for AI deployment |
| IBM Corporation | Enterprise AI and governance solutions | Explainable AI, predictive risk analytics | Regulators, large betting operators | Supports compliance and fraud investigation | Strong enterprise and regulatory credibility |
Top Key Players in the Market
- Amazon Web Services, Inc.
- IBM Corporation
- SAP SE
- Kinexon
- Stats Perform
- Catapult Sports
- Hawk-Eye Innovations
- Opta (Stats Perform)
- TruMedia Networks
- Synergy Sports
- Second Spectrum
- Sportradar AG
- Genius Sports
- NTT DATA
- Deloitte
- Ernst & Young
- PwC
- Accenture
- QlikTech International AB
- Tableau Software (Salesforce)
- Others
Recent Developments
- In January 2025, Catapult partnered with ANSRS to deliver the first fully integrated film and data solution for NFL and NCAA football, enabling real-time video-data access for game planning and schedule optimization. Coaches save hours on reports, focusing on strategic scheduling around player workloads.
- In August 2024, Stats Perform unveiled OptaAI Studio, an AI platform with Opta Search, Live, and Graphics tools for broadcasters and teams to analyze data trends and create schedules. It streamlines fixture planning, saves hours in preparation, and boosts data-driven storytelling across sports.
Report Scope
| Report Features | Description |
|---|---|
| Market Value (2025) | USD 441.5 Mn |
| Forecast Revenue (2035) | USD 3,918.6 Mn |
| CAGR(2026-2035) | 24.4% |
| Base Year for Estimation | 2025 |
| Historic Period | 2020-2024 |
| Forecast Period | 2026-2035 |
| Report Coverage | Revenue forecast, AI impact on Market trends, Share Insights, Company ranking, competitive landscape, Recent Developments, Market Dynamics and Emerging Trends |
| Segments Covered | By Component (Software, Services), By Deployment (Cloud-based, On-premise), By Application (Professional Sports Leagues, Amateur Sports Leagues, Educational Institutions, Sports Clubs & Academies), By Sport Type (Football (Soccer), Basketball, Tennis, Cricket, Others (Hockey, Volleyball, etc.), By Organization Size (Small & Medium Enterprises (SMEs), Large Enterprises), By End User (Sports Teams & Coaches, Tournament Organizers, Sports Federations & Associations) |
| Regional Analysis | North America – US, Canada; Europe – Germany, France, The UK, Spain, Italy, Russia, Netherlands, Rest of Europe; Asia Pacific – China, Japan, South Korea, India, New Zealand, Singapore, Thailand, Vietnam, Rest of Latin America; Latin America – Brazil, Mexico, Rest of Latin America; Middle East & Africa – South Africa, Saudi Arabia, UAE, Rest of MEA |
| Competitive Landscape | Amazon Web Services, Inc., IBM Corporation, SAP SE, Kinexon, Stats Perform, Catapult Sports, Hawk-Eye Innovations, Opta (Stats Perform), TruMedia Networks, Synergy Sports, Second Spectrum, Sportradar AG, Genius Sports, NTT DATA, Deloitte, Ernst & Young, PwC, Accenture, QlikTech International AB, Tableau Software (Salesforce), Others |
| Customization Scope | Customization for segments, region/country-level will be provided. Moreover, additional customization can be done based on the requirements. |
| Purchase Options | We have three license to opt for: Single User License, Multi-User License (Up to 5 Users), Corporate Use License (Unlimited User and Printable PDF) |


