
Quick Navigation
Company Overview
Stryker Statistics: Stryker Corporation is a leading global medical technology company dedicated to enhancing patient care and transforming healthcare delivery worldwide. The company operates under 2 primary business segments: MedSurg, Neurotechnology, and Orthopaedics. Its extensive product portfolio includes navigation systems and surgical equipment, intensive care disposables, endoscopic and communication technologies, patient handling and emergency medical devices, and artificial intelligence-assisted clinical communication platforms.
Additionally, Stryker provides neurovascular and neurosurgical instruments, spinal devices, joint replacement and trauma implants, and its innovative Mako Robotic-Arm Assisted Surgery system, catering to a wide range of medical specialties. Most of the company’s products are marketed directly to hospitals, healthcare professionals, and medical institutions through a combination of branches, subsidiaries, and authorized distributors.
Stryker maintains a robust global footprint, with operations spanning approximately 75 countries across North America, Latin America, Europe, and the Asia Pacific. Its presence includes offices and manufacturing facilities in regions such as the United States, Canada, Brazil, Mexico, Argentina, France, Germany, the United Kingdom, India, China, Japan, Australia, and Singapore, among others. This widespread network enables Stryker to efficiently serve diverse markets while maintaining close collaboration with healthcare providers globally.
As of December 31, 2024, Stryker employed roughly 53,000 people worldwide, with about 27,000 based in the United States. The company’s skilled workforce underpins its commitment to innovation, operational excellence, and the ongoing mission to make healthcare better through advanced technology, quality products, and global accessibility.
History of Stryker
1900’s
- 1936–1939: Dr Homer Stryker, while studying orthopedic surgery at the University of Michigan, invented the turning frame and walking heel, pioneering early advancements in patient mobility and care.
- 1940: Dr Stryker began practicing medicine in Kalamazoo, Michigan, using the basement of Borgess Hospital as a research and development workshop.
- 1941: He founded The Orthopedic Frame Company, marking the start of Stryker’s corporate journey.
- 1942: Manufacturing of the Wedge Turning Frame began, enabling safe repositioning of patients with spinal injuries while maintaining immobilization.
- 1946: The Orthopedic Frame Company was formally incorporated under Dr Stryker’s leadership.
- 1947: Stryker patented the oscillating saw, a revolutionary device that could cut through casts without harming tissue — the foundation of its future surgical instrument business.
Later 1950’s
- 1955: Leadership transitioned to Lee Stryker, Dr Stryker’s son, who became General Manager and expanded company operations.
- 1958: The Circ-O-Lectric Bed, an evolution of the turning frame, was introduced, and annual sales surpassed $1 million.
- 1964: Dr Stryker retired from medical practice, and the company officially became Stryker Corporation.
- 1968–1969: The company launched the micro reciprocating saw and appointed Lee Stryker as President, marking a decade of innovation in surgical tools.
- 1976: Annual sales reached $17.3 million before the tragic death of Lee Stryker in a plane crash.
- 1977: John Brown was named President and CEO, initiating a new phase of professional management.
- 1979: Stryker went public through its initial public offering (IPO) and acquired Osteonics Corp, entering the orthopedic implant market.
- 1980: Dr Stryker passed away at age 85. Under John Brown’s leadership, divisionalization was introduced to enhance product focus.
- 1981: Acquisition of SynOptics expanded Stryker into the endoscopy segment.
- 1985: Annual revenue reached $100 million, demonstrating consistent growth.
- 1992–1996: Stryker expanded into spinal fixation (via Dimso SA) and orthopedic trauma (Osteo SA) markets, while launching RUGGED ambulance cots to serve emergency care.
- 1997: The company was listed on the New York Stock Exchange, marking a new phase of investor visibility.
- 1998: Acquisition of Howmedica doubled company size, solidifying Stryker’s leadership in orthopedics.
2000’s
- 2000: Stryker entered the surgical navigation market, revolutionizing precision surgery.
- 2003: The Dekompressor and PCD System expanded its reach into interventional spine care, and Stryker debuted on the Fortune 500
- 2005: Stephen MacMillan became CEO, while John Brown transitioned to Chairman.
- 2010: Stryker’s annual revenue grew to $7.3 billion, and MacMillan became Chairman following Brown’s retirement.
- 2011: The company made the Fortune 100 Best Companies to Work For list and acquired Boston Scientific’s Neurovascular division, strengthening its neurotechnology business.
- 2012: Kevin Lobo became President and CEO, leading the next growth phase.
- 2013: Stryker acquired Trauson Holdings to strengthen its presence in emerging markets and MAKO Surgical Corp to expand robotic-assisted surgery capabilities.
- 2014: Kevin Lobo became Chairman, and Stryker completed five acquisitions across patient safety, orthopedics, and medical technology.
- 2016: Sales exceeded $10 billion, and the company completed eight acquisitions, including Sage Products and Physio-Control, expanding its medical solutions business.
- 2017: The company launched Mako Total Knee, integrating robotic technology into total knee replacement. It also acquired NOVADAQ, enhancing imaging technology capabilities.
- 2018: Stryker added two new board members, increasing diversity, appointed Timothy Scannell as President and COO, and acquired K2M Group Holdings, strengthening its spine business.
- 2019: Stryker celebrated 40 years as a publicly traded company, with executives ringing the New York Stock Exchange closing bell, marking a legacy of innovation, leadership, and continuous growth.
(Source: Company Website)
Financial Analysis
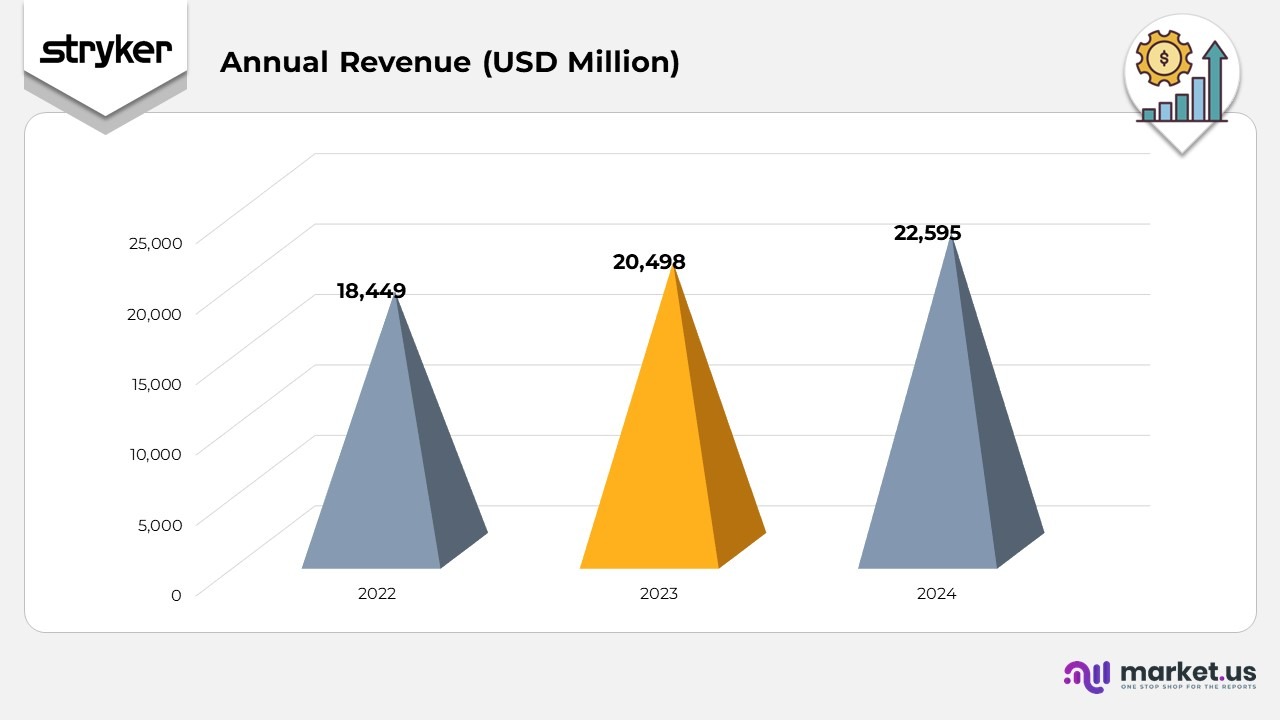
- In 2022, Stryker achieved consolidated revenue of $18,449 million, reflecting steady performance supported by sustained demand across its MedSurg, Neurotechnology and Orthopaedics The company’s strong execution during this period established a solid foundation for accelerated growth in subsequent years, driven by greater product adoption and increasing procedural volumes.
- In 2023, revenue rose to $20,498 million, an 1% year-over-year increase as reported and 11.6% in constant currency, despite a 0.5% unfavourable impact from foreign exchange rates. When excluding a 0.1% impact from acquisitions and divestitures, organic growth in constant currency was led by a 10.9% increase in unit volumes and 0.6% from price improvements. Growth momentum was fueled by higher shipment volumes across the MedSurg and Neurotechnology segments and robust performance across most Orthopaedics categories.
- In 2024, consolidated net sales advanced to $22,595 million, representing a 2% rise as reported and 10.7% in constant currency, with a 0.5% currency drag. Excluding a 0.5% acquisition and divestiture effect, organic growth in constant currency reflected a 9.1% increase in volume and 1.1% uplift from pricing. The performance was underpinned by broad-based growth across all business units, increased shipment activity, and sustained innovation, reinforcing Stryker’s global leadership and operational strength.
Geographical Revenue
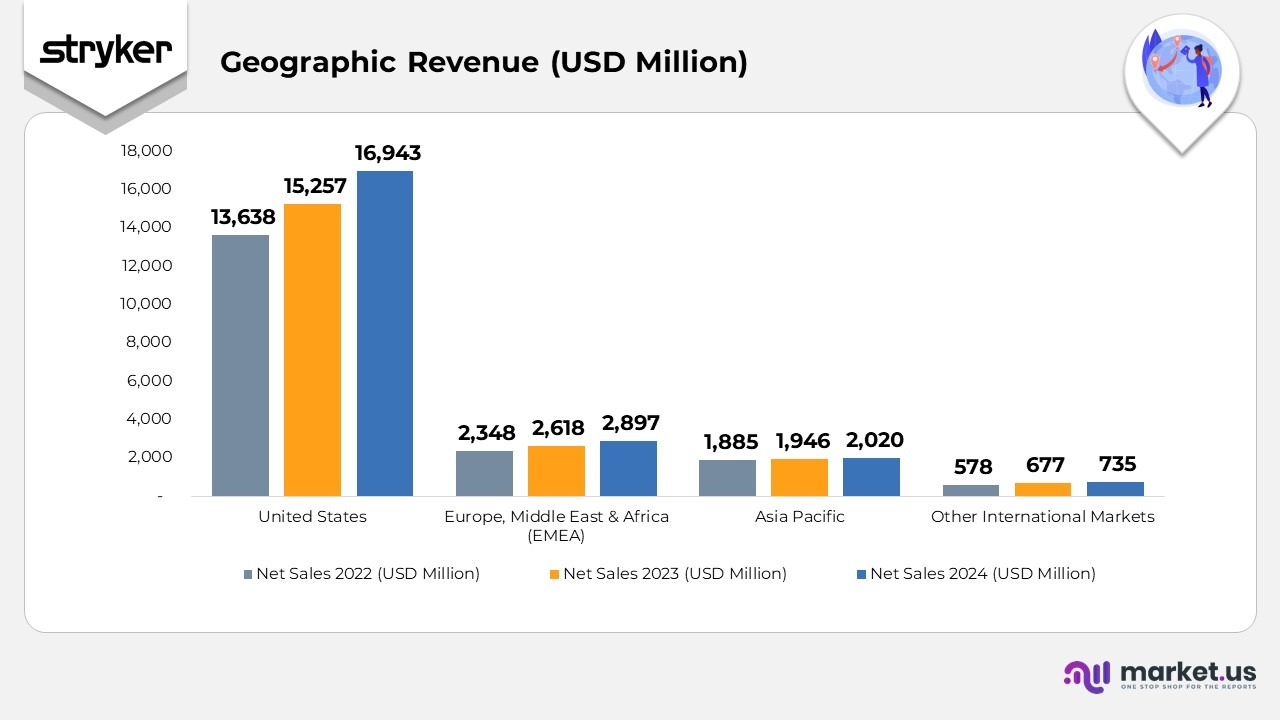
- In 2024, Stryker’s U.S. operations achieved net sales of $16,943 million, an increase from $15,257 million in 2023 and $13,638 million in 2022. This consistent growth reflects expanding domestic demand for medical devices and strong hospital procurement trends. The company’s net property, plant, and equipment in the U.S. rose to $1,997 million, compared to $1,874 million in 2023, underscoring ongoing investments in advanced manufacturing, automation, and facility modernization.
- The Europe, Middle East, and Africa (EMEA) region contributed $2,897 million in net sales for 2024, up from $2,618 million in 2023 and $2,348 million in 2022, driven by robust adoption of orthopedic and neurotechnology products. The region’s net property, plant, and equipment value climbed to $1,260 million from $1,151 million a year earlier, reflecting capacity expansion and increased localization of production in key European hubs.
- In the Asia Pacific region, Stryker posted $2,020 million in net sales in 2024, up from $1,946 million in 2023 and $1,885 million in 2022. Growth was supported by heightened demand across China, India, and Japan, along with the scaling of robotic-assisted surgery platforms. The company’s net property, plant, and equipment remained steady at $75 million in 2024 versus $77 million in 2023, reflecting stable utilization and efficiency gains within existing facilities.
- Across other international markets, net sales reached $735 million in 2024, up from $677 million in 2023 and $578 million in 2022, indicating steady expansion in developing economies. Correspondingly, net property, plant, and equipment rose slightly to $116 million in 2024 from $113 million in 2023, signifying gradual infrastructure enhancement to support continued global market penetration.
(Source: Stryker Corporation SEC Filings)
Research and Development Expenditure
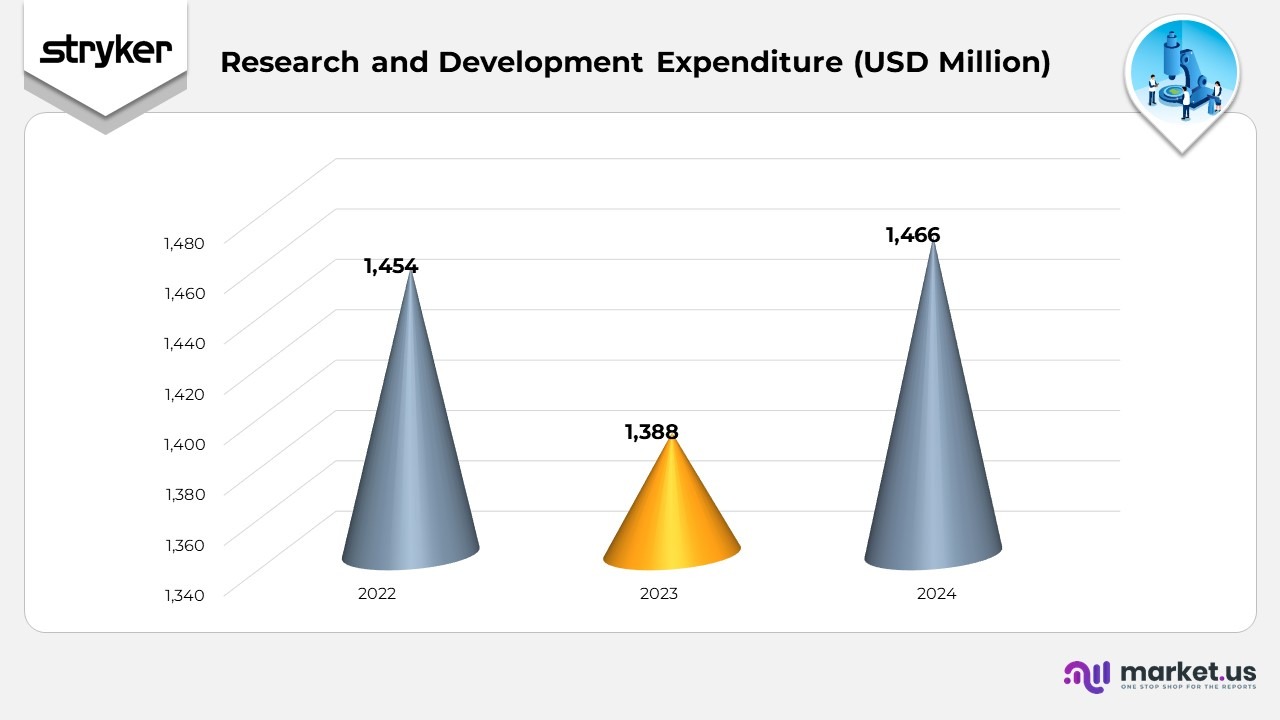
- In 2022, Stryker reported a value of $1,454 million, reflecting a strong operational base driven by solid demand and effective cost management across its business segments.
- In 2023, the figure slightly declined to $1,388 million, representing a year-over-year decrease of approximately 4.5%. The reduction was influenced by inflationary pressures and transitional expenses related to business optimization initiatives.
- In 2024, the company recorded a rebound to $1,466 million, indicating a year-over-year growth of around 5.6% compared to 2023. The increase reflects improved operational efficiency, higher sales volumes, and favorable pricing dynamics, demonstrating Stryker’s strong recovery momentum and continued financial resilience.
(Source: Stryker Corporation SEC Filings)
Segmental Analysis
MedSurg and Neurotechnology
- In 2024, the MedSurg and Neurotechnology segment recorded a net sales increase of 11.1% as reported and 6% in constant currency, despite a 0.5% negative impact from foreign exchange fluctuations.
- When excluding a 4% effect from acquisitions and divestitures, growth in constant currency reflected a 9.5% rise in unit volumes and 1.7% from price adjustments. The strong volume growth was primarily driven by higher product shipments across all MedSurg and Neurotechnology categories, supported by expanding global demand and innovation in surgical technologies.
- In 2023, segment net sales rose by 7% as reported and 12.2% in constant currency, also impacted by a 0.5% unfavorable currency effect. Excluding a 0.3% contribution from acquisitions and divestitures, net sales in constant currency grew by 10.2% through higher volumes and 1.7% from pricing improvements. The increase was fueled by broad-based shipment growth across all MedSurg and Neurotechnology lines, particularly in surgical equipment, endoscopy, and neuro devices, reflecting consistent execution and rising hospital procedure rates worldwide.
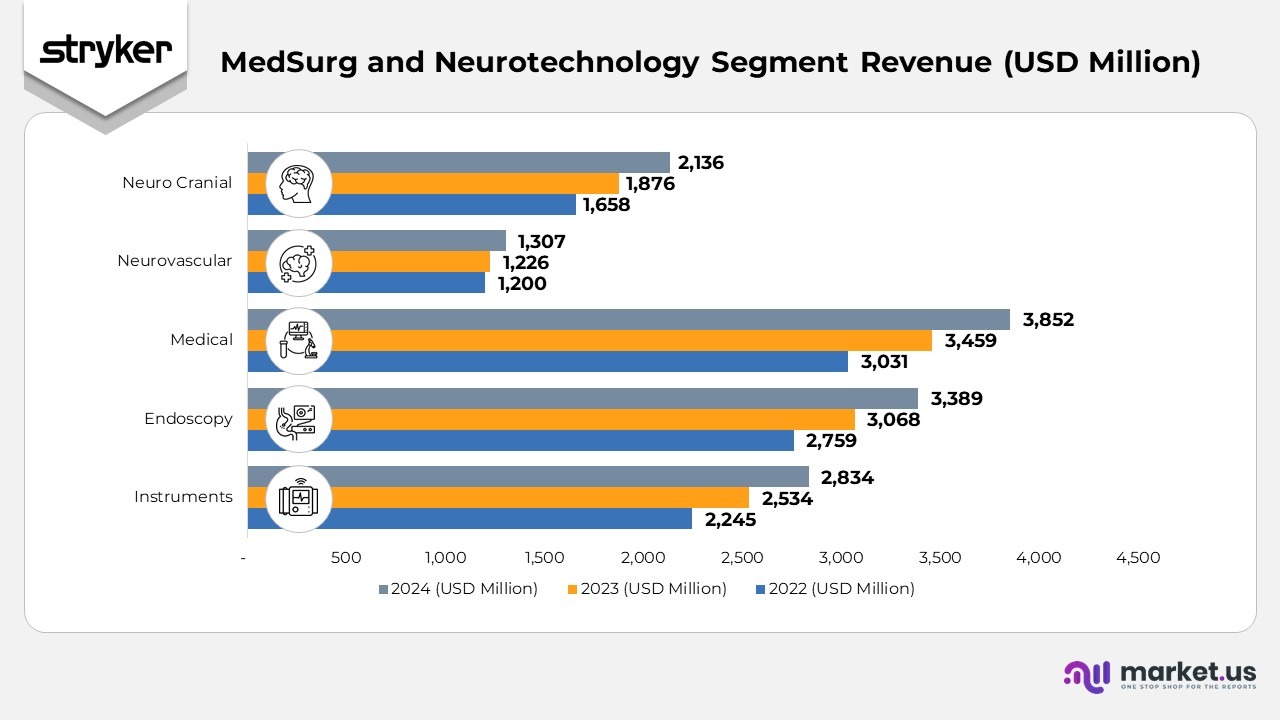
- The Instruments division reported revenue of $2,834 million in 2024, up from $2,534 million in 2023 and $2,245 million in 2022, driven by consistent growth in surgical tools and equipment demand across hospitals and surgical centers.
Further,
- The Endoscopy segment achieved sales of $3,389 million in 2024, compared to $3,068 million in 2023 and $2,759 million in 2022. Growth was supported by advancements in visualization systems and strong procedural adoption in minimally invasive surgeries.
- The Medical segment recorded revenue of $3,852 million in 2024, increasing from $3,459 million in 2023 and $3,031 million in 2022. The rise reflects higher sales of emergency medical equipment, hospital beds, and connected patient-care solutions.
- The Neurovascular division generated $1,307 million in 2024, up slightly from $1,226 million in 2023 and $1,200 million in 2022. The improvement was fueled by strong uptake of stroke intervention and embolic device systems.
- The Neuro Cranial segment delivered $2,136 million in 2024, compared to $1,876 million in 2023 and $1,658 million in 2022. The growth was supported by innovation in cranial fixation systems and the expanding demand for neurosurgical implants globally.
Orthopaedics
- In 2024, the Orthopaedics segment reported an 9% increase in net sales as reported and a 9.4% rise in constant currency, despite a 0.5% adverse impact from foreign exchange movements. Excluding the 0.7% effect of acquisitions and divestitures, growth in constant currency was driven by an 8.7% rise in unit volumes, reflecting robust shipment activity across all orthopaedic product lines, including knees, hips, and trauma implants. The improvement underscores steady procedure recovery and sustained global demand for reconstructive and fixation solutions.
- In 2023, Orthopaedics’ net sales advanced 3% as reported and 10.9% in constant currency, with a 0.6% headwind from foreign exchange rates. After adjusting for a 0.1% acquisition and divestiture impact, growth in constant currency was primarily supported by an 11.9% rise in shipment volumes, partially offset by a 1.1% decline due to pricing pressure. The strong performance reflected increased procedural volumes and solid adoption of robotic-assisted surgery platforms across most orthopaedic business divisions.
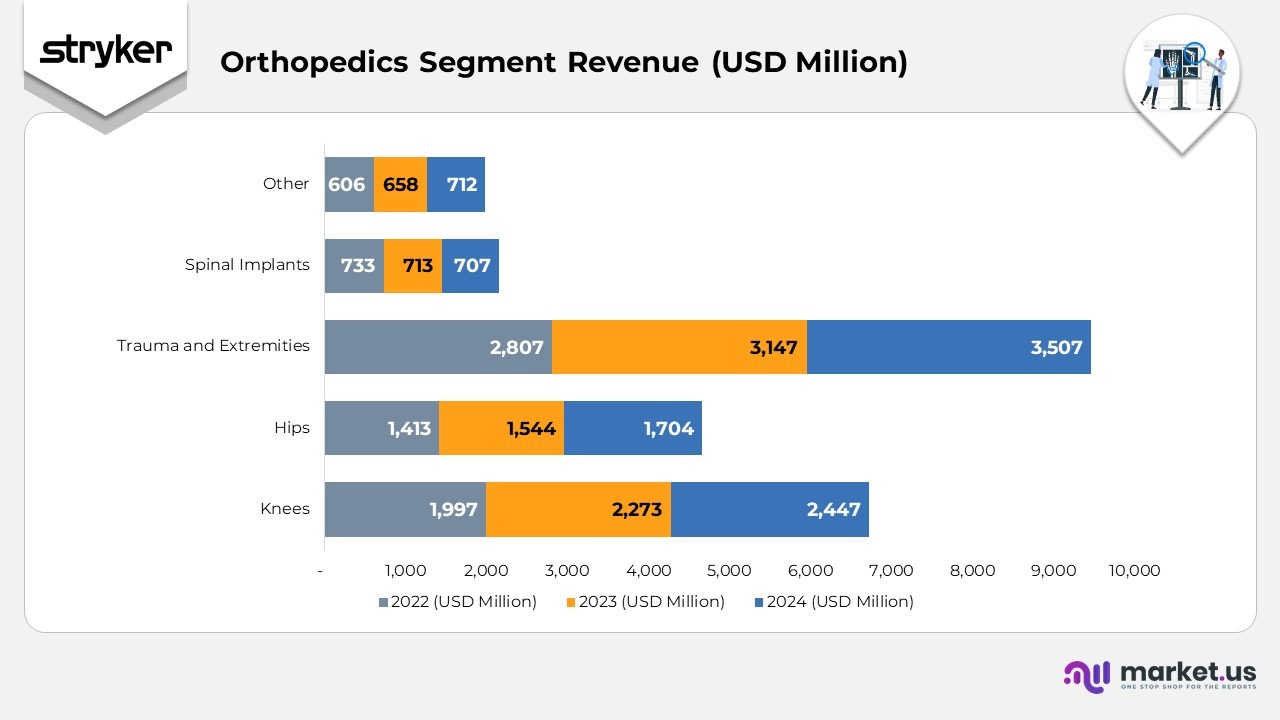
- The Knees division generated $2,447 million in 2024, rising from $2,273 million in 2023 and $1,997 million in 2022. Growth was driven by expanding adoption of robotic-assisted knee replacements and increasing procedural volumes in hospitals and surgical centers.
Moreover
- The Hips division achieved $1,704 million in 2024, compared with $1,544 million in 2023 and $1,413 million in 2022. The upward trend reflects the broader adoption of advanced implant materials and minimally invasive hip surgery techniques.
- The Trauma and Extremities segment posted $3,507 million in 2024, an increase from $3,147 million in 2023 and $2,807 million in 2022. This steady rise highlights strong demand for orthopedic fixation systems and continuous product innovation in extremity reconstruction.
- The Spinal Implants segment reported $707 million in 2024, showing a slight dip from $713 million in 2023 and $733 million in 2022. The modest decline was linked to pricing pressure and market stabilization after a period of accelerated growth.
- The Other category contributed $712 million in 2024, up from $658 million in 2023 and $606 million in 2022. The consistent increase was driven by diversification of supporting product lines and expanded applications across complementary medical technologies.
(Source: Stryker Corporation SEC Filings)
Medical Equipment Patents of Stryker
| Product Name | Patent Numbers (U.S.) |
|---|---|
| ED Wall Cabinet | 10589111 |
| Air+ Pump | 11,865,058; D890,914; D903,094; D985,756 |
| Bariatric Non-Powered Support Surface | 11484449 |
| CODE-STAT Data Review Software and Service | 7,805,191; 8,036,742; 8,060,199; 8,532,764; 8,666,488; 10,114,807; 10,490,308 |
| ComfortGel Support Surface | 8607387 |
| Emergency Relief Bed | 11723820 |
| Epic II Critical Care Bed | 7,712,166; 8,689,376; 11,883,156 |
| Eye Surgery Procedural Stretcher | 6,792,630; 8,789,662 |
| Floor or Wall-Mounts Cot Fastener | 6,908,133; 8,056,950 |
| Glide Lateral Air Transfer System | 7,861,335; 8,234,727 |
| GoBed II MedSurg Bed | 7,082,630; 7,472,439; 7,702,481; 7,784,125 |
| Gynnie OB/GYN Stretcher | 6957457 |
| HeartSine Samaritan PAD | 7,801,605; 8,209,007; 8,909,336; 9,155,482; 9,238,146; 9,814,407; 11,975,184; 11,975,210 |
| iBed Locator | 8,319,633; 8,674,826 |
| iBed Vision Clinical Dashboard | 9,149,190; 9,788,800; 10,827,985; 11,490,835; 12,170,011 |
| InTouch Critical Care Bed | 6,721,975; 7,082,630; 7,386,900; 7,784,125; 7,836,531; 8,393,026; 8,689,376; 9,126,571; |
(Source: Company Website)
Instruments Patent Portfolio of Stryker (U.S. Patent Filings)
| Product Name | Product Code | Patent Numbers (U.S.) |
|---|---|---|
| Mask, Large, Medium/High Oxygen Concentration Adapter | 1001 | 8,960,195; 8,365,734; 11,020,557; D846,113 |
| Mask, Large, Medium Oxygen Concentration Adapter | 1003 | 8,960,195; 8,365,734; 11,020,557; D846,113 |
| STERIZONE 125-280 Solution (280mL) | 44010 | 9,402,928; 9,480,764; 9,427,485; 10,383,966; 9,480,765; 8,888,926 |
| STERIZONE 125-280 Solution (280mL) | 50900 | 9,402,928; 9,480,764; 9,427,485; 10,383,966; 9,480,765; 8,888,926 |
| MEDPOR TITAN 3D Orbital Floor, MTB Left Small | 81041 | 7,655,047; 8,298,292; 8,398,292 |
| MEDPOR TITAN 3D Orbital Floor, MTB Right Small | 81042 | 7,655,047; 8,298,292; 8,398,292 |
| MEDPOR TITAN 3D Orbital Floor, MTB Left Large | 81043 | 7,655,047; 8,298,292; 8,398,292 |
| MEDPOR TITAN 3D Orbital Floor, MTB Right Large | 81044 | 7,655,047; 8,298,292; 8,398,292 |
| PhotonGuide, Narrow/Flat | 104008 | 11,382,711; 10,810,496; 9,468,366; 9,282,878; 9,271,709; 9,844,364; 10,582,844; 8,088,066; 10,405,941; 8,317,693; 10,226,555 |
| PhotonGuide, Wide/Flat | 104015 | 11,382,711; 10,810,496; 9,468,366; 9,282,878; 9,271,709; 9,844,364; 10,582,844; 8,088,066; 10,405,941; 8,317,693; 10,226,555 |
| PhotonSaber F, 12 Fr, Standard, Round | 1911273 | 11,376,093; 9,510,737; 9,044,161; 9,636,182; 8,292,805; 8,568,304; 8,936,551 |
| Locking Screws, SD, 2.0x6mm | 5020596 | 8,118,850; 8,979,529; 9,220,552; 10,485,593; 11,000,324 |
| Locking Screws, SD, 2.0x8mm | 5020598 | 8,118,850; 8,979,529; 9,220,552; 10,485,593; 11,000,324 |
| SMARTLock Hybrid MMF Plate | 5502950 | 8,118,850; 8,979,529; 9,220,552; 10,485,593; 11,000,324; 11,272,970; 11,751,924 |
| SMARTLock Hybrid MMF Plate – Small | 5502951 | 8,118,850; 8,979,529; 9,220,552; 10,485,593; 11,000,324; 11,272,970; 11,751,924 |
| SMARTLock Hybrid MMF Spacer | 6200605 | 8992582 |
| SMARTLock Hybrid MMF Spacer – Large | 6200607 | 8992582 |
| Bipolar Generator | 6700313500 | 9119623 |
| Adjustable Globe Retractor | 1-02395 | 9717489 |
| 2-Hole Plate Set, Self-Tapping Screw | 12-01541S | 10039630 |
| 2-Hole Plate Set, Low Profile with Tab | 12-01542S | 10039630 |
| 2-Hole Plate Burr Hole Cover 14mm Set | 12-01544S | 10039630 |
| 2-Hole Plate Burr Hole Cover 20mm Set | 12-01546S | 10039630 |
| Surgeon iD Series (All Plate Variants) | 92-40628 to 92-50728 | 11351030 |
(Source: Company Website)
Recent Developments
- In January 2025, Stryker entered into a definitive agreement to acquire Inari Medical, Inc., expanding its footprint in the fast-growing venous thromboembolism (VTE) treatment segment. The acquisition strengthens Stryker’s leadership in peripheral vascular care, complementing its existing Neurovascular division. Inari’s advanced mechanical thrombectomy portfolio targeting deep vein thrombosis and pulmonary embolism will enhance Stryker’s minimally invasive vascular solutions.
- In October 2024, Stryker completed the acquisition of Vertos Medical Inc., a company known for its nonsurgical spinal decompression therapy. This acquisition reinforces Stryker’s position in interventional pain management and expands its offerings for chronic lower back pain treatment, particularly within ambulatory surgery centers (ASCs).
- In September 2024, Stryker acquired care.ai, a healthcare AI company focused on real-time intelligent monitoring and smart clinical workflows. This collaboration supports Stryker’s digital transformation strategy, enabling the development of connected care ecosystems that empower clinicians with data-driven decision tools for enhanced patient outcomes.
- In August 2024, Stryker strengthened its spine care portfolio through the acquisition of Vertos Medical Inc., recognized for its minimally invasive lumbar spinal stenosis (LSS) treatment technology. The deal broadens Stryker’s neuro and spine care capabilities, aligning with its mission to deliver innovative, patient-centric pain relief solutions.
(Source: Stryker Corporation Press Releases)