
Global Water Testing Market Size, Share Analysis Report By Test Type (Physical Tests, Chemical Tests, Microbiological Tests), By Technology (HPLC-based, LC-MS/MS-based, Immunoassay-based, Others), By Application (Drinking Water, Wastewater, Aquaculture, Others) , By Region and Companies - Industry Segment Outlook, Market Assessment, Competition Scenario, Trends and Forecast 2025-2034
- Published date: Oct 2025
- Report ID: 162299
- Number of Pages: 381
- Format:
-
keyboard_arrow_up
Quick Navigation
Report Overview
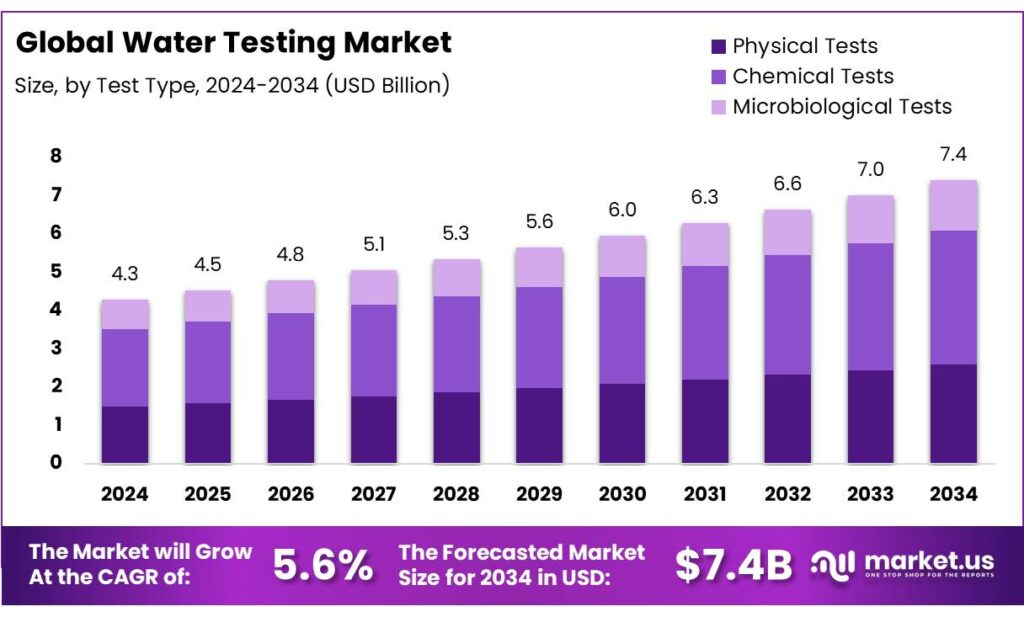
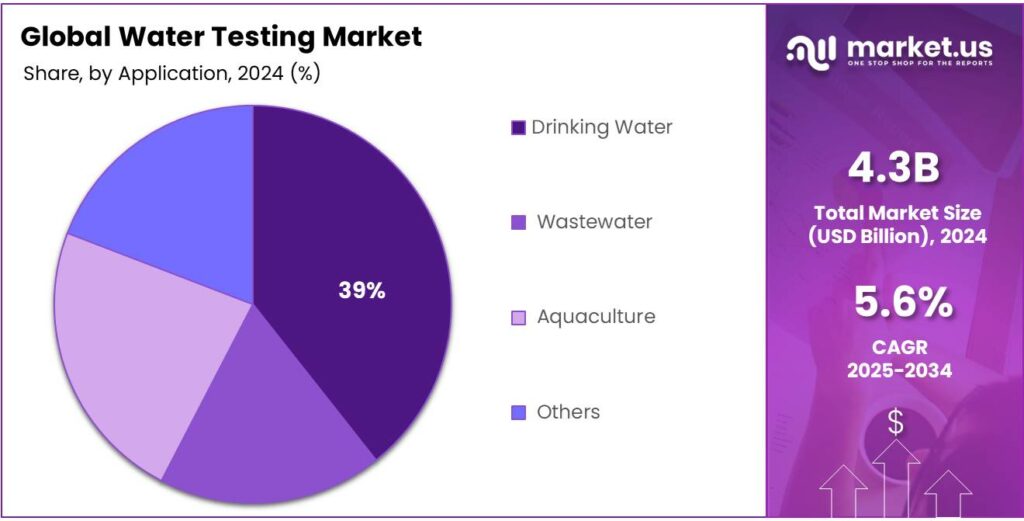
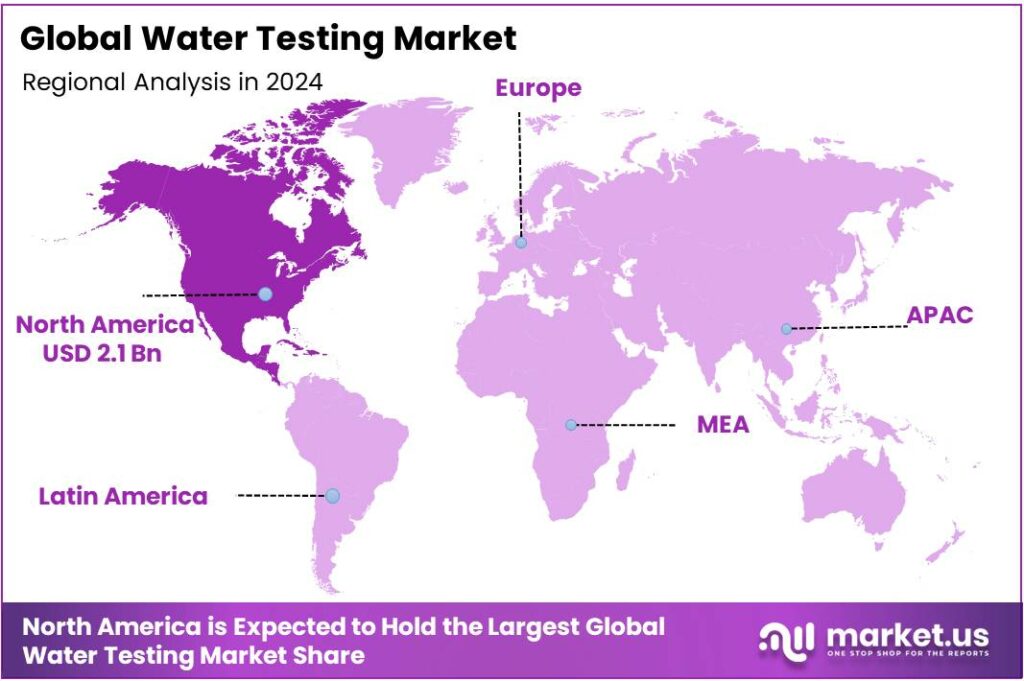
The Global Water Testing Market size is expected to be worth around USD 7.4 Billion by 2034, from USD 4.3 Billion in 2024, growing at a CAGR of 5.6% during the forecast period from 2025 to 2034. In 2024 North America held a dominant market position, capturing more than a 49.3% share, holding USD 2.1 Billion in revenue.
The global water-testing value chain spans municipal utilities, industrial and power plants, contract labs, on-site rapid tests, and online analyzers embedded in treatment assets such as desalination and reuse. Demand is structurally underpinned by persistent service gaps: in 2022, 2.2 billion people lacked safely managed drinking water, keeping compliance monitoring and source-to-tap risk assessments in focus. At the same time, only 56% of domestic wastewater was safely treated in 2024, implying large volumes that require monitoring for pathogens, nutrients, and chemicals before discharge or reuse.
Energy-sector dynamics are a major volume driver. The IEA reports ~21,000 desalination plants operating in ~150 countries, with global energy demand for desalination nearly doubling since 2010 and on track to double again by 2030—all of which lifts continuous monitoring needs for salinity, boron, metals, and DBP precursors. Desalination is energy-intensive, often >1 kWh per m³ treated, and in 2023 the Middle East’s desalination energy use was ~½ of the region’s residential energy consumption, reinforcing utilities’ push for energy-optimized, inline sensors and control-grade analytical data.
Regulation and policy reinforce this momentum. In the EU, the revised Drinking Water Directive (2020/2184) introduced risk-based monitoring and an evolving watch list; since January 2022, utilities must monitor endocrine disruptors such as β-estradiol and nonylphenol, expanding laboratory workflows for trace organics.
In the United States, the Bipartisan Infrastructure Law provides >$50 billion for drinking-water and clean-water programs, including $15 billion for lead service line replacement, which requires extensive lead/corrosion control testing and post-replacement verification. India’s Jal Jeevan Mission continues to widen the tested network: 79.74% of rural households had tap water by 1 Feb 2025 (up from 17% in 2019), expanding compliance sampling, residual chlorine checks, and bacteriological testing across rural schemes.
Key driving factors include universal-service commitments and SDG-aligned reporting; tighter chemical and microbiological standards; and the energy-water nexus pushing operators toward process-analytical technologies that shrink energy per m³ while safeguarding quality.
For example, desalination’s share of total final energy use in the Middle East is projected to rise from ~5% today to ~15% by 2040, encouraging utilities to pair membrane and pre-treatment optimization with real-time analyzers for fouling and integrity monitoring.
Key Takeaways
- Water Testing Market size is expected to be worth around USD 7.4 Billion by 2034, from USD 4.3 Billion in 2024, growing at a CAGR of 5.6%.
- Chemical Tests held a dominant market position, capturing more than a 47.9% share of the global water testing market.
- Natural held a dominant market position, capturing more than a 73.2% share of the water testing market.
- Automotive held a dominant market position, capturing more than a 31.7% share of the water testing market.
- North America dominated the global water testing market, capturing a substantial 49.3% share, equating to an estimated value of $2.1 billion.
By Test Type Analysis
Chemical Tests dominate water testing with 47.9% market share in 2024 due to their accuracy and reliability
In 2024, Chemical Tests held a dominant market position, capturing more than a 47.9% share of the global water testing market. This strong presence can be attributed to their ability to detect a wide range of contaminants, including heavy metals, chlorine, nitrates, and other chemical residues, with high precision. Industries and municipal authorities increasingly rely on chemical testing to ensure compliance with safety standards and maintain public health. Over the year, the adoption of these tests has been bolstered by growing awareness about waterborne chemical hazards and the need for routine monitoring in both urban and rural settings.
The method’s cost-effectiveness and ease of implementation in laboratories, as well as portable field kits, have further reinforced its preference among water quality professionals. By 2025, the segment is expected to maintain its leading role, continuing to serve as a benchmark for accuracy and reliability in water testing practices globally.
By Technology Analysis
Natural technology leads water testing with 73.2% share in 2024 due to its eco-friendly and efficient approach
In 2024, Natural held a dominant market position, capturing more than a 73.2% share of the water testing market. This strong dominance is driven by the growing preference for eco-friendly and sustainable testing methods that minimize chemical usage while maintaining accurate results. Natural technologies, such as biosensors and biological indicators, are widely used for monitoring water quality in rivers, lakes, and drinking water systems.
Their ability to provide real-time analysis and reduce environmental impact has made them a preferred choice for both government agencies and private industries. In 2025, the Natural technology segment is expected to continue its leading role, supported by rising environmental awareness, stricter water quality regulations, and increased adoption in industrial and municipal water monitoring programs.
By Application Analysis
Automotive sector leads water testing with 31.7% share in 2024 due to stringent quality requirements
In 2024, Automotive held a dominant market position, capturing more than a 31.7% share of the water testing market. This leadership is largely driven by the industry’s stringent requirements for high-quality water in manufacturing processes, including cooling systems, painting, and battery production. Contaminants in water can directly affect product performance and durability, making regular testing essential for automakers and their suppliers.
The adoption of advanced testing methods ensures compliance with environmental regulations and helps maintain operational efficiency. In 2025, the Automotive segment is expected to sustain its strong position, supported by the growing focus on electric vehicles, increasing production volumes, and heightened emphasis on water quality management throughout the automotive supply chain.
Key Market Segments
By Test Type
- Physical Tests
- Chemical Tests
- Microbiological Tests
By Technology
- HPLC-based
- LC-MS/MS-based
- Immunoassay-based
- Others
By Application
- Drinking Water
- Wastewater
- Aquaculture
- Others
Emerging Trends
Risk-based, fit-for-purpose testing and reuse
This trend has a human reason: unsafe food still hurts far too many people. The WHO estimates 600 million people fall ill and 420,000 die each year from foodborne disease; the economic loss is US $110 billion annually in low- and middle-income countries. When water comes into direct or indirect contact with food, these numbers become real drivers for better testing programs, faster results, and clearer corrective actions.
Regulators are reinforcing risk-based thinking with explicit numeric triggers. Under the U.S. FSMA Produce Safety Rule, untreated agricultural water applied during growing must meet set microbial criteria: geometric mean ≤ 126 CFU of generic E. coli per 100 mL and statistical threshold value ≤ 410 CFU per 100 mL. Those numbers translate into routine sampling plans, lab capacity, and, increasingly, at-line testing so farms can spot issues before harvest rather than after distribution.
Upstream infrastructure policy is accelerating the same trajectory. The U.S. Bipartisan Infrastructure Law channels more than US $50 billion into water programs, including US $15 billion dedicated to replacing lead service lines. Lead and Copper Rule improvements further require systems to inventory lines and strengthen testing. For food and beverage plants that depend on municipal supply, these investments improve source quality—and the associated monitoring spend expands the overall testing ecosystem that also serves food operators.
Drivers
Ensuring Safe Water in Food Processing: A Key Driving Factor for Water Testing
One major driving force behind the growth of water-testing in the food industry is the strict regulatory requirement to ensure water used in food production is safe and of adequate sanitary quality. This may sound straightforward, but the reality is that water touches nearly every step in food processing—from irrigation and washing salad greens, to rinsing equipment and cleaning processing lines. Because water can both introduce contaminants and help spread them, food industry operators cannot afford to bypass rigorous testing regimes.
For instance, under the Food Safety Modernization Act (FSMA) Produce Safety Rule in the U.S., water used for irrigation of covered produce must meet very specific microbial criteria: for untreated agricultural water the geometric mean (GM) of samples must be 126 colony forming units (CFU) or less of generic E. coli per 100 mL, and the statistical threshold value (STV) must be 410 CFU or less per 100 mL. This kind of numerical limit signals how precise and measurable the requirement is, rather than just vague notions of “clean water”.
The food safety guidance from the World Health Organization (WHO) and the Food and Agriculture Organization (FAO) also emphasises the importance of “fit-for-purpose” water in food production and processing. Their joint “Guidelines for the safe use and reuse of water in food production and processing” note that many food businesses engage water in ways that are direct contact with product, or indirect (washing, cooling, steam) — and thus the water must be evaluated, treated, monitored and if needed repeatedly tested.
When food processors use non-compliant water, the consequences are serious: outbreaks of foodborne illness, product recalls, brand damage, regulatory fines, and costly downtime for equipment cleaning or replacement. In many cases, the water supply is invisible until something goes wrong. Because of this, more food companies are investing proactively in frequent testing, in-line sensors and rapid microbial or chemical assays to detect deviations before they escalate into crises.
Restraints
High compliance costs for small food producers
A major restraint on the expansion of water testing is the cost and complexity that fall hardest on small and very-small food producers. Under the U.S. Food Safety Modernization Act (FSMA) Produce Safety Rule, farms must manage agricultural water quality through assessments, sampling, and documented controls. In May 2024, FDA reiterated legacy numeric sampling expectations in the Federal Register—at least 20 samples over 2–4 years for untreated surface water to build an initial microbial water quality profile, then 5 samples annually—requirements that many small farms still reference when designing programs.
The economics magnify the burden. USDA’s Economic Research Service estimated annual FSMA compliance costs of about $5,560 for very small farms, $21,136 for small farms, and $29,228 for large farms—with costs taking a larger share of sales for the smallest operators because many expenses (training, documentation, testing set-up) are fixed. For some very small farms, compliance can reach ~6% of gross sales, versus ~1% for large farms. These dollar and percentage figures help explain why routine microbial testing, verification sampling, and corrective-action checks can feel unaffordable for family-scale producers.
Food processors face similar pressures. The sector employed 1.7 million workers in 2021 in the United States alone, which implies significant ongoing training and operational time devoted to water monitoring at cleaning, rinsing, steam, and ingredient-makeup points—time that smaller plants struggle to carve out without disrupting throughput. When budgets are tight, operators may postpone periodic tests for secondary parameters (e.g., trace metals, disinfectant residuals), focusing only on minimum microbial checks. That triage can raise risk and delay adoption of better, more frequent monitoring.
Global infrastructure realities add another layer of strain, especially for suppliers sourcing from lower-income regions. About 42% of household wastewater was not safely treated in 2022, and WHO estimates ~113 billion m³ of domestic wastewater was released with inadequate or no treatment. Variable source-water quality raises the number of tests needed to demonstrate fitness-for-purpose in food production, yet local labs and accredited services may be scarce or costly, lengthening turnaround times and increasing logistics expenses for sampling.
Opportunity
Fit-for-purpose water reuse in food processing
A major growth opportunity in water testing is the shift to fit-for-purpose water reuse across the food chain. The case is strong and human: safer food depends on safer water, and testing is the bridge that makes reuse trustworthy. The global burden of unsafe food remains heavy—about 600 million people fall ill and 420,000 die each year—so food businesses are tightening hygiene controls, including the water that touches produce, equipment, steam, and ice. This burden figure from WHO is a sober reminder that more frequent, risk-based testing can prevent illness and protect families.
Regulatory numerics in major markets reinforce this shift. Under the U.S. FSMA Produce Safety Rule, untreated agricultural water applied during growing must meet explicit microbial criteria: a geometric mean ≤ 126 CFU of generic E. coli per 100 mL and a statistical threshold value ≤ 410 CFU per 100 mL. These numbers drive continuous verification—more sampling, more lab capacity, and more at-line screening—especially when farms diversify sources. As more regions align with risk-based approaches, similar numeric triggers will expand globally.
Public investment is another catalyst. The U.S. Bipartisan Infrastructure Law directs more than $50 billion to water programs, including $15 billion for lead service line replacement—with 49% of those LSLR funds flowing as grants or principal-forgiveness loans. Utilities undertaking millions of replacements must validate corrosion control, confirm post-replacement water quality, and communicate results—each step requiring reliable tests. Though not a food-specific policy, the upgrades strengthen the upstream quality of the water that many food plants rely on, while the associated monitoring spend enlarges the overall testing ecosystem that also serves food manufacturers.
Regional Insights
North America leads water testing market with 49.3% share in 2024, valued at $2.1 billion
In 2024, North America dominated the global water testing market, capturing a substantial 49.3% share, equating to an estimated value of $2.1 billion. This leadership is primarily attributed to the region’s stringent regulatory frameworks, robust infrastructure, and heightened public awareness regarding water quality. The United States, in particular, has been proactive in implementing comprehensive water testing programs, with over 58 million individual water tests conducted in 2024. Approximately 41% of these tests were performed for industrial compliance, while 26% focused on ensuring the safety of drinking water
The U.S. Environmental Protection Agency (EPA) has been instrumental in enforcing rigorous water quality standards, necessitating frequent testing to monitor contaminants and ensure public health safety. This regulatory environment has spurred the growth of certified laboratories, with the U.S. housing over 5,400 such facilities in 2024. Canada, too, has contributed significantly to the region’s market share, with more than 1,600 certified laboratories and a growing emphasis on water quality monitoring.
Key Regions and Countries Insights
- North America
- US
- Canada
- Europe
- Germany
- France
- The UK
- Spain
- Italy
- Rest of Europe
- Asia Pacific
- China
- Japan
- South Korea
- India
- Australia
- Rest of APAC
- Latin America
- Brazil
- Mexico
- Rest of Latin America
- Middle East & Africa
- GCC
- South Africa
- Rest of MEA
Key Players Analysis
TÜV SÜD is an international leading technical service organization catering to the Industry, Mobility, and Certification segments. The company’s Water laboratory supports organizations in meeting environmental regulations and improving the efficiency and sustainability of water treatment plants. TÜV SÜD’s comprehensive portfolio of services for drinking water installations, water heating installations, cooling and cold water systems, as well as steam and hot water boilers, positions it as a trusted partner in the water testing market.
UL LLC is a global safety science company with more than a century of expertise in innovating safety solutions. The company offers a broad range of comprehensive services to test, inspect, and certify the essential materials, products, and technologies that deliver water. UL Solutions’ services help prevent harmful chemicals, metals, and microorganisms from contaminating drinking water, supporting the industry’s commitment to water safety and quality.
Bureau Veritas SA is a world leader in laboratory testing, inspection, and certification services. The company delivers deep capabilities in water and wastewater testing as part of its comprehensive Green Line Services and Solutions, helping clients improve performance and minimize risk while strengthening their brands. Bureau Veritas’s extensive experience and global presence make it a key player in the water testing industry.
Top Key Players Outlook
- SGS SA
- Intertek Group plc
- ALS Limited
- Bureau Veritas SA
- TÜV SÜD
- UL LLC
- Hach Company
- ABB Ltd.
- Xylem Inc.
- Horiba, Ltd.
Recent Industry Developments
SGS SA, headquartered in Geneva, Switzerland, is a global leader in inspection, verification, testing, and certification services. In 2024, the company reported record sales of CHF 6.79 billion, with a strong organic growth of 7.5%.
Intertek Group plc, headquartered in London, is a global leader in Assurance, Testing, Inspection, and Certification (ATIC) services. In 2024, the company reported revenues of £3.39 billion, reflecting a 6.6% growth at constant currency and a 1.9% increase at actual rates.
Report Scope
Report Features Description Market Value (2024) USD 4.3 Bn Forecast Revenue (2034) USD 7.4 Bn CAGR (2025-2034) 5.6% Base Year for Estimation 2024 Historic Period 2020-2023 Forecast Period 2025-2034 Report Coverage Revenue Forecast, Market Dynamics, Competitive Landscape, Recent Developments Segments Covered By Test Type (Physical Tests, Chemical Tests, Microbiological Tests), By Technology (HPLC-based, LC-MS/MS-based, Immunoassay-based, Others), By Application (Drinking Water, Wastewater, Aquaculture, Others) Regional Analysis North America – US, Canada; Europe – Germany, France, The UK, Spain, Italy, Rest of Europe; Asia Pacific – China, Japan, South Korea, India, Australia, Singapore, Rest of APAC; Latin America – Brazil, Mexico, Rest of Latin America; Middle East & Africa – GCC, South Africa, Rest of MEA Competitive Landscape SGS SA, Intertek Group plc, ALS Limited, Bureau Veritas SA, TÜV SÜD, UL LLC, Hach Company, ABB Ltd., Xylem Inc., Horiba, Ltd. Customization Scope Customization for segments, region/country-level will be provided. Moreover, additional customization can be done based on the requirements. Purchase Options We have three licenses to opt for: Single User License, Multi-User License (Up to 5 Users), Corporate Use License (Unlimited User and Printable PDF) 
-
-
- SGS SA
- Intertek Group plc
- ALS Limited
- Bureau Veritas SA
- TÜV SÜD
- UL LLC
- Hach Company
- ABB Ltd.
- Xylem Inc.
- Horiba, Ltd.
Our Clients
- 162299
- Oct 2025


