


Quick Navigation
- Report Overview
- Key Takeaways
- Product Type Analysis
- Sales Channel Analysis
- Traveler Type Analysis
- Store Format Analysis
- Distribution Model Analysis
- Location Analysis
- Customer Category Analysis
- Key Market Segments
- Regional Analysis
- Key Regions and Countries
- Market Dynamics
- Drivers
- Restraints
- Challenges
- Opportunities
- Key Company Insights
- Recent Developments
- Geopolitical Impact Analysis
- Report Scope
Report Overview
Global Travel Retail Market size is expected to be worth around USD 184.8 Billion by 2035 from USD 86.4 Billion in 2025, growing at a CAGR of 8.0% during the forecast period 2026 to 2035. This growth reflects rising international mobility feeding airport commercial zones. Operators who scale terminal footprint early will capture the widening shopper base before concession costs reset upward.
Travel Retail covers goods sold to travelers in transit through airports, cruise ports, border zones, and onboard channels. This market bundles beauty, spirits, luxury fashion, and confectionery under duty-free and duty-paid formats. Retailers operate as concessionaires under fixed guarantees to airport authorities. This structure ties profit directly to passenger flow, so location access and category mix decide who wins share.
Key Takeaways
- Global Travel Retail Market size will reach USD 184.8 Billion by 2035 from USD 86.4 Billion in 2025 at a CAGR of 8.0%.
- Beauty & Personal Care leads Product Type with a 34.80% share.
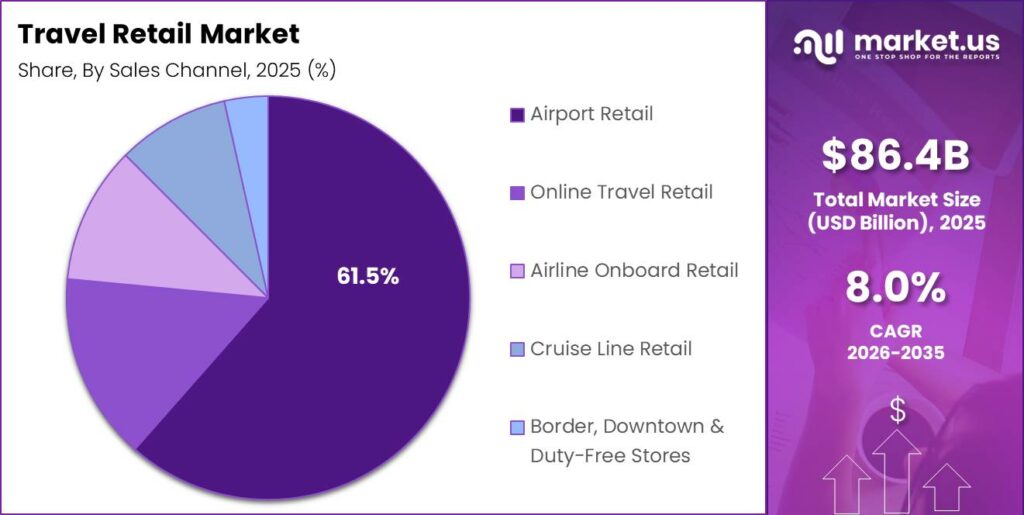
- Airport Retail dominates Sales Channel with a 61.50% share.
- Leisure Travelers hold the largest Traveler Type share at 66.20%.
- Duty-Free Stores command Store Format with a 58.40% share.
- Direct Retail Operators lead Distribution Model with a 55.60% share.
- International Airports anchor the Location segment at a 63.80% share.
- Premium & Luxury Shoppers dominate Customer Category with a 47.90% share.
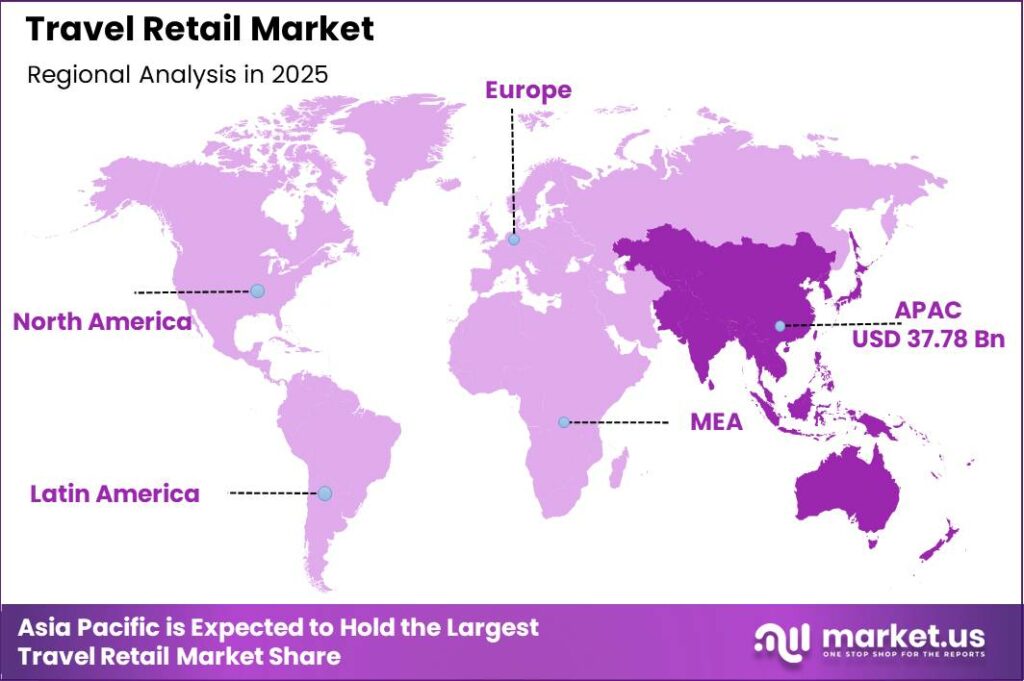
- Asia-Pacific leads all regions with a 43.70% share, valued at USD 37.78 Billion.
Government aviation policy and airport authority investment shape retail access across this market. Authorities award concessions through competitive tenders that set minimum guarantees. This means operators must forecast passenger flow accurately to bid without eroding margin. Regulators also govern duty-free allowances and security rules on liquids. Therefore policy shifts in one region can redirect billions in category spend toward competing hubs almost overnight.
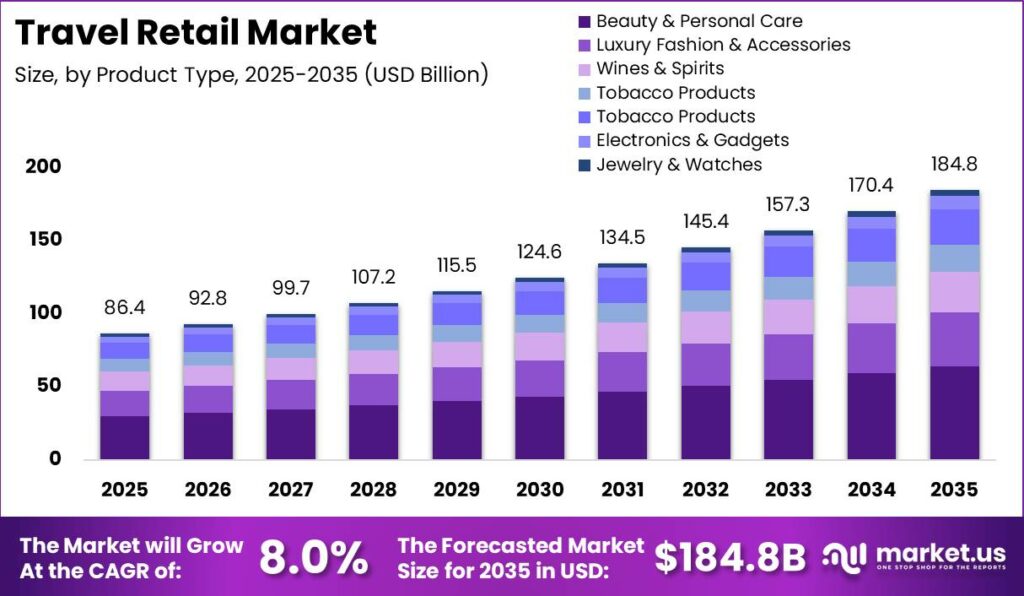
Data from ETRC shows European travel retail sales reached €10.13 Billion in 2025, confirming strong regional demand recovery. This scale rewards operators expanding beauty and spirits assortments at European hubs. As per our research, Dubai International Airport handled 95.2 million passengers in 2025 as the world’s busiest international hub. This traffic funnels premium shoppers into Middle East retail zones. Consequently, hub-linked operators gain pricing power that smaller regional players cannot match.
Airport dining and entertainment investment now drives incremental retail demand across terminals. In 2025, Avolta accelerated its Destination 2027 strategy using hybrid retail-and-dining concepts and Michelin-chef collaborations. This shift lifts dwell time and conversion at boarding zones. This creates a clear cause link, richer terminal experiences raise per-passenger spend. Operators who blend retail with dining will defend share as pure duty-free formats mature and margins tighten.
Product Type Analysis
Beauty & Personal Care dominates with 34.80% due to fragrance and skincare travel exclusives.
In 2025, Beauty & Personal Care held a dominant market position in the By Product Type segment of Travel Retail Market, with a 34.80% share. IATA reported global air passenger traffic rose 10.4% in 2024, expanding the fragrance shopper pool. This lift funnels first-time buyers toward high-margin skincare. Brands that launch airport-exclusive sets will lock loyalty before travelers reach domestic stores.
Wines & Spirits function as a heritage anchor category built on gifting and collectible bottlings. IATA counted 116.9 million international premium-class travelers in 2024, the core buyers of aged spirits. This cohort values exclusivity over price. This signals that limited-edition releases will protect spirits volume even as younger travelers drink less. Operators should curate rare labels to defend basket value.
Luxury Fashion & Accessories rely on impulse buying from affluent transit shoppers. ACI found roughly 70% of airport retail purchases are impulse driven. This behavior favors visible, boutique-led placement near gates. This means brands that secure prime terminal frontage will convert browsing into sales. Tobacco Products and Confectionery & Fine Foods serve steady demand, while Electronics & Gadgets and Jewelry & Watches together hold the remaining share.
Group tour and leisure flows sustain confectionery and fine food demand across Asian hubs. ACI data covering 36 airports across 21 countries showed traveler mix now shapes retail performance more than volume alone. This reframes assortment strategy around who flies, not how many. In May 2025, Lagardère Travel Retail partnered with BFA to launch Relay at Antalya International Airport, expanding travel essentials reach. This move widens low-ticket, high-frequency category access for transit crowds.
Sales Channel Analysis
Airport Retail dominates with 61.50% due to captive high-traffic international departure zones.
In 2025, Airport Retail held a dominant market position in the By Sales Channel segment of Travel Retail Market, with a 61.50% share. IATA measured full-year 2024 traffic 3.8% above pre-pandemic levels. This captive footfall guarantees exposure no other channel matches. Operators anchoring airport concessions secure predictable revenue that supports aggressive category investment.
Online Travel Retail lets travelers pre-order and collect goods before departure. Pre-committed digital shoppers spend far more than walk-in buyers per transaction. This behavior raises average basket value and cuts sampling cost. This means operators building reserve-and-collect platforms will lift margin without adding floor space. Early digital adopters gain a first-mover data advantage.
Airline Onboard Retail reaches passengers during flight through catalog and cabin sales. ACI reported 56% of airports posted commercial revenues above 2019 levels, confirming channel-wide recovery momentum. This backdrop supports onboard expansion as a complementary touchpoint. This creates room for airlines to monetize captive cabin time. Cruise Line Retail and Border, Downtown & Duty-Free Stores hold the remaining share, serving niche transit and destination shoppers.
Traveler Type Analysis
Leisure Travelers dominate with 66.20% due to relaxed schedules boosting browsing time.
In 2025, Leisure Travelers held a dominant market position in the By Traveler Type segment of Travel Retail Market, with a 66.20% share. IATA recorded 10.4% traffic growth in revenue passenger kilometers during 2024. Leisure trips extend dwell time and lift impulse conversion. Operators tuning promotions to holiday flows will capture this majority spend most efficiently.
Business Travelers move quickly but carry high spending power on premium goods. IATA counted 116.9 million international premium-class passengers in 2024, a prime target cohort. This group values speed and convenience over browsing. This means express purchase formats and pre-order pickup will convert time-poor executives. Retailers should streamline checkout for this segment.
Group Tour Travelers drive volume purchases through coordinated shopping stops at major hubs. Asia-Pacific held roughly one third of global airline passenger traffic in recent years, feeding tour flows. This concentration rewards multilingual service and bulk gifting displays. This creates upside for operators serving organized Asian tour groups. Transit Passengers hold the remaining share, converting layover time into unplanned spend.
Store Format Analysis
Duty-Free Stores dominate with 58.40% due to tax exemption driving price advantage.
In 2025, Duty-Free Stores held a dominant market position in the By Store Format segment of Travel Retail Market, with a 58.40% share. ETRC reported European travel retail passenger growth of 5.8% in 2025. This traffic feeds tax-free purchasing directly. Operators expanding duty-free floor space at growth hubs will capture the widening eligible shopper base.
Duty-Paid Travel Retail Stores serve domestic and non-qualifying travelers with full-price goods. ACI found nearly 70% of airport purchases are impulse driven regardless of tax status. This shows format flexibility matters more than duty exemption alone. This means operators can extend reach beyond international departures. Duty-paid zones capture domestic flows that duty-free rules exclude.
Specialty Brand Boutiques offer immersive single-brand luxury experiences at premium terminals. ACI noted Chinese, Indian, Emirati, and Saudi nationals rank as the biggest spenders. This concentrated affluence justifies dedicated brand houses. This creates strong returns for boutiques placed along high-net-worth traveler routes. Convenience Stores hold the remaining share, serving quick essential purchases near gates.
Distribution Model Analysis
Direct Retail Operators dominate with 55.60% due to full control over pricing.
In 2025, Direct Retail Operators held a dominant market position in the By Distribution Model segment of Travel Retail Market, with a 55.60% share. IATA measured 2024 traffic 3.8% above the 2019 baseline. Direct control lets operators react fast to this recovering flow. This means integrated operators capture margin that intermediated models surrender to partners.
Omnichannel Retail links online reservation with in-terminal collection across a single system. Digital pre-order shoppers generate materially higher basket values than walk-in buyers. This integration raises conversion while lowering sampling cost. This signals that operators unifying online and offline data will outperform single-channel rivals. Omnichannel readiness becomes a competitive requirement.
Franchise Operations extend brand reach into secondary airports without direct capital exposure. ACI reported 56% of airports exceeded 2019 commercial revenue, supporting franchise expansion economics. This recovery lowers franchise risk in emerging hubs. This creates a scalable path for brands entering fragmented regional markets. Third-Party Concessionaires hold the remaining share, managing space on behalf of airport authorities.
Location Analysis
International Airports dominate with 63.80% due to mandatory transit through retail corridors.
In 2025, International Airports held a dominant market position in the By Location segment of Travel Retail Market, with a 63.80% share. IATA recorded global traffic rising 10.4% in 2024. Airport layouts route every departing passenger past retail. This guaranteed exposure makes airports the single most valuable location for operators seeking scale.
Railway Stations capture high-frequency commuter and intercity travelers at ground level. European passenger growth reached 5.8% in 2025, spilling demand into rail hubs. This overlap widens the addressable transit shopper base. This means operators can extend proven airport formats into busy stations. Rail retail adds volume without airport concession costs.
Seaports & Cruise Terminals serve leisure travelers with extended embarkation windows for browsing. Nearly 70% of transit retail purchases are impulse, a behavior amplified by relaxed cruise schedules. This dwell time lifts conversion above airport averages. This creates an underpenetrated channel for premium and gifting categories. Border Crossings and Downtown Duty-Free Stores hold the remaining share across land and city formats.
Customer Category Analysis
Premium & Luxury Shoppers dominate with 47.90% due to high spend on exclusive goods.
In 2025, Premium & Luxury Shoppers held a dominant market position in the By Customer Category segment of Travel Retail Market, with a 47.90% share. IATA counted 116.9 million international premium-class travelers in 2024. This affluent flow concentrates spending on watches, fragrance, and hard luxury. Operators curating exclusive assortments will capture the highest-value baskets in the market.
Millennials & Gen Z Travelers reshape demand toward experience-led and digitally engaged purchasing. ACI identified younger travelers as emerging big spenders across major hubs. This shift rewards social-media-ready displays and app-based offers. This means operators modernizing engagement will convert this rising cohort early. Digital-native formats become a growth lever.
Value-Oriented Shoppers seek discounts and multipack deals across confectionery and essentials. ACI reported 56% of airports surpassed 2019 commercial revenue, widening the mainstream buyer pool. This scale supports promotion-led volume strategies. This creates steady turnover that balances premium volatility. Corporate Travelers hold the remaining share, favoring fast, convenient purchases between meetings.
Key Market Segments
By Product Type
- Beauty & Personal Care
- Luxury Fashion & Accessories
- Wines & Spirits
- Tobacco Products
- Confectionery & Fine Foods
- Electronics & Gadgets
- Jewelry & Watches
By Sales Channel
- Airport Retail
- Online Travel Retail (Pre-order & Click-and-Collect)
- Airline Onboard Retail
- Cruise Line Retail
- Border, Downtown & Duty-Free Stores
By Traveler Type
- Leisure Travelers
- Business Travelers
- Group Tour Travelers
- Transit Passengers
By Store Format
- Duty-Free Stores
- Duty-Paid Travel Retail Stores
- Specialty Brand Boutiques
- Convenience Stores
By Distribution Model
- Direct Retail Operators
- Omnichannel Retail (Online + Offline)
- Franchise Operations
- Third-Party Concessionaires
By Location
- International Airports
- Railway Stations
- Seaports & Cruise Terminals
- Border Crossings
- Downtown Duty-Free Stores
By Customer Category
- Premium & Luxury Shoppers
- Millennials & Gen Z Travelers
- Value-Oriented Shoppers
- Corporate Travelers
Regional Analysis
Asia-Pacific Dominates the Travel Retail Market with a Market Share of 43.70%, Valued at USD 37.78 Billion
Asia-Pacific leads the Travel Retail Market with a 43.70% share worth USD 37.78 Billion. As per our research, the region draws affluent Chinese, Indian, and Southeast Asian travelers into hub airport retail. This concentration of high spenders lifts luxury and beauty turnover. Operators anchoring APAC hubs will capture the largest absolute revenue pool in this market.
Europe ranks as a fast-growing region built on record duty-free demand. Data from ETRC shows average retail spend per passenger fell to €10.55 in 2025, down 0.3%, even as traffic rose 5.8%. This gap shows volume, not per-head spend, now drives European gains. This means operators must convert rising footfall through sharper assortment to protect margin.
Middle East & Africa, North America, and Latin America together hold the remaining share across their hubs. ACI’s study covering 36 airports across 21 countries concluded traveler mix now shapes retail performance more than passenger volume alone. This finding reframes strategy across all three regions. Consequently, operators should target the nationalities that spend most rather than chasing raw headcount.
Key Regions and Countries
North America
- US
- Canada
Europe
- Germany
- France
- The UK
- Spain
- Italy
- Rest of Europe
Asia Pacific
- China
- Japan
- South Korea
- India
- Australia
- Rest of APAC
Latin America
- Brazil
- Mexico
- Rest of Latin America
Middle East and Africa
- GCC
- South Africa
- Rest of MEA
Market Dynamics
Market Opportunity Analysis - Underserved traveler cohorts and adjacent channels open entry points for new players
Indian travelers form an underexploited cohort within the Leisure Travelers segment that holds 66.20% of the market. This group flies in rising numbers yet lacks tailored assortments at major hubs. This creates room for operators to build India-specific gifting and beauty ranges. New entrants targeting Mumbai and Delhi outbound flows will capture loyalty before incumbents adjust.
Seaports & Cruise Terminals remain underpenetrated within the Location segment led by International Airports at 63.80%. Cruise travelers enjoy long embarkation windows that lift browsing and conversion. This means operators can port proven airport formats into cruise hubs with lower concession costs. Therefore early movers in Mediterranean and Caribbean terminals gain a low-competition foothold.
Millennials & Gen Z Travelers sit below Premium & Luxury Shoppers, who hold 47.90% of the Customer Category segment. This younger cohort spends on experience and digital engagement yet remains under-targeted. This creates an opening for app-led offers and social-ready displays. Consequently, operators building youth-focused engagement will convert a rising demographic ahead of slower rivals.
Technology and Innovation Landscape - Digital pre-order tools and experience-led formats redefine competitive advantage
Digital pre-order and click-and-collect systems reshape how operators capture spend before departure. This channel lets travelers reserve goods online and collect them airside. This shifts revenue from spontaneous browsing to planned high-value purchases. Operators deploying reserve-and-collect platforms will lift basket size without expanding floor space. This means digital readiness now separates leaders from laggards.
AI-driven personalization tools let operators target offers by nationality, itinerary, and dwell time. This technology links pre-trip engagement to in-airport conversion. This creates a data advantage that raises per-passenger revenue meaningfully. Operators investing in recommendation engines will convert transit shoppers more efficiently. Therefore early AI adoption becomes a durable moat in this market.
Hybrid retail-and-dining formats blend shopping with food, entertainment, and immersive brand experiences. Avolta introduced Michelin-chef collaborations and interactive concepts under its Destination 2027 strategy. This approach extends dwell time and lifts conversion at boarding zones. This means operators fusing retail with hospitality will defend spend as pure duty-free formats mature.
Drivers
International air travel has moved past recovery into a structural growth phase led by first-time flyers from India, Southeast Asia, and the Middle East. Market.us data projected global air passengers to reach 4.7 billion in 2024, surpassing the 4.54 billion pre-COVID record in 2019, with Asia-Pacific routes adding roughly 1.2 billion passengers over the 2019 baseline by 2027. This expanding base directly widens the travel retail shopper pool. Operators gain more eligible buyers at every hub.
Passenger volume converts to revenue through dwell time and conversion economics. Hub operators achieve conversion rates of 35–55% with average transaction values of $55–$120 in Asia-Pacific and $70–$140 in Europe. This means each extra 10 million passengers at a 40% conversion rate and $85 value can add roughly $340 million in annual retail revenue at one airport. Investors should back operators positioned at high-growth hubs.
| Driver | (~) % Impact on CAGR Forecast | Geographic Relevance | Impact Timeline |
|---|---|---|---|
| International Air Passenger Volume Recovery & Structural Growth Expanding the Core Travel Retail Shopper Base | +2.6% | Global — Asia-Pacific, Middle East, Europe, North America lead volume growth | Short term (≤ 2 years) |
| Asia-Pacific UHNWI & Affluent Traveler Expansion Driving Luxury & Premium Category Spend at Airports | +1.8% | China, India, South Korea, Japan, Southeast Asia, Middle East (GCC) | Short term (≤ 2 years) |
| Airport Retail Concession Modernization & Terminal Expansion Programs Increasing Leasable Retail Footprint | +1.4% | Middle East (Dubai, Riyadh, Abu Dhabi), India, Southeast Asia, United States, Europe | Short term (≤ 2 years) |
| Beauty & Personal Care Category Premiumization Driving Skincare & Fragrance as the Fastest-Growing Travel Retail Segment | +1.1% | Global — Asia-Pacific, Europe, Middle East primary; North America gaining | Short term (≤ 2 years) |
| Digital Pre-Order, Reserve & Collect, and Airport E-Commerce Integration Lifting Average Transaction Value | +0.7% | Europe, China, South Korea, Singapore, United Arab Emirates, United States | Medium term (2–4 years) |
Restraints
Chinese outbound travel has recovered more slowly than global averages, weighing on luxury retail. Market.us data shows Chinese outbound departures peaked near 155 million trips in 2019 but tracked only 110–120 million annualized in 2024, a shortfall of roughly 25–30%. Reduced flight capacity and domestic travel campaigns extended the gap. This drop cuts the highest-spending shopper cohort at global hubs. Operators lose premium category volume as a result.
Spending behavior has also shifted toward Hainan’s offshore duty-free zone. The Hainan Free Trade Port processed an estimated RMB 430–470 billion in offshore duty-free sales in 2024, substituting for airport spend abroad. This shift cut average spend per Chinese passenger at European outlets by an estimated 22–35% between 2019 and 2024. This means operators must reorient categories away from China-dependent beauty and hard luxury to protect margin.
| Restraint | (~) % Impact on CAGR Forecast | Geographic Relevance | Impact Timeline |
|---|---|---|---|
| China Outbound Travel Recovery Slower Than Pre-COVID Pace & Structural Shift in Chinese Traveler Spend Behavior | -1.9% | Global travel retail — European airports, Asian hub airports, Hainan Island free trade zone | Short term (≤ 2 years) |
| Liquids, Aerosols & Gels (LAGs) Security Restriction Volatility Disrupting Duty-Free Perfume & Beverage Sales | -1.2% | European Union, United Kingdom — post-Brexit aviation security framework divergence | Short term (≤ 2 years) |
| Duty-Free Allowance Reductions & Import Quota Tightening Lowering Per-Trip Purchasable Volume | -0.8% | India (revised baggage rules), China (outbound duty-free reimport limits), Australia, Japan | Short term (≤ 2 years) |
| Airport Concession MAG Escalation & High Fixed-Cost Structure Compressing Operator EBITDA Margins | -0.6% | Global — European, North American, and Middle Eastern hub airport concession renewals | Short term (≤ 2 years) |
| Tobacco & Alcohol Category Volume Secular Decline Under Health Regulation & Generational Consumption Shifts | -0.4% | Global — historically 15–25% of travel retail mix by value now structurally declining | Medium term (2–4 years) |
Challenges
Travel retail revenue depends on how long passengers spend in airside zones, and that time is shrinking. Market.us cited IATA survey data showing average airside dwell time fell from 75–90 minutes in 2019 to 55–70 minutes in 2024 at airports that automated security and immigration. E-gates now operate at over 120 airports globally. This compression cuts the browsing window that drives impulse purchases. Operators lose conversion despite rising traffic.
The friction hits revenue directly because spend rises sharply with dwell time. Passengers with under 45 minutes airside show transaction incidence 40–55% lower than those with 75–90 minutes. Each 10-minute drop below the 75-minute mark costs an estimated $4–$9 per passenger across the retail estate. This creates a revenue stream in redesigned shop-in-flow formats that embed retail in gate and lounge zones.
| Challenge | (~) % CAGR Friction Drag | Geographic Relevance | Mitigation Horizon |
|---|---|---|---|
| Passenger Dwell Time Compression & Airport Flow Optimization | -1.0% | Global — acute at congested European and U.S. hub airports with biometric/security upgrade backlogs | Long term (≥ 4 years) |
| Gray Market & Parallel Import Price Arbitrage Erosion | -0.8% | Asia-Pacific, Middle East, Eastern Europe — high duty differential markets | Long term (≥ 4 years) |
| Supply Chain Complexity for Exclusive Travel Retail SKU Management | -0.6% | Global — beauty, spirits, confectionery categories with travel retail-exclusive packaging | Medium term (2–4 years) |
| Sustainability Compliance for Single-Use & Luxury Packaging in Airport Retail | -0.4% | European Union, United Kingdom, Singapore, Australia | Medium term (2–4 years) |
| Staff Recruitment & Multilingual Service Capability Gap at Expanded Terminals | -0.3% | Europe, Middle East, Southeast Asia — markets with rapid terminal capacity additions | Medium term (2–4 years) |
Opportunities
Travel retail sits on rich passenger data yet has not built a scaled AI personalization layer linking pre-trip engagement to airport conversion. Market.us notes the dominant model in 2025 remains walk-in impulse buying with minimal digital pre-engagement. This gap leaves a high-value white space across the shopper journey. Operators who capture pre-trip intent will convert travelers before they reach the gate. Early movers gain durable advantage.
The unit economics justify the investment strongly. Reserve-and-collect pilots showed pre-committed digital shoppers spent 2.3–3.1× more per transaction, around $180–$310 versus $60–$110 for walk-in buyers, with gross margin 8–12 points higher. A full platform needs an estimated $20–$60 million in infrastructure and could lift per-passenger revenue 18–35%. This means early investors in personalization AI will define the next competitive frontier.
| Opportunity | (~) % Potential CAGR Upside | Geographic Relevance | Execution Window |
|---|---|---|---|
| Hyper-Personalized Digital Travel Retail Platform — AI-Driven Pre-Trip Engagement & In-Airport Conversion | +1.7% | Global — highest execution readiness in Europe, Middle East, Singapore, South Korea, China | Medium term (2–4 years) |
| Indian Outbound Traveler Segment Development as the Next High-Growth Travel Retail Buyer Cohort | +1.2% | India — Mumbai, Delhi, Bengaluru, Hyderabad international airports; Indian traveler spend at global hubs | Medium term (2–4 years) |
| Cruise Port & Non-Airport Travel Retail Channel Expansion as Underpenetrated Adjacent Vertical | +0.8% | Caribbean, Mediterranean, Southeast Asia, Alaska, Northern Europe cruise port corridors | Medium term (2–4 years) |
| Wellness, Nutraceutical & Functional Health Category Introduction as a High-Margin Emerging Travel Retail Segment | +0.6% | Asia-Pacific, Middle East, United States, Europe — premium wellness traveler demographic | Long term (≥ 4 years) |
| Local & Artisanal Brand Curation as a Differentiated Travel Retail Proposition vs. Global Duty-Free Homogenization | +0.3% | Japan, South Korea, India, Southeast Asia, Italy, France, Spain — strong regional provenance markets | Long term (≥ 4 years) |
Key Company Insights
Avolta AG holds a structural edge through global scale across airport and downtown concessions. As per our research, international passengers contribute 35%–45% of global airport retail spending, a pool Avolta captures through its hub network. In June 2026, Avolta secured a 10-year contract at Orlando International covering retail and food across more than 1,800 square meters. This reach protects volume, though rising concession fees pressure its margins.
Lotte Duty Free anchors its position in Asia-Pacific, the region where affluent travelers concentrate. As per our research, roughly 70% of airport purchases are impulse driven, which favors Lotte’s strong beauty and luxury displays. Average European per-passenger spend fell 0.3% in 2025 despite traffic gains, signaling a shared risk. This means Lotte must lift conversion through assortment to defend its regional advantage.
Key Players
- Avolta AG
- Lotte Duty Free
- The Shilla Duty Free
- China Duty Free Group
- Lagardère Travel Retail
- King Power International Group
- DFS Group
- Gebr. Heinemann
- Aer Rianta International
- Duty Free Americas
- Dubai Duty Free
- Flemingo International
- WHSmith plc
- SSP Group plc
- Shinsegae Duty Free
Recent Developments
- June 2026: Avolta announced an agreement to acquire 100% of DFS Okinawa from DFS Group, marking Avolta’s entry into the Japanese travel retail market through airport and downtown duty-free operations.
- January 2026: China Tourism Group Duty Free acquired DFS Group’s travel retail business and selected DFS brands and intellectual property in China, Hong Kong, and Macau, excluding the City of Dreams store, as part of DFS’s restructuring.
- September 2025: Avolta and King Power announced a strategic loyalty partnership, enabling reciprocal benefits between Club Avolta and King Power’s Power Pass loyalty programs across their travel retail networks.
Geopolitical Impact Analysis
Global trade tensions and shipping disruption raise costs for imported luxury and beauty goods that fill travel retail shelves. According to UNCTAD, container freight rates on key routes surged over 150% during Red Sea rerouting, adding 10 to 14 days of transit as vessels diverted around the Cape of Good Hope. This delay strains exclusive travel retail SKU replenishment. Operators face stockouts on high-margin fragrance and spirits during peak travel windows.
Tariff volatility and energy price swings further pressure sourcing for this market. Data from the WTO shows global merchandise trade growth slowed to around 2.7% amid rising protectionism, while the IEA reported oil price swings above 20% during regional conflict flare-ups. This raises air freight and packaging costs for perishable beauty lines. Consequently, operators must diversify suppliers and build regional stock buffers to protect margin and shelf availability.
Report Scope
| Report Features | Description |
|---|---|
| Market Value (2025) | USD 86.4 Billion |
| Forecast Revenue (2035) | USD 184.8 Billion |
| CAGR (2026-2035) | 8.0% |
| Base Year for Estimation | 2025 |
| Historic Period | 2020-2024 |
| Forecast Period | 2026-2035 |
| Report Coverage | Revenue Forecast, Market Dynamics, Market Opportunity Analysis, Technology and Innovation Landscape, Competitive Landscape, Recent Developments |
| Segments Covered | By Product Type (Beauty & Personal Care, Luxury Fashion & Accessories, Wines & Spirits, Tobacco Products, Confectionery & Fine Foods, Electronics & Gadgets, Jewelry & Watches), By Sales Channel (Airport Retail, Online Travel Retail, Airline Onboard Retail, Cruise Line Retail, Border Downtown & Duty-Free Stores), By Traveler Type (Leisure Travelers, Business Travelers, Group Tour Travelers, Transit Passengers), By Store Format (Duty-Free Stores, Duty-Paid Travel Retail Stores, Specialty Brand Boutiques, Convenience Stores), By Distribution Model (Direct Retail Operators, Omnichannel Retail, Franchise Operations, Third-Party Concessionaires), By Location (International Airports, Railway Stations, Seaports & Cruise Terminals, Border Crossings, Downtown Duty-Free Stores), By Customer Category (Premium & Luxury Shoppers, Millennials & Gen Z Travelers, Value-Oriented Shoppers, Corporate Travelers) |
| Regional Analysis | North America (US and Canada), Europe (Germany, France, The UK, Spain, Italy, and Rest of Europe), Asia Pacific (China, Japan, South Korea, India, Australia, and Rest of APAC), Latin America (Brazil, Mexico, and Rest of Latin America), Middle East and Africa (GCC, South Africa, and Rest of MEA) |
| Competitive Landscape | Avolta AG, Lotte Duty Free, The Shilla Duty Free, China Duty Free Group, Lagardère Travel Retail, King Power International Group, DFS Group, Gebr. Heinemann, Aer Rianta International, Duty Free Americas, Dubai Duty Free, Flemingo International, WHSmith plc, SSP Group plc, Shinsegae Duty Free |
| Customization Scope | Customization for segments, region / country-level will be provided. Additional customization can be done based on requirements. |
| Purchase Options | We have three licenses to opt for: Single User License | Multi-User License (Up to 5 Users) | Corporate Use License (Unlimited User and Printable PDF) |





































