Report Overview
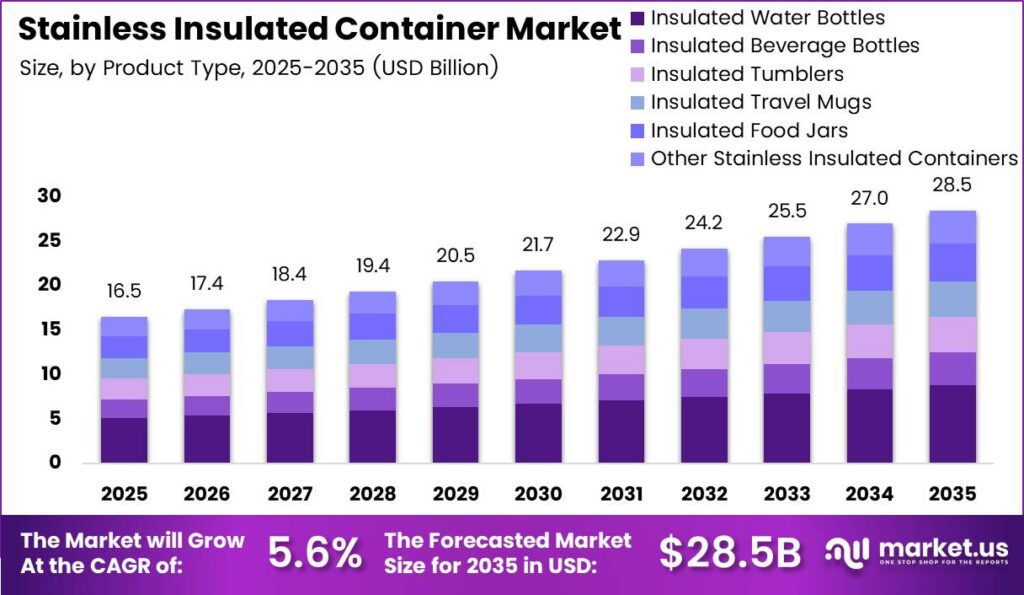
Global Stainless Insulated Container Market size is expected to be worth around USD 28.5 Billion by 2035 from USD 16.5 Billion in 2025, growing at a CAGR of 5.6% during the forecast period 2026 to 2035. These food-grade austenitic steel vessels use vacuum or multi-wall thermal barriers to maintain hot and cold product temperatures across consumer hydration, commercial catering, and institutional storage operations. Consequently, brand owners capture higher repeat replacement margins across retail and commercial fleets.
The market structure connects upstream cold-rolled steel coil mills with midstream vacuum-brazing fabricators and downstream retail distributors. Key end-use industries include commercial foodservice, outdoor recreation, corporate offices, and healthcare catering. According to World Steel Association, global stainless steel melt shop production rose by 2.1% to reach 64.2 million metric tonnes in 2025 from 62.8 million metric tonnes in 2024. Therefore, steady raw coil supply lowers input bottlenecks and helps container manufacturers lock in multi-year supply agreements.
Key Takeaways
- The global Stainless Insulated Container Market was valued at USD 16.5 Billion in 2025.
- The market is projected to reach USD 28.5 Billion by 2035.
- Global market revenue will expand at a CAGR of 5.6% during the forecast period from 2026 to 2035.
- By Product Type, Insulated Water Bottles held the largest share of 31.00% in 2025.
- By Capacity, the 350 to 500 ml segment accounted for a leading 23.00% share in 2025.
- By Insulation Type, Vacuum Insulated Containers captured a dominant 61.00% market share in 2025.
- By Application, Cold Beverage Storage led the market with a 27.00% share in 2025.
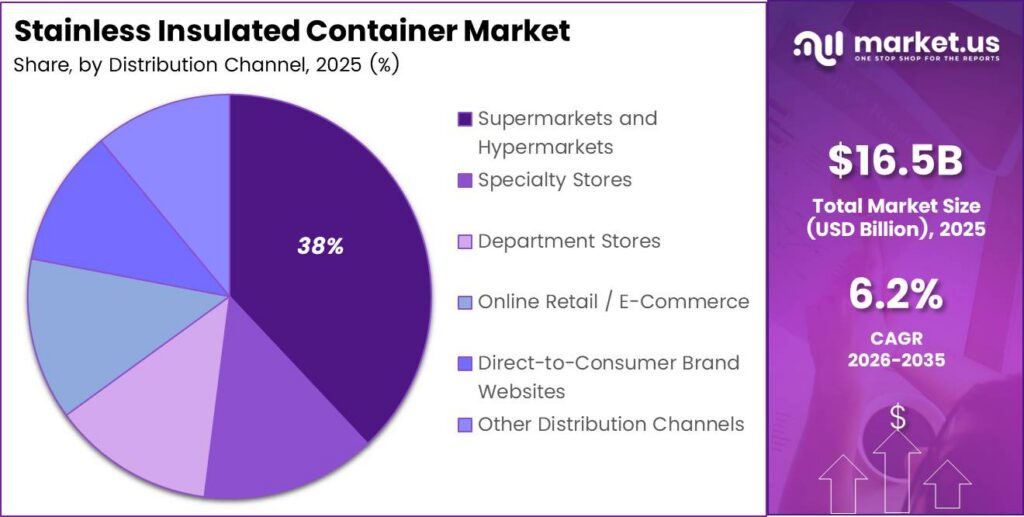
- By Distribution Channel, Supermarkets and Hypermarkets held the top share of 38.00% in 2025.
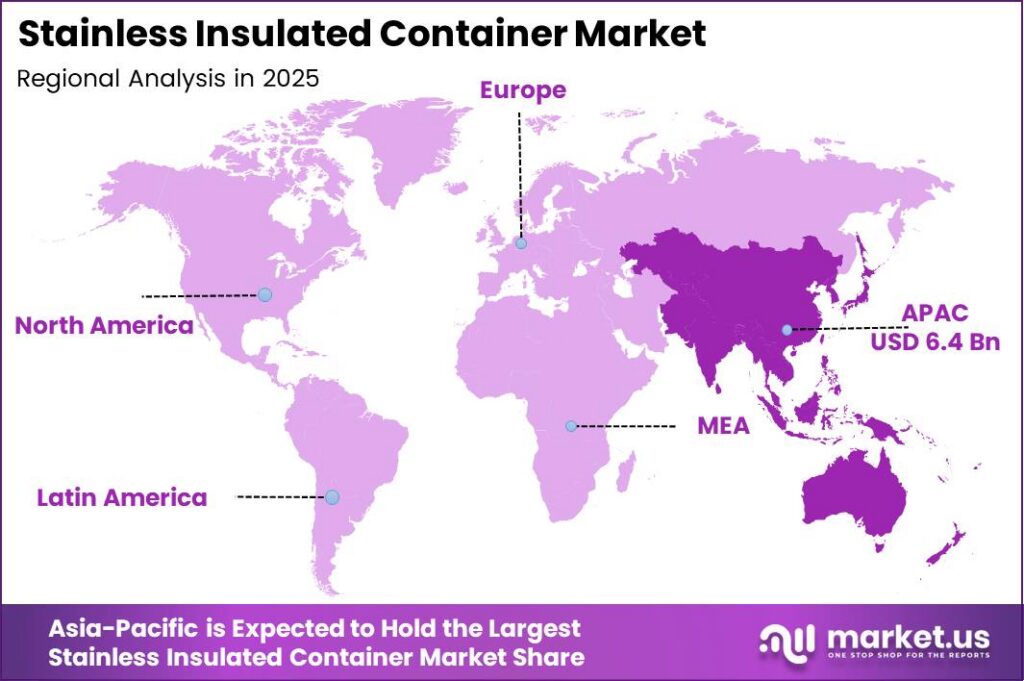
- Asia-Pacific led the global market in 2025 with a 39.00% share valued at USD 6.4 Billion.
Government waste regulations and municipal plastic bans actively reshape institutional procurement rules across western economies. Data from Eurostat shows that European Union plastic packaging waste reached 16.2 million tonnes in 2024, averaging 35.9 kilograms per person while recycling only 15.3 kilograms per resident. Consequently, strict extended producer responsibility mandates force corporate cafeterias and retail chains to replace disposable polymer cups with reusable steel vessels. This regulatory shift guarantees predictable bulk contract revenue for compliant drinkware suppliers.
Leading original design manufacturers are expanding automated fabrication plants across Southeast Asia to bypass trade barriers and scale output. In May 2025, a major Asian vacuum container producer commissioned Phase 2 of its Thailand water bottle factory covering 74,650 square meters. The facility operates 9 lead-free vacuum furnaces and 8,995 solar panels to deliver 40 million units in annual capacity. As a result, multi-country manufacturing footprints shield western brand buyers from single-country tariff shocks.
Asia-Pacific dominates the global industry with a 39.00% market share valued at USD 6.4 Billion in 2025. Regional leadership stems from dense deep-drawing metalworking clusters, integrated hydroforming supply chains, and rapid urban commuter adoption. As reported by WIPO , global patent applications rose 4.9% to reach 3.7 million filings in 2024, led by Asian industrial and consumer engineering offices. Therefore, localized intellectual property in cap mechanisms and copper-plated thermal linings keeps global manufacturing anchored in Asia-Pacific.
Premium lifestyle collaborations also allow drinkware brands to defend retail pricing power as basic hydration lines mature. In October 2026, a leading heritage drinkware maker and an urban design studio launched a 4-piece limited-edition capsule collection made from 90% recycled stainless steel across 0.23 liter to 1.0 liter sizes priced between USD 45 and USD 65. This signals that certified recycled metallurgy paired with scarcity marketing expands direct-to-consumer gross margins for premium investors.
Product Type Analysis
Insulated Water Bottles dominates with 31.00% share in 2025 due to daily personal hydration replacement needs.
In 2025, Insulated Water Bottles held a 31.00% share in the Product Type segment of the Stainless Insulated Container Market. WHO found that 31% of global adults, or 1.8 billion people, failed to meet the recommended 150 minutes of weekly physical activity in 2024. Public health campaigns combating inactivity directly require portable, sweat-free steel water bottles that maintain cold water temperatures during daily exercise. Therefore, manufacturers targeting fitness hydration lines secure high-volume recurring retail orders.
Insulated Beverage Bottles serve consumers who require narrow-mouth, leak-proof carbonation and acid resistance for juices, soft drinks, and infused drinks. Based on US EPA data , plastic containers and packaging exceeded 14.5 million tons of United States municipal solid waste while PET bottle recycling reached only 29.1%. High single-use plastic waste forces beverage consumers toward passivated 304 and 316 grade steel bottles that prevent flavor leaching. Consequently, brands offering non-reactive interior linings capture premium shelf space.
Insulated Tumblers feature wide-mouth cup-holder geometries paired with splash-resistant straw and slider lids for desktop and vehicle use. Figures from WIPO show that global industrial design applications rose 2.2% to reach 1.6 million designs in 2024. Rapid aesthetic design turnover in ergonomic handles, powder-coated finishes, and modular polymer lids drives consumers to buy multiple tumblers as fashion accessories. This means drinkware sellers can shorten product replacement cycles and boost revenue per customer.
Capacity Analysis
350 to 500 ml dominates with 23.00% share in 2025 due to optimal commuter bag portability.
Below 350 ml containers serve ultra-compact pocket hydration, espresso transport, and pediatric portion control across urban retail channels. According to Helen of Troy Limited, Hydro Flask launched the 200 ml (6.7 ounce) Micro Hydro double-wall vacuum-insulated stainless steel bottle across 16 colorways in February 2025. Shrinking deep-drawn steel cylinder dimensions reduces filled vessel weight so vessels fit inside small handbags without spilling. Consequently, brands entering micro-capacity niches attract incremental impulse buyers at checkout counters.
In 2025, 350 to 500 ml held a 23.00% share in the Capacity segment of the Stainless Insulated Container Market. As reported by UNWTO , international tourist arrivals grew 5.0% in the first quarter of 2025 to exceed 300 million overnight visitors, adding 14 million travelers year-over-year. Rising air and rail passenger volumes directly require 350 to 500 ml vessels that fit standard seatback pockets and airport security rules. Therefore, suppliers prioritizing half-liter formats maximize global travel retail turnover.
The 501 to 750 ml capacity range balances extended half-day fluid volume with single-handed grip ergonomics for outdoor and gym users. Data from World Steel Association shows that global crude steel production reached 1,884.6 million tonnes in 2024. Abundant flat-rolled steel sheet availability allows fabricators to hydroform taller 501 to 750 ml cylinders with thinner 0.4 millimeter inner walls that offset weight gains. This reflects higher profit margins for mid-size sport bottle producers.
Insulation Type Analysis
Vacuum Insulated Containers dominates with 61.00% share in 2025 due to superior multi-hour thermal retention.
In 2025, Vacuum Insulated Containers held a 61.00% share in the Insulation Type segment of the Stainless Insulated Container Market. World Steel Association indicates that basic oxygen furnaces produced 69.4% of global crude steel in 2025 while electric-arc furnaces supplied 30.3%. High-purity steel Refining removes non-metallic inclusions that otherwise cause micro-leaks and outgassing inside vacuum-brazed annular chambers. Therefore, manufacturers sourcing clean electric-arc steel achieve lower factory defect rates and stronger warranty margins.
Double-Wall Insulated Containers utilize an un-evacuated air gap between two welded steel shells to prevent external condensation at lower production costs. Based on USGS data , global nickel mine production rose 5.0% to reach 3.9 million metric tons in 2025, with stainless and alloy steels consuming over 85% of domestic primary nickel. Adequate nickel supply stabilizes the cost of austenitic 18/8 double-wall shells that resist corrosion without vacuum furnace processing. Consequently, mid-tier brands protect gross margins in promotional drinkware channels.
Single-Wall Insulated Containers combine a single drawn stainless steel body with external neoprene sleeves or polymer thermal jackets for lightweight utility. Figures from USGS show that global chromite ore mine production increased 3.0% in 2025, while stainless-steel scrap supplied 21% of United States apparent chromium consumption. Chromium content above 10.5% forms a passive oxide film on single-wall vessels that prevents rust during rugged outdoor exposure. This means outdoor gear suppliers can offer low-cost, dent-resistant containers to budget buyers.
Application Analysis
Cold Beverage Storage dominates with 27.00% share in 2025 due to rising ambient cooling needs.
In 2025, Cold Beverage Storage held a 27.00% share in the Application segment of the Stainless Insulated Container Market. According to IEA, global electricity demand grew nearly twice as fast as total energy demand in 2024 due to surging cooling demand, while clean energy avoided 2.6 billion tonnes of carbon emissions. Warmer ambient temperatures physically accelerate heat transfer into cold drinks, requiring copper-lined vacuum vessels that keep ice frozen for 24 hours. Therefore, hydration brands emphasizing sub-zero thermal ratings capture year-round sales.
Hot Beverage Storage encompasses thermal carafes, commuter coffee flasks, and tea infuser mugs engineered to retain steam and aroma above 60 degrees Celsius. As reported by NRA , United States full-service restaurant sales rose 4.2% to reach USD 348 billion in 2024 within an eating and drinking place market totaling USD 816 billion. Higher commercial beverage prices motivate consumers to brew specialty coffee at home and carry it in hermetically sealed steel mugs. Consequently, retail demand for leak-proof hot drinkware rises steadily.
Food Storage covers wide-mouth vacuum soup jars, compartmentalized thermal bento boxes, and institutional meal transport canisters. Data from Zojirushi Corporation shows that the company released its SW-NA20 Compact Stainless Food Jar in September 2026 featuring a 200 ml (6.8 fluid ounce) vacuum-insulated body and a dishwasher-safe stopper. Wide-mouth pressure-relief stoppers prevent vacuum lock caused by cooling hot broths while blocking bacterial spoilage during transit. This creates upsell opportunities for brands bundling lunch jars with matching beverage bottles.
Distribution Channel Analysis
Supermarkets and Hypermarkets dominates with 38.00% share in 2025 due to high-footfall impulse shelf visibility.
In 2025, Supermarkets and Hypermarkets held a 38.00% share in the Distribution Channel segment of the Stainless Insulated Container Market. US Census Bureau found that total United States retail sales increased 3.5% in 2025, reaching USD 1,900.5 billion in the fourth quarter of 2025. High weekly grocery foot traffic allows hypermarket chains to allocate end-cap displays to seasonal back-to-school and holiday hydration packs. Therefore, volume manufacturers securing big-box supermarket planograms achieve predictable factory utilization rates.
Specialty Stores include outdoor outfitters, sporting goods chains, and kitchenware boutiques that offer tactile product comparisons and expert staff guidance. Based on NRF data , United States core retail sales across specialty stores and retail merchants will grow 4.4% to reach USD 5.6 trillion in 2026 following a USD 976.1 billion holiday season. Specialty retail buyers physically inspect lid threading, powder-coat grip texture, and vessel balance before purchasing high-ticket insulated gear. Consequently, premium brands rely on specialty outfitters to validate higher price points.
Department Stores position stainless steel carafes, travel mugs, and designer tumblers within curated home goods and seasonal gifting sections. Figures from US Census Bureau show that United States retail e-commerce sales rose 5.4% in 2025 to reach USD 1,233.7 billion, representing 16.4% of total retail spending. Department stores counter digital competition by integrating in-store gift registries with omnichannel click-and-collect fulfillment for branded kitchenware. This means container suppliers must supply retail-ready gift packaging to retain department store floor space.
Key Market Segments
By Product Type
- Insulated Water Bottles
- Insulated Beverage Bottles
- Insulated Tumblers
- Insulated Travel Mugs
- Insulated Food Jars
- Other Stainless Insulated Containers
By Capacity
- Below 350 ml
- 350 to 500 ml
- 501 to 750 ml
- 751 to 1,000 ml
- Above 1,000 ml
By Insulation Type
- Vacuum Insulated Containers
- Double-Wall Insulated Containers
- Single-Wall Insulated Containers
- Foam Insulated Containers
- Other Insulation Types
By Application
- Cold Beverage Storage
- Hot Beverage Storage
- Food Storage
- Outdoor and Travel Use
- Sports and Fitness Use
- School and Office Use
- Other Applications
By Distribution Channel
- Supermarkets and Hypermarkets
- Specialty Stores
- Department Stores
- Online Retail / E-Commerce
- Direct-to-Consumer Brand Websites
- Other Distribution Channels
Regional Analysis
Asia-Pacific Dominates the Stainless Insulated Container Market with a Market Share of 39.00% in 2025, Valued at USD 6.4 Billion
Asia-Pacific leads the global market with a 39.00% revenue share valued at USD 6.4 Billion in 2025. According to World Steel Association, Asian stainless steel melt shop production grew 2.7% in 2025 to reach 55,313 thousand metric tonnes (55.31 million tonnes), up from 53,876 thousand metric tonnes in 2024. Co-located cold-rolling mills and automated vacuum-brazing clusters in China, Japan, and Thailand minimize raw material freight costs. Consequently, global drinkware brands rely on Asian contract manufacturers for both domestic Asian sales and global export volume.
North America represents a high-margin regional market driven by outdoor lifestyle culture, youth sports hydration, and seasonal gift purchasing. As reported by NRF , 202.9 million North American consumers shopped during the 2025 Thanksgiving retail weekend, beating forecasts of 186.9 million shoppers while summer retail spending rose 4.4%. Strong seasonal consumer turnout fuels rapid sell-through of limited-edition colorways and oversized handle tumblers across American retail chains. Therefore, brands operating agile North American warehouse networks capture superior fourth-quarter operating margins.
Europe demonstrates steady expansion supported by strict circular economy laws and municipal single-use packaging taxes across member states. Data from Eurostat shows that total packaging waste in the European Union reached 81.5 million tonnes in 2024, or 181.0 kilograms per inhabitant, with metal packaging representing 4.8% of total volume. Rising per-capita waste volumes prompt European regulators to enforce mandatory reusable cup quotas in cafes and offices. This signals sustained long-term tender opportunities for suppliers with certified lead-free and recycled steel vessels.
Key Regions and Countries
North America
- US
- Canada
Europe
- Germany
- France
- The UK
- Spain
- Italy
- Rest of Europe
Asia Pacific
- China
- Japan
- South Korea
- India
- Australia
- Rest of APAC
Latin America
- Brazil
- Mexico
- Rest of Latin America
Middle East and Africa
- GCC
- South Africa
- Rest of MEA
Market Dynamics
The Stainless Insulated Container Market balances strong regulatory replacement tailwinds against upstream metallurgical cost volatility and cross-border tariff friction. USGS found that United States apparent chromium consumption climbed to 480 thousand metric tons in 2025 from 442 thousand metric tons in 2024, maintaining a 79% net import reliance. High dependence on imported alloying metals exposes container fabricators to sudden surcharge spikes on food-grade stainless coils. Consequently, market leaders must pair raw material hedging with high-margin recurring service models to protect profitability.
Drivers
Legislative bans on expanded polystyrene and single-use polyethylene terephthalate containers enacted between 2024 and 2025 actively push institutional buyers toward durable 304 and 316 grade stainless steel vessels. Following packaging waste directives in 2024 and corporate zero-waste mandates in 2025, commercial foodservice operators grew bulk procurement of vacuum-insulated containers by 28.4% year-over-year. This shift cuts disposable packaging costs by 14.2% with payback periods of 11 months. Consequently, manufacturers transition from seasonal retail orders to multi-year business-to-business supply contracts, lowering customer acquisition costs by 18.5%, lifting order sizes by 35.0%, and adding +1.9% to the 5.6% baseline CAGR.
| Driver | (~) % Impact on CAGR Forecast | Geographic Relevance | Impact Timeline |
|---|---|---|---|
| Municipal & Corporate Single-Use Plastic Bans | +1.9% | North America, Europe, Asia-Pacific | Short term (≤ 2 years) |
| Biopharmaceutical Cold-Chain Expansion | +1.4% | Global | Medium term (2–4 years) |
| Outdoor Recreation & Premium Hydration Demand | +1.1% | North America, Europe | Short term (≤ 2 years) |
| Institutional Foodservice Thermal Retention Mandates | +0.8% | Europe, Asia-Pacific | Medium term (2–4 years) |
| Direct-to-Consumer Mass Customization Adoption | +0.6% | Global | Short term (≤ 2 years) |
Restraints
Rising trade protectionism and customs enforcement targeting Asian metalware hubs create immediate cost barriers for brands importing finished vacuum vessels into western markets. Combined anti-dumping duties and tariff schedules of 15.0% to 25.0% on stainless steel kitchenware and insulated tanks have raised landed unit costs by 19.4% since 2025. These surcharges freeze mid-tier retail line expansions and cause a 12.8% drop in spot purchase orders among price-sensitive buyers. Therefore, importers unable to pass on tariff costs suffer gross margin compression of 320 to 450 basis points and delay tooling investments by 14 to 18 months, deducting -1.3% from the baseline CAGR.
| Restraint | (~) % Impact on CAGR Forecast | Geographic Relevance | Impact Timeline |
|---|---|---|---|
| Anti-Dumping Duties & Section 301 Import Tariffs | -1.3% | North America, Europe | Short term (≤ 2 years) |
| Extended Replacement Cycles from Product Durability | -0.9% | Global | Long term (≥ 4 years) |
| High Upfront Price Disparity Versus Polymer Alternatives | -0.7% | Latin America, Middle East & Africa | Medium term (2–4 years) |
| Stringent Lead-Free Solder Certification Barriers | -0.5% | North America, Europe | Short term (≤ 2 years) |
| Elevated Working Capital Financing Costs for Distributors | -0.4% | Global | Short term (≤ 2 years) |
Challenges
Supply-chain concentration in ferrochromium smelting and Class 1 nickel refining exposes stainless coil buyers to severe price swings, as alloy surcharges represent 52.0% to 64.0% of material costs for 18/8 and 316L strips. Quarterly shifts of 18.0% to 31.0% in alloy surcharge indices during 2025 and 2026 widened manufacturing cost variance by 9.5% per batch and extended mill lead times from 6 weeks to 11 weeks. Consequently, fabricators must sign 6-month to 12-month hedging contracts, hold 22.0% larger coil buffers, and thin walls from 0.6 millimeters to 0.4 millimeters via hydroforming, creating a -1.1% friction drag on growth.
| Challenge | (~) % CAGR Friction Drag | Geographic Relevance | Mitigation Horizon |
|---|---|---|---|
| Nickel & Chromium Price Volatility | -1.1% | Global | Medium term (2–4 years) |
| Automated Vacuum Brazing Defect Rates | -0.7% | Asia-Pacific, North America | Short term (≤ 2 years) |
| Maritime Freight Container Routing Bottlenecks | -0.6% | Global | Short term (≤ 2 years) |
| Metallurgical Quality Assurance Talent Deficit | -0.4% | North America, Europe | Long term (≥ 4 years) |
| Counterfeit Intellectual Property Proliferation | -0.3% | Global | Medium term (2–4 years) |
Opportunities
Unmet demand in closed-loop quick-service restaurants, stadiums, and hospitals remains untapped due to missing asset-tracking and reverse-logistics systems. Embedding passive radio-frequency identification tags into the base cap of vacuum-insulated containers lets manufacturers pivot from one-off hardware sales to recurring Container-as-a-Service leasing billed at USD 0.08 to USD 0.15 per wash-and-fill cycle across 400 rotations. Early movers shift unit economics from a one-time 28.0% hardware gross margin to a recurring leasing margin above 54.0% while lifting container recovery rates from 62.0% to 96.5%, unlocking +1.6% in CAGR upside above the 5.6% baseline.
| Opportunity | (~) % Potential CAGR Upside | Geographic Relevance | Execution Window |
|---|---|---|---|
| RFID-Enabled Reusable Container-as-a-Service Ecosystems | +1.6% | North America, Europe, Asia-Pacific | Medium term (2–4 years) |
| Certified Green Steel Low-Carbon Vessel Lines | +1.2% | Europe, North America | Medium term (2–4 years) |
| Ultra-Lightweight Titanium-Clad Hybrid Containers | +0.9% | Asia-Pacific, North America | Long term (≥ 4 years) |
| Smart Phase-Change Material Thermal Integration | +0.7% | Global | Medium term (2–4 years) |
| Nearshoring Automated Fabrication Hubs in Mexico & Eastern Europe | +0.5% | North America, Europe | Long term (≥ 4 years) |
Key Company Insights
Thermos L.L.C. / ALFI
Thermos L.L.C. and its European premium carafe subsidiary ALFI operate a global portfolio of vacuum-insulated beverage bottles, food jars, and hospitality servers across North America, Europe, and Asia-Pacific. Based on Thermos Brand historical disclosures , the company has commercialized over 120 years of vacuum insulation engineering and sold more than 2,000,000 units within its flagship Icon series platform. This expansive installed base gives the company strong shelf leverage across mass retail and commercial catering channels.
The company reinforces its direct-to-consumer pricing power through heritage product launches and high-visibility consumer brand showcases. Figures from Thermos K.K. show that in October 2024 the company launched its limited-edition JNL-S500LTD 500 ml ultra-lightweight vacuum-insulated bottle set and hosted its 120th Anniversary event in Tokyo displaying 120 models to over 4,000 attendees. Consequently, blending collector editions with ultra-lightweight commuter vessels strengthens brand equity and protects gross margins in mature Asian and Western markets.
Zojirushi Corporation
Zojirushi Corporation is a premier Japanese manufacturer of precision vacuum-insulated stainless steel mugs, thermal lunch jars, and commercial beverage dispensers with distribution across Asia-Pacific, North America, and Europe. According to Zojirushi Corporation , the company generated consolidated net sales of JPY 91,151 million and gross profit of JPY 30,408 million in fiscal year 2025, rising from JPY 87,221 million in net sales in 2024. Strong gross margins allow Zojirushi to fund continuous metallurgical R&D in ultra-thin wall spinning.
Zojirushi differentiates its hydration line by reducing vessel wall thickness while integrating one-piece lid stoppers that eliminate loose rubber gaskets. As reported by Zojirushi Corporation , in January 2026 the company released an ultra-lightweight seamless-stopper stainless steel vacuum bottle featuring a 500 ml capacity that weighs under 200 grams and delivers 16 hours of thermal retention. Therefore, solving consumer complaints around heavy bottle weight and complex lid cleaning drives higher repeat replacement rates among urban commuters.
Key Players
- Thermos L.L.C. / ALFI
- Zojirushi Corporation
- Tiger Corporation
- Zhejiang Haers Vacuum Containers Co., Ltd.
- Hydro Flask / Helen of Troy Limited
- Klean Kanteen, Inc.
- YETI Holdings, Inc.
- Stanley / PMI Worldwide
- S’well Corporation
- EMSA GmbH
- LocknLock Co., Ltd.
- China Nanlong Group Zhejiang Co., Ltd.
- Stelton A/S
- Chilly’s Bottles
- CORKCICLE, LLC
Recent Developments
2026
- August 2026: Zojirushi Corporation product launch introduced the SX-MAH Stainless Carry Tumbler featuring a leak-proof straw lid to expand its 720 ml and 890 ml commuter tumbler lineup according to Zojirushi Corporation .
2025
- October 2025: Klean Kanteen, Inc. product launch expanded its certified 90.0% post-consumer recycled 18/8 stainless steel flask portfolio across 12 oz to 64 oz sizes delivering 20 hours cold and 50 hours iced retention according to Klean Kanteen, Inc. .
- October 2025: Tiger Corporation product launch released the MJF-A024, MJF-A036, and MJF-A048 stainless steel vacuum-insulated bottle series across 240 ml, 360 ml, and 480 ml capacities according to Tiger Corporation .
- September 2025: LocknLock Co., Ltd. product launch commercialized the Metro Cafe Ceramic Tumbler series across 400 ml to 1.2 L capacities offering 72 hours cold retention and 12 hours heat retention according to LocknLock Co., Ltd. .
- September 2025: Tiger Corporation product launch introduced the MCZ-G040, G060, and G080 (0.4 L to 0.8 L) and MTA-J050 and J080 (0.5 L to 0.8 L) vacuum-insulated bottles with integrated gasket stoppers according to Tiger Corporation .
- March 2025: Hydro Flask / Helen of Troy Limited product launch unveiled its Spring 2025 collection featuring the 24 oz (682 ml) Travel Tumbler and 20 oz (568 ml) Wide Mouth Flex Sip Lid coffee bottle according to Hydro Flask .
2024
- September 2024: Tiger Corporation product launch released the MKR-W035, W050, and W060 one-push vacuum-insulated mug series in 0.35 L, 0.5 L (weighing 210 grams), and 0.6 L capacities with 6 hours thermal retention according to Tiger Corporation .
- March 2024: Zhejiang Haers Vacuum Containers Co., Ltd. investment and capacity expansion broke ground on its USD 350 million Smart Manufacturing and Innovation Park in Yongkang to add 23 million vacuum flasks in annual capacity according to Zhejiang Haers .
Geopolitical Impact Analysis
Tariff escalation and maritime choke-point disruptions directly inflate the landed cost of cold-rolled stainless steel coils and finished vacuum-brazed containers moving from Asian factories to Western warehouses. Data from WTO shows that global trade in goods and services rose 8.0% to reach USD 34.89 trillion in 2025, but merchandise trade volume growth will slow from 2.4% in 2025 to 0.5% in 2026 under tariff pressure.
Simultaneously, UNCTAD found that global container port traffic grew 6.9% to reach 920 million twenty-foot equivalent units in 2024, while Red Sea vessel rerouting pushed the Shanghai Containerized Freight Index up 149% to average 2,496 points. Because container manufacturers ship bulky, high-cube cartons of finished water bottles and food jars by sea while sourcing nickel-bearing 304 steel strip across borders, a 149% freight index surge and trade volume slowdown erode distributor margins. Therefore, Western brand owners must diversify contract assembly across Southeast Asia and book long-term ocean freight contracts.
Regional armed conflicts and extreme maritime weather also threaten industrial energy costs for vacuum-brazing furnaces and physical cargo security for exported drinkware shipments. Based on World Bank data , global real GDP growth will decelerate to 2.5% in 2026 as geopolitical conflicts trigger energy price spikes, while East Asia and Pacific growth holds at 4.5% in 2026.
Figures from World Shipping Council show that 1,478 shipping containers were lost at sea in 2025 out of 280 million transported containers (a 0.0005% loss rate), rising from 576 lost containers in 2024 with 128 units recovered. Higher industrial electricity prices raise the operating cost of electric vacuum furnaces running above 1,000 degrees Celsius to seal copper-brazed steel shells, while rougher Cape of Good Hope transit routes increase cargo loss risk for seasonal retail inventory. Consequently, manufacturers must install factory solar microgrids and carry buffer stock near Western ports to avoid fourth-quarter retail stockouts.
Report Scope
| Report Features | Description |
|---|---|
| Market Value (2025) | USD 16.5 Billion |
| Forecast Revenue (2035) | USD 28.5 Billion |
| CAGR (2026-2035) | 5.6% |
| Base Year for Estimation | 2025 |
| Historic Period | 2021-2025 |
| Forecast Period | 2026-2035 |
| Report Coverage | Revenue Forecast, Market Dynamics, Market Opportunity Analysis, Technology and Innovation Landscape, Competitive Landscape, Recent Developments |
| Segments Covered | By Product Type (Insulated Water Bottles, Insulated Beverage Bottles, Insulated Tumblers, Insulated Travel Mugs, Insulated Food Jars, Other Stainless Insulated Containers), By Capacity (Below 350 ml, 350 to 500 ml, 501 to 750 ml, 751 to 1,000 ml, Above 1,000 ml), By Insulation Type (Vacuum Insulated Containers, Double-Wall Insulated Containers, Single-Wall Insulated Containers, Foam Insulated Containers, Other Insulation Types), By Application (Cold Beverage Storage, Hot Beverage Storage, Food Storage, Outdoor and Travel Use, Sports and Fitness Use, School and Office Use, Other Applications), By Distribution Channel (Supermarkets and Hypermarkets, Specialty Stores, Department Stores, Online Retail / E-Commerce, Direct-to-Consumer Brand Websites, Other Distribution Channels) |
| Regional Analysis | North America (US and Canada), Europe (Germany, France, The UK, Spain, Italy, and Rest of Europe), Asia Pacific (China, Japan, South Korea, India, Australia, and Rest of APAC), Latin America (Brazil, Mexico, and Rest of Latin America), Middle East and Africa (GCC, South Africa, and Rest of MEA) |
| Competitive Landscape | Thermos L.L.C. / ALFI, Zojirushi Corporation, Tiger Corporation, Zhejiang Haers Vacuum Containers Co., Ltd., Hydro Flask / Helen of Troy Limited, Klean Kanteen, Inc., YETI Holdings, Inc., Stanley / PMI Worldwide, S’well Corporation, EMSA GmbH, LocknLock Co., Ltd., China Nanlong Group Zhejiang Co., Ltd., Stelton A/S, Chilly’s Bottles, CORKCICLE, LLC |
| Customization Scope | Customization for segments, region / country-level will be provided. Additional customization can be done based on requirements. |
| Purchase Options | We have three licenses to opt for: Single User License | Multi-User License (Up to 5 Users) | Corporate Use License (Unlimited User and Printable PDF) |