
Global Shore Power Market By Type (Shoreside, Shipside), By Component (Transformers, Switchgear Devices, Frequency Converters, Cables And Accessories, Others), By Power Rating (Up to 30 MV, 30 to 60 MVA, Above 60 MVA), By Connection (New Installation, Retrofit) , By Region and Companies - Industry Segment Outlook, Market Assessment, Competition Scenario, Trends and Forecast 2025-2034
- Published date: Feb 2026
- Report ID: 177379
- Number of Pages: 226
- Format:
-
keyboard_arrow_up
Quick Navigation
Report Overview
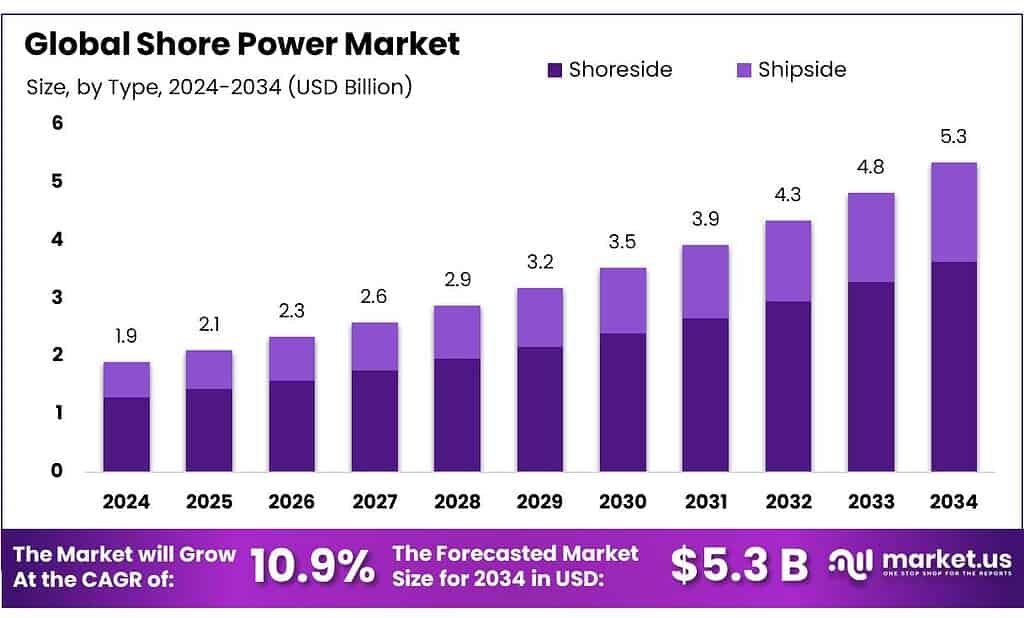
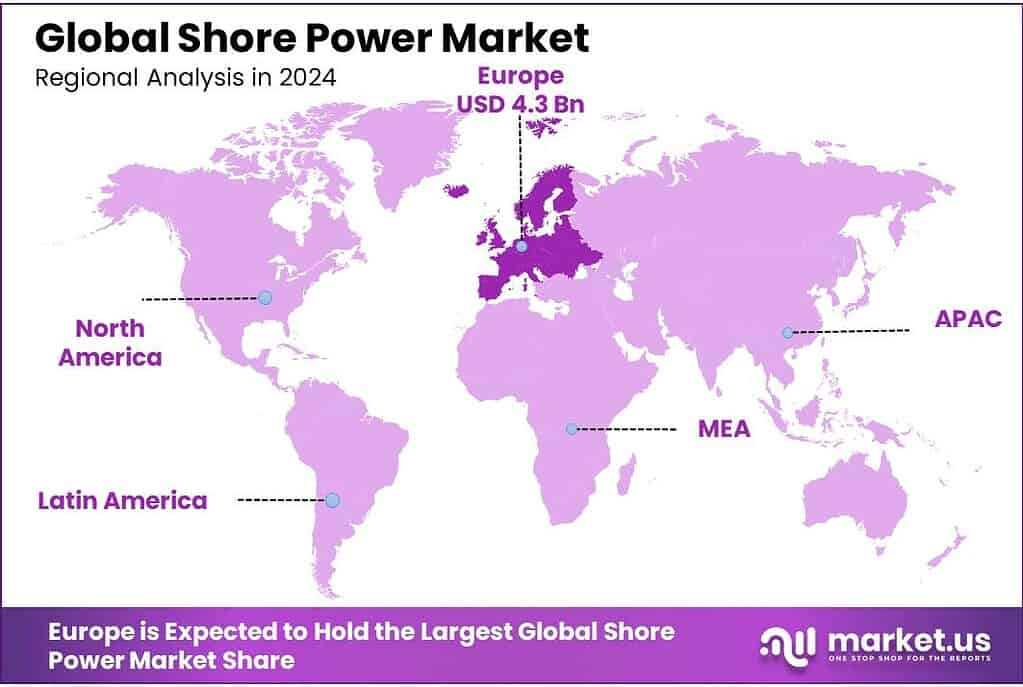
The Global Shore Power Market is expected to be worth around USD 5.3 Billion by 2034, up from USD 1.9 Billion in 2024, and is projected to grow at a CAGR of 10.9% from 2025 to 2034. The Europe segment maintained 39.8%, supporting a Shore Power value of USD 4.3 Bn.
Shore power is the practice of plugging a vessel into the local electricity grid while it is alongside, so onboard auxiliary engines can be switched off. In market terms, it sits at the intersection of port electrification, grid infrastructure, and maritime decarbonization—because it targets a highly visible emissions hotspot: ships “hoteling” at berth near dense coastal communities.
- A large-scale European assessment of major ports estimated that shore-side electricity could cut shipping CO₂ by about 5 million tonnes per year and avoid roughly 86,430 t NOx, 4,130 t SOx, and 1,600 t PM annually, while adding about 6.4 TWh of electricity demand.
Industrial deployment is now being shaped less by “pilot appetite” and more by policy deadlines and grid-readiness. In the European Union, the regulatory direction is toward mandatory availability and use: summaries of the Alternative Fuels Infrastructure Regulation (AFIR) pathway highlight shore-side electricity expectations for major ports by 2030, including capacity planning intended to satisfy up to 90% of demand where conditions apply.
However, implementation pace is uneven: a 2025 assessment commissioned by Transport & Environment and reported by Reuters found only 20% of required onshore power connections installed or contracted across 31 European ports; cruise/passenger progress was 38%, while container shipping lagged at 11% of 294 required connections. In the U.S., regulation is also tightening at the state level: California’s At-Berth requirements began in 2023 for container, passenger, and refrigerated cargo vessels, expanded in 2025 for ro-ro and certain tanker calls, and extend to remaining tanker vessels by January 1, 2027.
Demand drivers combine compliance, health, and supply-chain resilience—especially where food logistics depend on port performance. FAO estimates world trade in fish and fisheries products at 65 million tonnes in 2023, valued at USD 175 billion, underscoring how heavily food value chains rely on reliable port operations. FAO also reports total fisheries and aquaculture production reached 223.2 million tonnes in 2022, reinforcing continued throughput pressure on coastal infrastructure. As cold-chain cargo grows, UNCTAD notes the global reefer container fleet exceeded 4 million TEUs by end-2023, which increases the commercial incentive to reduce at-berth idling while maintaining stable power for temperature-controlled loads.
Regulation, the business case is reinforced by quantifiable emissions benefits. An ICCT screening paper summarizes port studies showing that shore power at Savannah’s Garden City Terminal could cut containership NOx by 98%, PM2.5 by 53%, and CO₂ by 32% versus onboard generation, illustrating why communities, regulators, and port authorities are aligning behind OPS as a near-term impact lever.
Key Takeaways
- Shore Power Market is expected to be worth around USD 5.3 Billion by 2034, up from USD 1.9 Billion in 2024, and is projected to grow at a CAGR of 10.9%.
- Shoreside held a dominant market position, capturing more than a 68.2% share.
- Switchgear Devices held a dominant market position, capturing more than a 29.7% share.
- Up to 30 MV held a dominant market position, capturing more than a 44.6% share.
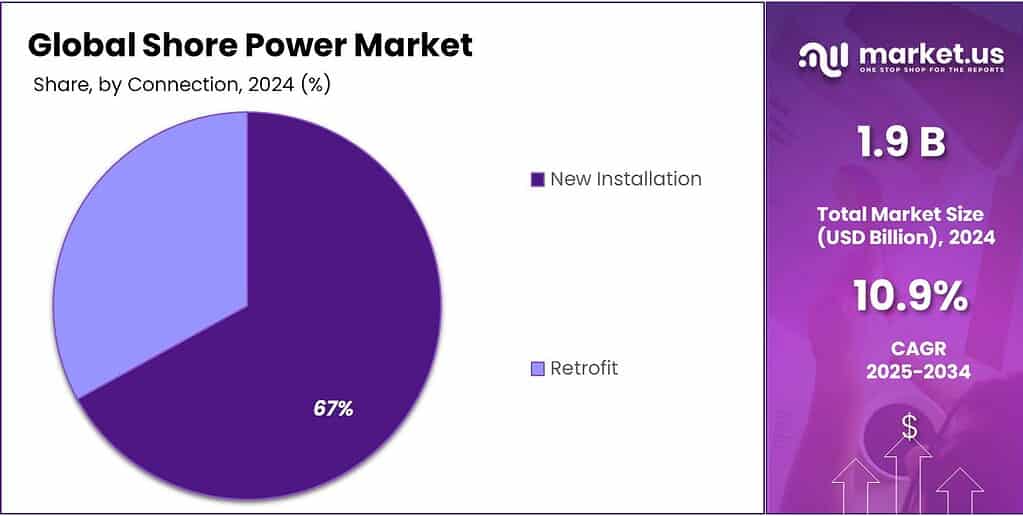
- New Installation held a dominant market position, capturing more than a 67.9% share.
- Europe remains the dominating region in the Shore Power market, holding 39.8% share and reaching USD 4.3 Bn.
By Type Analysis
Shoreside systems lead the market with a strong 68.2% adoption rate in 2024.
In 2024, Shoreside held a dominant market position, capturing more than a 68.2% share, reflecting its growing acceptance as the preferred solution for reducing emissions from vessels at berth. Ports across North America, Europe, and Asia continued expanding grid-connected onshore power supply because it delivers immediate air-quality benefits and aligns with tightening environmental rules.
The rise in container, cruise, and Ro-Ro vessel traffic encouraged ports to prioritize shoreside electrification, as it offers predictable operational efficiency and helps meet national clean-energy targets. By 2025, adoption is expected to expand further as more major ports integrate high-voltage connection systems into their infrastructure upgrade plans.
By Component Analysis
Switchgear Devices lead the segment with a solid 29.7% share in 2024 due to their critical role in power safety and control.
In 2024, Switchgear Devices held a dominant market position, capturing more than a 29.7% share, mainly because ports rely heavily on safe, stable, and well-managed electrical distribution when supplying power to berthed vessels. As shore power systems continue expanding across major commercial ports, the need for reliable switching, protection, and fault-handling equipment has increased sharply.
Switchgear forms the backbone of high-voltage shore connection infrastructure, ensuring smooth power transfer between the local grid and the vessel without interruptions, overloads, or safety risks, which is why port authorities prioritize this component during modernization projects.
By Power Rating Analysis
Up to 30 MV leads the power rating segment with a strong 44.6% share in 2024, driven by broad port compatibility and cost-efficient deployment.
In 2024, Up to 30 MV held a dominant market position, capturing more than a 44.6% share, mainly because this power range fits the operational needs of most commercial ports and common vessel categories such as container ships, ferries, Ro-Ro vessels, and coastal cargo fleets. Ports prefer this rating due to its balance of capacity, safety, and installation cost, making it the most practical choice for early and mid-stage shore power projects. Many ports integrating grid-connected systems find that up to 30 MV provides sufficient supply for emissions-free operations while keeping electrical infrastructure upgrades manageable.
By Connection Analysis
New Installation dominates the market with a strong 67.9% share in 2024, supported by global port electrification programs.
In 2024, New Installation held a dominant market position, capturing more than a 67.9% share, as ports worldwide continued investing in fresh shore power infrastructure to meet tightening environmental and operational requirements. Most major ports are prioritizing new-build OPS systems rather than retrofitting older setups, mainly because modern high-voltage connections, automated cable management systems, and digital monitoring tools demand fully upgraded electrical layouts. This shift reflects the broader industry movement toward long-term sustainability planning, where ports aim to comply with future emissions rules rather than making short-term adjustments.
Key Market Segments
By Type
- Shoreside
- Shipside
By Component
- Transformers
- Switchgear Devices
- Frequency Converters
- Cables & Accessories
- Others
By Power Rating
- Up to 30 MV
- 30 to 60 MVA
- Above 60 MVA
By Connection
- New Installation
- Retrofit
Emerging Trends
Shore power is shifting fast from pilot projects to mandate-led rollouts with standardised, “plug-and-play” connections
A clear latest trend in shore power is that ports are moving away from small, one-off demonstrations and into deadline-driven, standardised deployments that are designed to work across ship types and terminals with fewer operational surprises. This change is being pushed by regulation, not marketing. In Europe, the policy signal is now explicit: the European Commission states that passenger and container ships at berth must use on-shore power supply (OPS) or another zero-emission solution from 1 January 2030 in EU ports covered by AFIR, and from 1 January 2035 in all EU ports equipped with OPS facilities.
This trend is also getting sharper due to how regulators focus on the vessels that matter most. The European Commission’s FuelEU Maritime page highlights that vessels above 5,000 gross tonnes represent about 55% of all ships but account for roughly 90% of CO₂ emissions from the maritime sector. This is one reason the rules concentrate on large passenger and container vessels first: ports can capture a large share of emissions reduction by electrifying the berths used by the biggest, most frequent callers. Lloyd’s Register also summarizes the FuelEU direction as a “zero emissions at berth from 2030” requirement for >5,000 GT container and passenger vessels, with OPS as the default pathway unless a true zero-emission alternative is used.
A second part of the same trend is interoperability and standards becoming non-negotiable. As shore power scales, ports are choosing equipment and layouts that follow internationally recognised technical standards so that ships can connect in different countries without custom work each time. India is a good example of a government taking a standards-first approach: the Directorate General of Shipping’s Circular (Engineering) No. 09 of 2025 references the IEC/IEEE 80005 series as the recommended technical basis for shore-to-ship power supply systems at ports and ships.
Drivers
Regulation-led port electrification is the biggest driver, pushing shore power from “nice to have” into must build infrastructure in 2024–2025
One major driving factor for shore power is the way regulation and public-health policy are now forcing real investment decisions at ports, instead of leaving electrification to voluntary sustainability plans. In 2024–2025, shore power is increasingly treated as core port infrastructure because authorities want ships to stop running auxiliary engines while alongside, cutting local air pollution in dense coastal cities and industrial zones. This driver is not abstract: it is tied to clear deadlines, compliance checks, and funding programs that ports can actually budget against.
In Europe, the push is structural. The European Commission has stated that ports covered by the Alternative Fuels Infrastructure Regulation will require the use of on-shore power supply (OPS) or other zero-emission technologies from 1 January 2030, with the requirement expanding from 1 January 2035 in all EU ports equipped with OPS facilities. Complementing this, IMO’s GreenVoyage2050 summary of the EU framework highlights a practical performance expectation: TEN-T ports must be able to provide shore-side electricity for at least 90% of port calls by qualifying passenger and container ships from 2030, extending more broadly from 2035.
In the United States, the same driver shows up as “policy + money.” The U.S. EPA’s Clean Ports Program awards page notes 53 projects totaling nearly $3 billion, spread across 26 states and territories, with implementation typically over the next three to four years.
This policy pressure links directly to food and essential-goods supply chains, which is often overlooked. UNCTAD notes that over 80% of world trade volume is carried by sea, and disruptions at chokepoints have “profound impacts on food security.” FAO-linked research on shipping cost shocks similarly points out that more than 80% of global trade in grains and oilseeds occurs by sea—meaning port performance and near-port operating conditions matter for staple food flows.
Restraints
High upfront infrastructure costs remain the biggest restraint, slowing shore-power adoption even as regulations tighten
One major restraining factor for shore power is the very high upfront investment cost, which continues to slow adoption even in ports that fully understand the environmental and health benefits. Unlike many smaller sustainability upgrades, shore power requires deep electrical integration—new substations, high-voltage switchgear, cable management cranes, grid reinforcement, and vessel-side compatibility. Because this cost must often be paid before any real benefits are seen, many ports delay projects, phase construction slowly, or wait for grants that may not arrive in time.
In Europe, the challenge is highly visible. The European Sea Ports Organisation has repeatedly stressed that ports face a heavy financial burden to meet upcoming mandates, and the European Commission notes that full compliance with new OPS rules beginning 1 January 2030 will require large-scale capital spending. Although EU policy sets clear deadlines, it does not always guarantee full funding, leaving many ports to bridge the financial gap using local budgets or debt—both difficult options in smaller economies.
In the United States, financial gaps are partly addressed through federal programs, but not fully resolved. The U.S. EPA’s Clean Ports Program lists 53 funded projects worth nearly $3 billion, spread across 26 states and territories, yet demand exceeds available funding significantly. For many medium and small ports—those crucial for regional food imports and coastal distribution networks—the cost of installing high-voltage shore power still outweighs their revenue base. These ports often operate older electrical systems and lack the grid strength needed for OPS, leading to further expenditures for utility upgrades before shore power can even be considered.
Opportunity
Cold-chain and staple-food shipping lanes create a big shore-power growth opportunity as ports electrify for 2030–2035 compliance
A major growth opportunity for shore power is the electrification of high-volume “food logistics” ports—places that handle containerized groceries, refrigerated cargo, grains, edible oils, and other essentials on predictable schedules. The logic is simple: food supply chains need reliable port calls, and ports under pressure to reduce emissions can get fast wins by targeting vessels that visit often and stay long enough at berth to justify plugging in. This is becoming more attractive in 2024–2025 because regulators are setting deadlines and governments are putting real money behind port clean-air upgrades, which turns shore power from a niche feature into a mainstream procurement category.
The scale of the food-linked shipping base is huge, which creates a steady runway for shore-power deployments. UNCTAD notes that over 80% of world trade volume is carried by sea, and it flags that shocks to maritime routes and costs have “profound impacts on food security.” For staple commodities specifically, an OECD food and agriculture paper states that more than 80% of global trade in grains and oilseeds occurs by maritime transport—meaning grain and oilseed flows depend on ports that can keep operations smooth while meeting tougher environmental rules.
Policy is what makes this opportunity investable. In the EU, the European Commission has stated that passenger and container ships at berth must use on-shore power supply (OPS) or another zero-emission solution from 1 January 2030 in ports covered by AFIR, and from 1 January 2035 in all EU ports equipped with OPS facilities. That timeline is effectively a demand calendar for equipment, engineering, and grid services—especially at container terminals that also carry large volumes of food in reefer containers. In the U.S., growth is being pulled forward by funding: the EPA reports 53 projects totaling nearly $3 billion under the Clean Ports Program across 26 states and territories, with implementation over the next three to four years.
What makes the food angle especially compelling is that trade volumes are still expected to rise, not fall. UNCTAD expects maritime trade to grow by an average 2.4% annually between 2025 and 2029, which implies more vessel calls, more berth time, and more pressure on ports to decarbonize without disrupting essential imports. As volumes rise, ports that electrify early can create “OPS-ready” berths that attract long-term service agreements from carriers serving grocery and agriculture customers, because predictable, compliant port calls reduce operational risk.
Regional Insights
Europe leads the Shore Power market with a 39.8% share, supported by large-scale port rules and funding momentum worth USD 4.3 Bn.
Europe remains the dominating region in the Shore Power market, holding 39.8% share and reaching USD 4.3 Bn, largely because the region has turned shore power from a sustainability option into a compliance requirement. A key support is the EU’s rule pathway: the European Commission confirms that passenger and container ships at berth must use on-shore power supply (OPS) or other zero-emission technologies from 1 January 2030 in EU ports covered by the Alternative Fuels Infrastructure Regulation (AFIR), and from 1 January 2035 in all EU ports equipped with OPS facilities.
Europe’s lead is also reinforced by corridor-focused requirements. IMO’s GreenVoyage2050 notes that under FuelEU Maritime, seagoing passenger and container ships above 5,000 GT must use OPS (or an alternative zero-emission option) from 2030 when berthed for more than two hours in a TEN-T port, with expansion to all EU ports from 2035. This policy design concentrates early demand in the busiest hubs, where shore power delivers the fastest emissions and air-quality returns.
Key Regions and Countries Insights
- North America
- US
- Canada
- Europe
- Germany
- France
- The UK
- Spain
- Italy
- Rest of Europe
- Asia Pacific
- China
- Japan
- South Korea
- India
- Australia
- Rest of APAC
- Latin America
- Brazil
- Mexico
- Rest of Latin America
- Middle East & Africa
- GCC
- South Africa
- Rest of MEA
Key Players Analysis
Siemens Energy plays a central role in OPS (Onshore Power Supply), offering HVSC-compatible equipment and digital control systems. In 2024, the company supported electrification at more than 25 European and Asian ports, with shore-connection modules capable of handling up to 20–30 MVA per berth. Siemens Energy’s grid-integration segment reported 9% annual growth driven by maritime decarbonization investments.
Schneider Electric leverages its EcoStruxure Power platforms to support seamless ship-to-shore connection. The firm supplied more than 3,000 smart switchgear units globally in 2024, many adapted for marine electrification. With a 12% rise in port-automation deployments, Schneider Electric enhances energy monitoring, safety, and optimization, making it a major facilitator of reliable shore-power operations.
Eaton supports port electrification through marine-grade switchgear, breakers, and power-quality solutions. In 2024, Eaton delivered more than 1,800 high-capacity protection units for port-side installations, reporting 8% growth in its utility and infrastructure segment. Its focus on resilience and fault-tolerant systems strengthens operational continuity in shore-power environments requiring stable, high-load electrical flow.
Top Key Players Outlook
- General Electric Company
- Siemens Energy
- Schneider Electric
- ABB
- Eaton
- Conntek Integrated Solutions, Inc.
- Langley Holdings plc.
- Power Systems International
- Sydney Marine Electrical
- BLUEDAY
Recent Industry Developments
In 2025, Schneider Electric’s technology continued to advance in real port deployments, such as at the Port of Sète where its infrastructure supports 6.3 MW of capacity across multiple shore power connection points and is expected to serve nearly 350 ship calls over the coming years while reducing about 6,000 tonnes of CO₂ annually.
In 2024, ABB strengthened its position in shore power by selling complete “shore connection” systems that let ferries and cruise ships plug into the grid and switch off onboard engines while docked. A practical example is ABB’s shore-to-ship project at the Port of Toulon, where the port handles over 1.6 million ferry and cruise passengers annually; ABB states the solution can eliminate more than 80% of local pollutant emissions during port stays and save about 9,000 hours of vessels running on diesel each year.
Report Scope
Report Features Description Market Value (2024) USD 1.9 Bn Forecast Revenue (2034) USD 5.3 Bn CAGR (2025-2034) 10.9% Base Year for Estimation 2024 Historic Period 2020-2023 Forecast Period 2025-2034 Report Coverage Revenue Forecast, Market Dynamics, Competitive Landscape, Recent Developments Segments Covered By Type (Shoreside, Shipside), By Component (Transformers, Switchgear Devices, Frequency Converters, Cables And Accessories, Others), By Power Rating (Up to 30 MV, 30 to 60 MVA, Above 60 MVA), By Connection (New Installation, Retrofit) Regional Analysis North America – US, Canada; Europe – Germany, France, The UK, Spain, Italy, Rest of Europe; Asia Pacific – China, Japan, South Korea, India, Australia, Singapore, Rest of APAC; Latin America – Brazil, Mexico, Rest of Latin America; Middle East & Africa – GCC, South Africa, Rest of MEA Competitive Landscape General Electric Company, Siemens Energy, Schneider Electric, ABB, Eaton, Conntek Integrated Solutions, Inc., Langley Holdings plc., Power Systems International, Sydney Marine Electrical, BLUEDAY Customization Scope Customization for segments, region/country-level will be provided. Moreover, additional customization can be done based on the requirements. Purchase Options We have three licenses to opt for: Single User License, Multi-User License (Up to 5 Users), Corporate Use License (Unlimited User and Printable PDF) 
-
-
- General Electric Company
- Siemens Energy
- Schneider Electric
- ABB
- Eaton
- Conntek Integrated Solutions, Inc.
- Langley Holdings plc.
- Power Systems International
- Sydney Marine Electrical
- BLUEDAY
Our Clients
- 177379
- Feb 2026


