


Report Overview
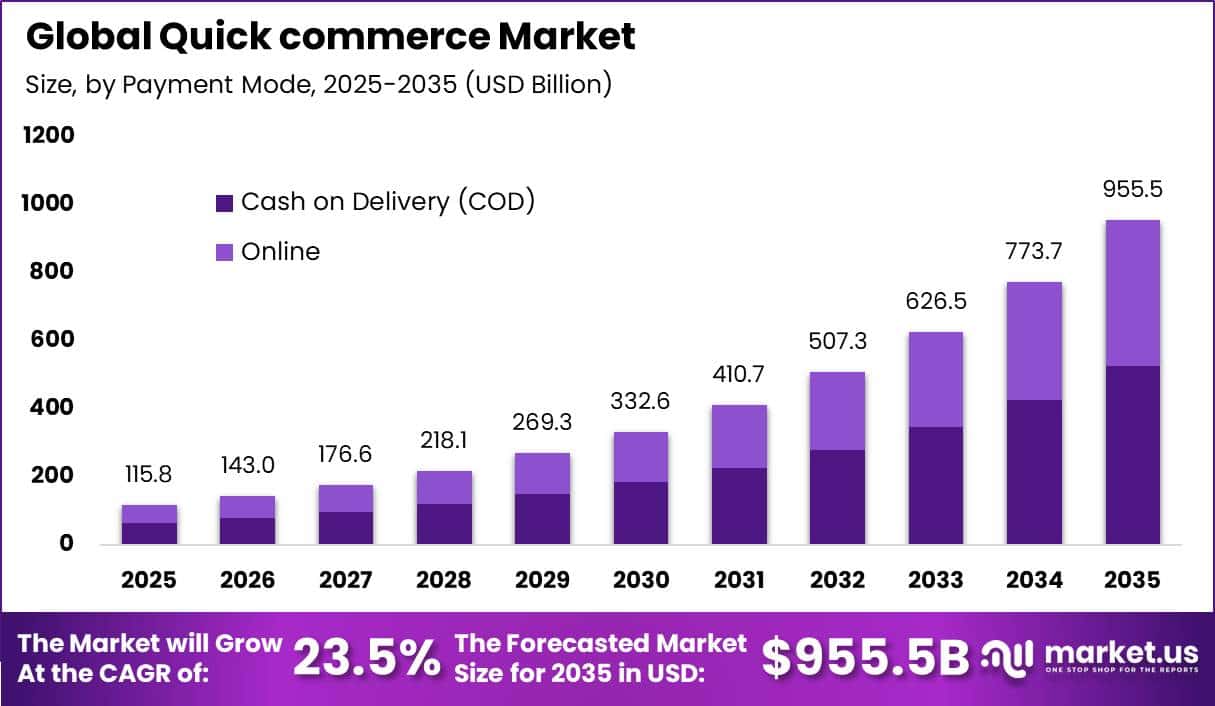
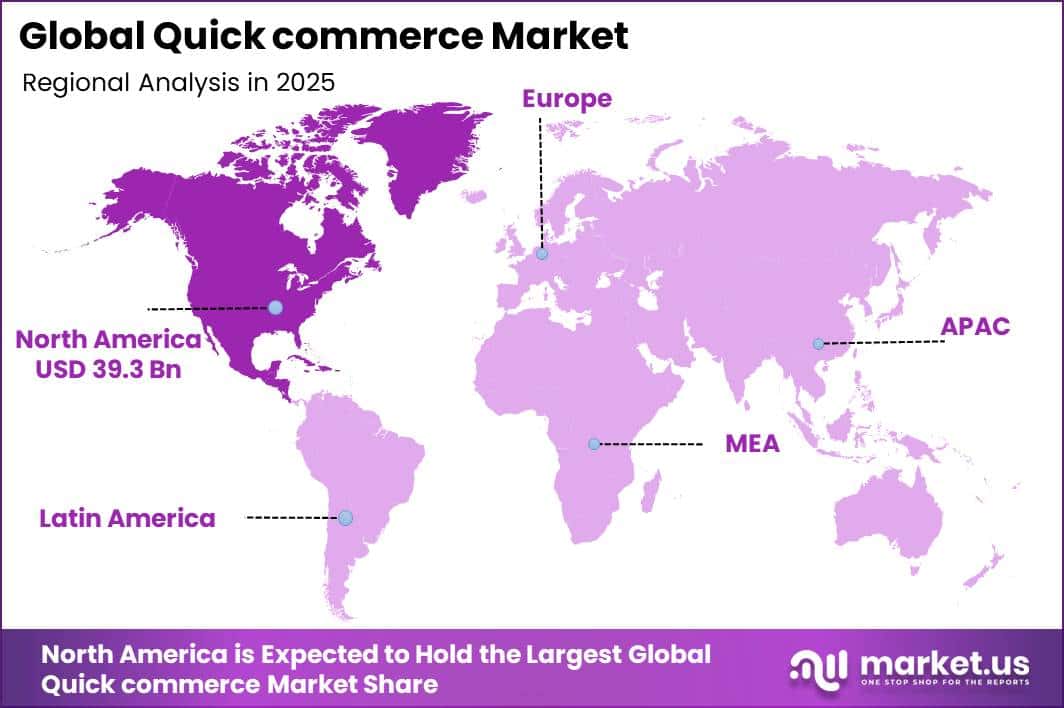
In 2025, the Global Quick Commerce Market was valued at USD 115.8 billion. The market is projected to grow at a CAGR of 23.5% during 2026–2035, reaching approximately USD 955.5 billion by 2035. North America dominated the global market in 2025, accounting for more than 33.9% of the total market share and generating approximately USD 39.3 billion in revenue.
Growth is supported by the increasing shift of everyday purchases, including groceries, household products, personal care items, and urgent essentials, from physical stores to mobile apps and online platforms. Quick Commerce strengthens the traditional e-commerce model by reducing delivery times from several days to a few minutes.
In the United States, retail e-commerce sales reached USD 1.2 trillion in 2025, increasing 5.4% from 2024, while total retail sales grew by 3.5%. E-commerce accounted for 16.4% of total U.S. retail sales, highlighting the growing preference for digital purchasing. This trend is increasing demand for dark stores, local inventory hubs, automated order picking, delivery fleets, and real-time logistics systems.
U.S. retail e-commerce sales reached USD 316.1 billion in the fourth quarter of 2025, rising 5.3% compared with the same quarter of 2024, while online sales represented 16.6% of total retail sales. U.S. retail returns were estimated at USD 849.9 billion in 2025, with online purchases recording a 19.3% return rate, highlighting the growing need for efficient fulfilment and reverse-logistics infrastructure.
Key Takeaway
- The Quick Commerce Market was valued at USD 115.8 billion in 2025 and is projected to reach USD 955.5 billion by 2035, growing at a CAGR of 23.5%.
- Cash on Delivery (COD) leads the payment mode segment with a 55.1% share due to convenience and lower perceived payment risk.
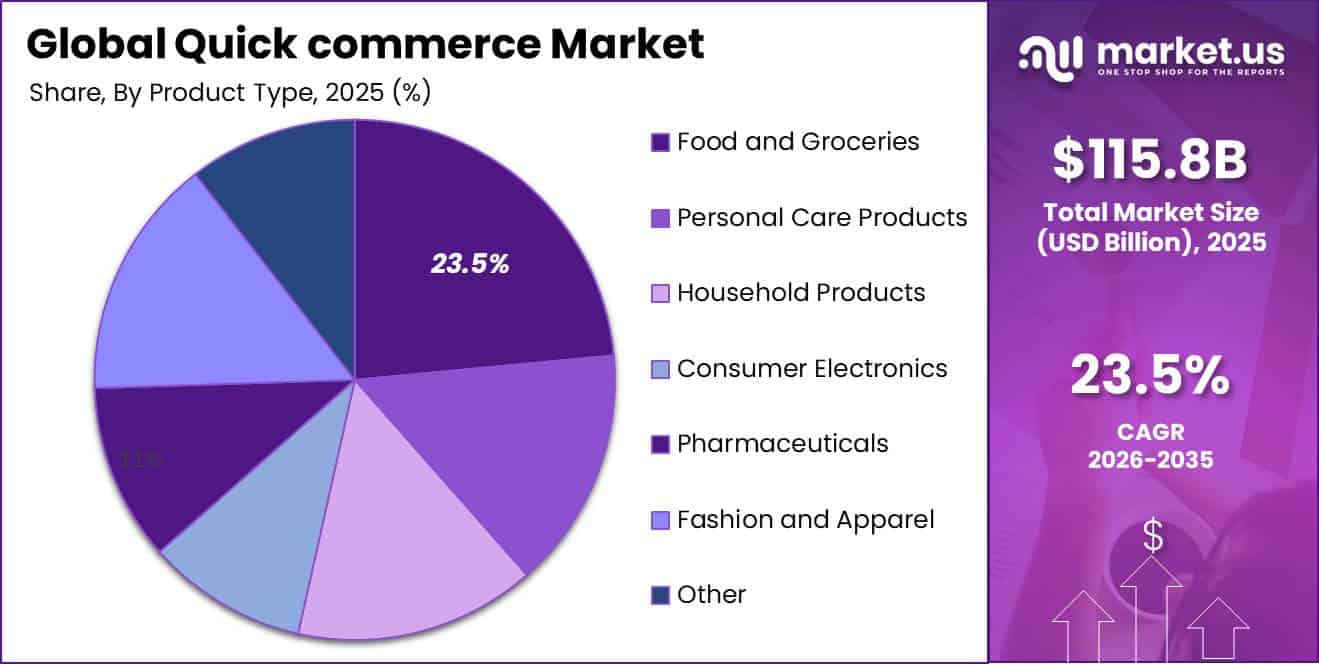
- Food and Groceries lead the product type segment with an estimated 23.5% share, driven by frequent, urgent purchasing needs.
- The hybrid platform segment leads with a 38.4% share, combining digital ordering with nearby physical and dark stores.
- North America led the market in 2025 with a 33.9% share, generating approximately USD 39.3 billion in revenue.
By Payment Mode
Cash on Delivery (COD) is estimated to dominate the Quick Commerce payment mode segment with a 55.1% share, supported by its convenience, wider accessibility, and lower perceived payment risk. Quick Commerce mainly serves urgent and small-value purchases, where customers often prefer to pay only after receiving and checking their orders.
This approach gives buyers greater confidence about product quality, freshness, accuracy, and completeness before making payment. The World Bank reported that 1.6 billion account-owning adults in developing economies continued to make merchant payments only in cash, including around 670 million people in India. This large cash-dependent consumer base supports the continued importance of COD in digital retail.
COD also allows unbanked consumers and customers with limited account balances to use Quick Commerce services while reducing checkout failures caused by card issues, authentication problems, or concerns about advance payments. Since delivery riders already reach customers directly, platforms can collect payment at the doorstep without requiring a separate transaction process.
By Product Type
Food and Groceries lead the Quick Commerce product mix with an estimated 23.5% share, mainly because groceries are purchased frequently and often require fast delivery. The USDA reported that U.S. food-at-home spending reached USD 1.1 trillion in 2025, highlighting the great and recurring demand for household grocery purchases.
Products such as fresh produce, dairy items, bakery goods, beverages, and pantry staples are bought regularly and may be needed within the same day. Quick Commerce platforms support this demand through nearby inventory, real-time product availability, and rapid last-mile delivery. The short shelf life of many grocery products and their frequent reorder cycle make delivery speed especially important.
Consumers may also prefer quick delivery when essential items are forgotten or urgently required, even when additional delivery charges apply. At the global level, food remains a major daily consumption category. FAO data showed that average dietary energy availability exceeded 3,000 kilocalories per person per day in 2023, while 88% of vegetables and 83% of fruits produced were directly used for human consumption.
By Platform Type
The Hybrid platform segment is estimated to lead the Quick Commerce market with a 38.4% share, supported by its ability to combine digital ordering with nearby physical stores, dark stores, and fast delivery networks. This model allows operators to use existing local inventory while applying online demand data to keep popular products closer to customers.
In the United States, grocery store sales reached USD 858.3 billion in 2022, while electronic shopping and mail-order sales totaled USD 1.1 trillion, showing the strong scale of both offline and digital retail channels. Hybrid platforms benefit from both systems. Physical stores provide local product availability, customer familiarity, pickup locations, and return facilities, while mobile apps support product search, digital payments, demand forecasting, and delivery management.
For Quick Commerce companies, shorter delivery distances can reduce travel time and improve order speed, while store-based inventory can lower the cost of relying only on dedicated dark stores. The hybrid model also improves inventory use, product variety, fulfilment flexibility, and service reliability. These operational advantages are expected to support the continued leadership of hybrid platforms in the Quick Commerce market.
Key Market Segments
By Payment Mode
- Cash on Delivery (COD)
- Online
By Product Type
- Food and Groceries
- Personal Care Products
- Household Products
- Consumer Electronics
- Pharmaceuticals
- Fashion and Apparel
- Other
By Platform Type
- Hybrid
- Mobile Applications
- Web-based Platforms
Geopolitical Impact Analysis
Geopolitical disruptions are increasing costs and creating supply uncertainty for Quick Commerce companies that depend on steady inventory flows and rapid local delivery. The World Bank projects average energy prices to increase by 24% in 2026, while Brent crude oil is expected to average USD 86 per barrel, around USD 26 above its January forecast.
This increase is linked to conflict in the Middle East and shipping disruption through the Strait of Hormuz, which normally handles about 35% of global seaborne crude-oil trade. The World Bank also estimates an initial reduction of nearly 10 million barrels per day in global oil supply.
Higher fuel and energy costs can increase delivery expenses, refrigerated-storage costs, supplier transportation charges, and prices of plastic packaging and other petroleum-based materials. Quick Commerce operators may therefore face pressure to raise minimum basket values, introduce delivery charges, reduce delivery areas, or combine orders, making sub-30-minute delivery more expensive.
Trade fragmentation is also increasing procurement risks for smartphones, batteries, warehouse automation systems, refrigeration equipment, insulated delivery bags, and electric two-wheeler components. WTO monitoring showed that new tariffs and related import measures covered USD 2.6 trillion of global imports between mid-October 2024 and mid-October 2025, more than 4 times the USD 611 billion recorded during the previous 12 months.
Tariff and similar measures introduced since 2009 affected 19.7% of world imports, compared with 12.6% a year earlier. These pressures can increase landed costs, delay equipment supply, raise safety-stock requirements, and increase working capital, ultimately creating greater margin volatility for Quick Commerce operators.
Regional Analysis
North America dominated the global Quick Commerce market in 2025, accounting for 33.9% of total revenue, valued at approximately USD 39.3 billion. The region benefits from strong digital retail adoption, high urban spending power, widespread smartphone use, dense metropolitan populations, and well-developed on-demand delivery infrastructure.
The United States remains the main demand center, supported by growing investment in micro-fulfilment centers, dark stores, automated picking systems, localized inventory, and delivery fleets. Canada also provides a strong growth base. Statistics Canada reported seasonally adjusted retail e-commerce sales of CAD 4.3 billion in December 2025, representing 6.1% of total retail trade.
Total Canadian retail sales reached CAD 837.2 billion for full-year 2025, increasing 4.0% year over year. These conditions support faster delivery of groceries, household goods, personal-care products, and convenience items while improving order density and rider utilization.
Asia Pacific is expected to be the fastest-growing regional market, supported by rapid urbanization, increasing digital-payment use, large online consumer populations, and frequent small-basket purchases. Dense cities across India, China, Southeast Asia, Japan, and South Korea reduce delivery distances and improve the economics of hyperlocal fulfilment.
Key Regions and Countries
North America
- US
- Canada
Europe
- Germany
- France
- The UK
- Spain
- Italy
- Rest of Europe
Asia Pacific
- China
- Japan
- South Korea
- India
- Australia
- Rest of APAC
Latin America
- Brazil
- Mexico
- Rest of Latin America
Middle East & Africa
- GCC
- South Africa
- Rest of MEA
Market Dynamics
Drivers
| Driver | (~) % CAGR | Geographic Relevance | Impact Timeline |
|---|---|---|---|
| Dense urban essentials demand | +3.4% | Global urban markets | Short term (2 years or less) |
| Digital payment adoption | +2.6% | Asia Pacific, Latin America, Africa | Short term (2 years or less) |
| Dark-store network scaling | +2.3% | India, Europe, North America | Medium term (2 to 4 years) |
| Mobile commerce penetration | +1.8% | Global | Medium term (2 to 4 years) |
| Rider fleet utilization | +1.4% | High-density cities | Short term (2 years or less) |
Dense urban essentials demand
Dense urban demand is a major growth driver for Quick Commerce because frequent purchases of food, beverages, household goods, and personal-care products support repeat orders and higher rider utilization. FAO data showed that global dietary energy availability exceeded 3,000 kilocalories per person per day in 2023, highlighting the regular and essential nature of food consumption.
In the United States, food and beverage store sales reached USD 376.6 billion in the first quarter of 2025, while Canadian retail sales totaled CAD 70.2 billion in June 2025. High order density within short delivery areas helps platforms improve rider productivity and spread dark-store costs across more orders, supporting an estimated +3.4% contribution above the 23.5% baseline CAGR.
Restraints
| Restraint | (~) % CAGR | Geographic Relevance | Impact Timeline |
|---|---|---|---|
| Food-price affordability pressure | -2.8% | Low- and middle-income economies | Short term (2 years or less) |
| High last-mile cost base | -2.2% | Global | Short term (2 years or less) |
| Cash-flow funding constraints | -1.7% | Europe, emerging markets | Medium term (2 to 4 years) |
| Municipal delivery restrictions | -1.2% | Major urban centres | Medium term (2 to 4 years) |
| Low-density service economics | -1.0% | Suburban and rural markets | Long term (4 years or more) |
Food-price affordability pressure
Food-price affordability remains a major restraint for Quick Commerce because consumers can easily reduce spending on delivery fees and service charges when staple prices rise. World Bank data showed food inflation above 5% in 45.0% of low-income economies, 43.5% of lower-middle-income economies, and 41.9% of upper-middle-income economies. Food inflation also exceeded overall inflation in 54% of 166 economies.
With global economic growth projected at only 2.6% in 2026, consumers may become less willing to pay extra for faster delivery. Quick Commerce operators may need to offer more discounts, lower delivery charges, or accept smaller basket sizes, putting pressure on margins and dark-store expansion. These affordability pressures could create an estimated -2.8% drag on the market’s 23.5% baseline CAGR.
Challenges
| Challenge | (~) % CAGR | Geographic Relevance | Mitigation Horizon |
|---|---|---|---|
| Volatile inventory replenishment | -2.1% | Import-dependent markets | Medium term (2 to 4 years) |
| Perishable waste control | -1.8% | Global grocery networks | Medium term (2 to 4 years) |
| Peak-hour fleet balancing | -1.6% | High-density cities | Short term (2 years or less) |
| Demand forecasting accuracy | -1.3% | Global | Medium term (2 to 4 years) |
| Cold-chain reliability | -1.1% | Warm-climate markets | Long term (4 years or more) |
Volatile inventory replenishment
Inventory replenishment remains a major operational challenge for Quick Commerce because platforms must keep thousands of fast-moving products available across small local fulfilment hubs. UNCTAD reported that the China Containerized Freight Index increased about 120% between October 2023 and June 2024, while Red Sea disruption contributed 148 percentage points to the increase. Tonnage through the Suez Canal also declined 70%, while capacity crossing the Gulf of Aden fell 76%.
Energy prices are projected to rise 24% in 2026, adding pressure on supplier transportation and refrigeration costs. These disruptions can force operators to hold more safety stock, replace unavailable brands, and diversify suppliers. Higher inventory and logistics costs could create an estimated -2.1% drag on the achievable CAGR of the Quick Commerce market.
Opportunities
| Opportunity | (~) % CAGR | Geographic Relevance | Execution Window |
|---|---|---|---|
| Electric delivery fleet conversion | +2.7% | Asia Pacific, Europe, Latin America | Medium term (2 to 4 years) |
| Retailer fulfilment partnerships | +2.1% | North America, Europe | Medium term (2 to 4 years) |
| Private-label basket expansion | +1.8% | Global | Medium term (2 to 4 years) |
| Business procurement delivery | +1.5% | Global urban centres | Long term (4 years or more) |
| Automated micro-fulfilment | +1.3% | High-income urban markets | Long term (4 years or more) |
Electric delivery fleet conversion
Electric two- and three-wheelers represent a growing cost-saving opportunity for Quick Commerce rather than a current core market driver. Electric models accounted for about 15% of global two- and three-wheeler sales in 2024, while more than 9% of the global fleet was electric. China, India, and Southeast Asia represented around 80% of global two- and three-wheeler sales, while electric vehicles already account for more than 30% of the fleet in leading adoption markets.
With energy prices projected to rise 24% in 2026, fleet electrification can reduce fuel-cost exposure and improve delivery-cost predictability. Wider use of leasing, battery swapping, and depot charging could lower per-order delivery costs by an estimated 8% to 15%. This could provide around +2.7% additional growth potential above the 23.5% baseline CAGR for the Quick Commerce market.
Key Players Analysis
Tier-1 competition in the Quick Commerce market is led by DoorDash and Delivery Hero/Wolt, supported by large delivery networks, strong technology platforms, and multi-country operations. DoorDash generated USD 13.7 billion in revenue in 2025, increasing 27.9% year over year, while Marketplace gross order value grew 27%. The company also invested USD 257 million in capital expenditure to strengthen logistics technology and fulfilment capacity.
Delivery Hero reported EUR 49.2 billion in group GMV and EUR 14.8 billion in total segment revenue in 2025. Its quick-commerce GMV exceeded EUR 7.5 billion, growing by more than 30%, while adjusted EBITDA increased 30% to EUR 903 million. Together, DoorDash and Delivery Hero/Wolt are estimated to represent around 35–45% of the named-player quick-commerce universe.
Tier-2 competition includes Blinkit, Swiggy Instamart, BigBasket, Zepto, Flink, Getir, and Bolt. Swiggy Instamart recorded FY2025 GOV of INR 14,683 crore, increasing 82%, supported by 285 million orders. Adjusted revenue more than doubled to INR 3,811 crore, while adjusted EBITDA loss narrowed to INR 547 crore.
Its loss margin improved to 14.3% from 27.9%. Competition is increasingly focused on dark-store efficiency, automated picking, inventory accuracy, and rider productivity. Delivery Hero also capitalized EUR 87.2 million of internally developed software in 2025, highlighting the growing importance of technology investment.
Top Key Players in the Market
- DoorDash, Inc.
- Delivery Hero SE
- Wolt
- Bolt Technology OÜ
- Blink Commerce Private Limited
- Swiggy
- BigBasket
- Getir
- Zepto
- Flink SE
Recent Developments
- In 2026, Delivery Hero signed an agreement on March 23 to sell its foodpanda Taiwan business to Grab for USD 600 million in cash on a cash-and-debt-free basis. The Taiwan operation generated EUR 1.5 billion in GMV and positive adjusted EBITDA in 2025.
- In 2025, DoorDash completed its acquisition of Deliveroo on October 2 for an equity value of GBP 2.8 billion, including an estimated GBP 690 million of acquired cash and short-term investments. DoorDash expected Deliveroo to contribute approximately USD 45 million to adjusted EBITDA in Q4 2025 and around USD 200 million in 2026.
Report Scope
| Report Features | Description |
|---|---|
| Market Value (2025) | USD 115.8 Billion |
| Forecast Revenue (2035) | USD 955.5 Billion |
| CAGR (2026-2035) | 23.5% |
| Base Year for Estimation | 2025 |
| Historic Period | 2020-2024 |
| Forecast Period | 2026-2035 |
| Report Coverage | Revenue Forecast, Market Dynamics, Competitive Landscape, Recent Developments |
| Segments Covered | By Payment Mode (Cash on Delivery (COD), Online); By Product Type (Food and Groceries, Personal Care Products, Household Products, Consumer Electronics, Pharmaceuticals, Fashion and Apparel, Other); By Platform Type (Hybrid, Mobile Applications, Web-based Platforms) |
| Regional Analysis | North America – US, Canada; Europe – Germany, France, The UK, Spain, Italy, Rest of Europe; Asia Pacific – China, Japan, South Korea, India, Australia, Singapore, Rest of APAC; Latin America – Brazil, Mexico, Rest of Latin America; Middle East & Africa – GCC, South Africa, Rest of MEA |
| Competitive Landscape | DoorDash, Inc.; Delivery Hero SE; Wolt; Bolt Technology OÜ; Blink Commerce Private Limited; Swiggy; BigBasket; Getir; Zepto; Flink SE |
| Customization Scope | Customization for segments and region/country-level will be provided. Additional customization can be done based on requirements. |
| Purchase Options | We have three licenses to opt for: Single User License, Multi-User License (Up to 5 Users), Corporate Use License (Unlimited Users and Printable PDF) |





























