


Report Overview
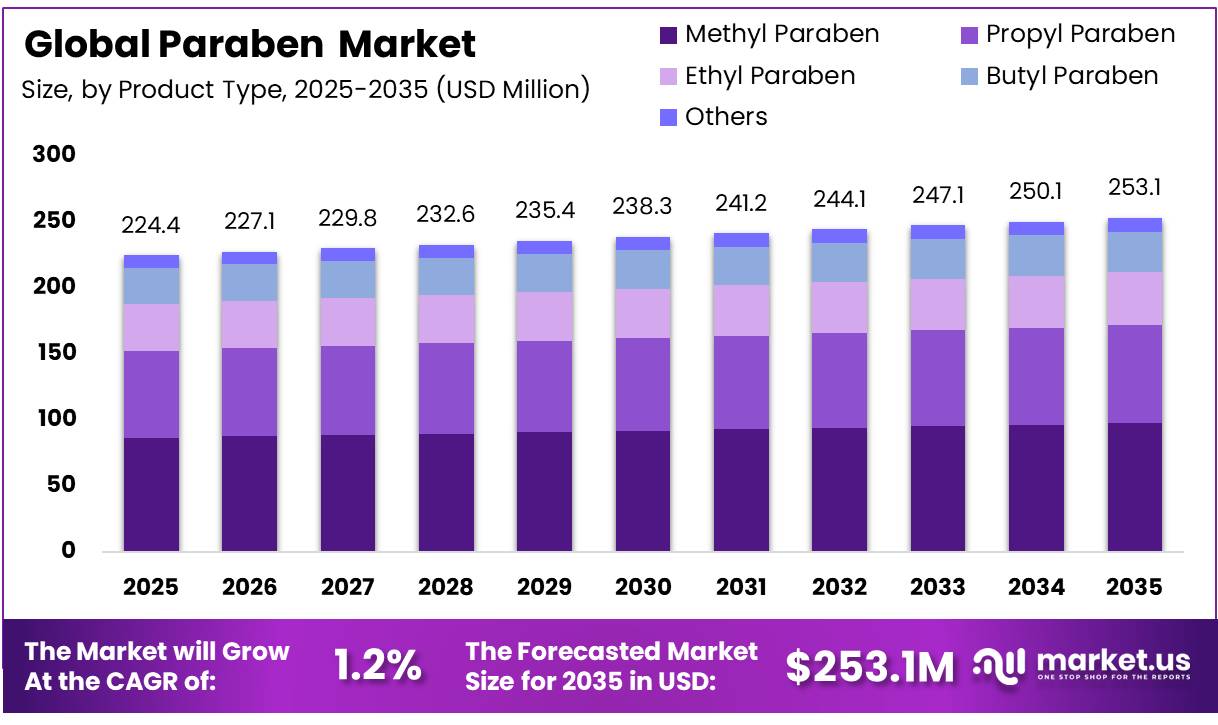
The global Paraben market was valued at USD 224.4 Million in 2025 and is expected to grow to USD 253.1 Million in 2035. Between 2025 and 2035, this market is estimated to register a CAGR of 1.2%. In 2025, Asia Pacific led the market, achieving over 38.2% share with a revenue of USD 98.8 Million.
Parabens are a group of p-hydroxybenzoic acid esters used as antimicrobial preservatives, mainly to control yeasts, molds, and some bacteria in moisture-containing products. In food applications, their use is more selective than in personal care or pharmaceuticals because regulators apply tight concentration limits and consumers increasingly prefer “clean-label” alternatives. In the United States, methylparaben is affirmed for food use as an antimicrobial agent, with current good manufacturing practice resulting in a maximum level of 0.1% in food; propylparaben is also listed with the same 0.1% maximum-use level.
- At the international level, FAO/WHO JECFA lists methylparaben as INS 218 and ethyl p-hydroxybenzoate as INS 214, both under the functional class of food additives/preservatives, with a group ADI of 0–10 mg/kg body weight for methyl and ethyl esters.
Key Takeaways
- Paraben market was valued at USD 224.4 Million in 2025 and is expected to grow to USD 253.1 Million in 2035. Between 2025 and 2035, this market is estimated to register a CAGR of 1.2%
- Methyl Paraben is the dominant segment in the global paraben market, holding 38.5% of the total market share.
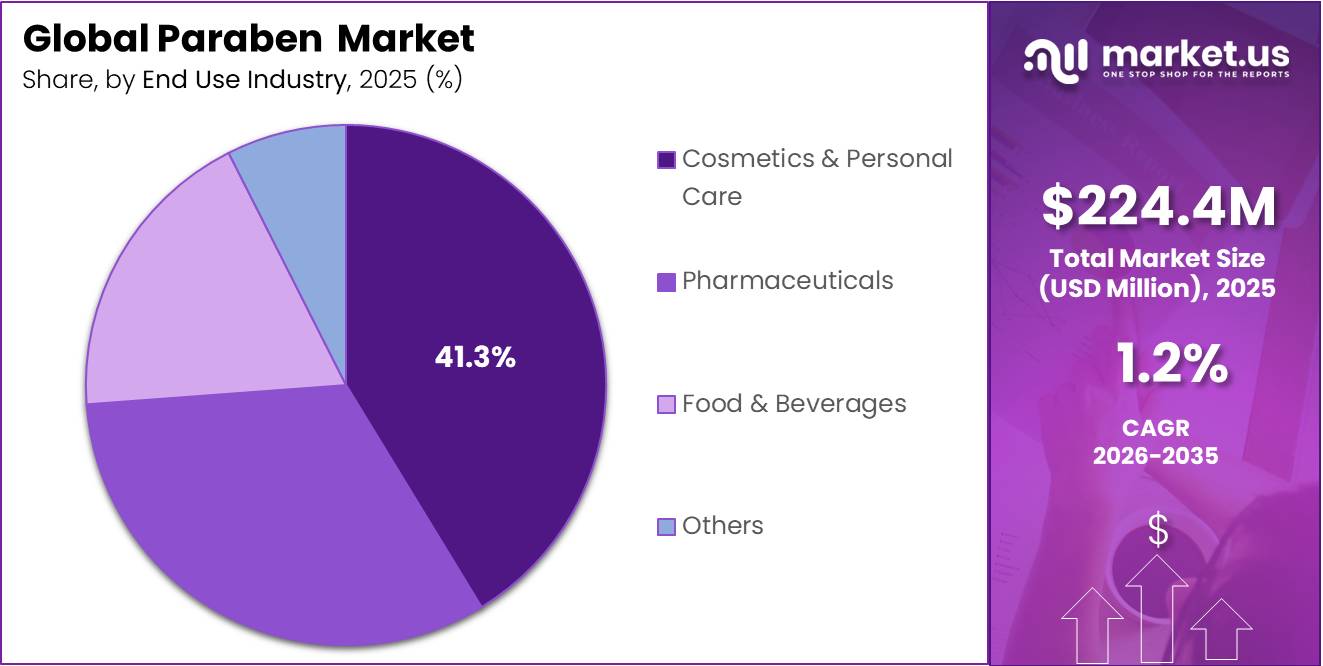
- Cosmetics & Personal Care segment is the dominating application area in the global paraben market, accounting for 41.3% of the total market share.
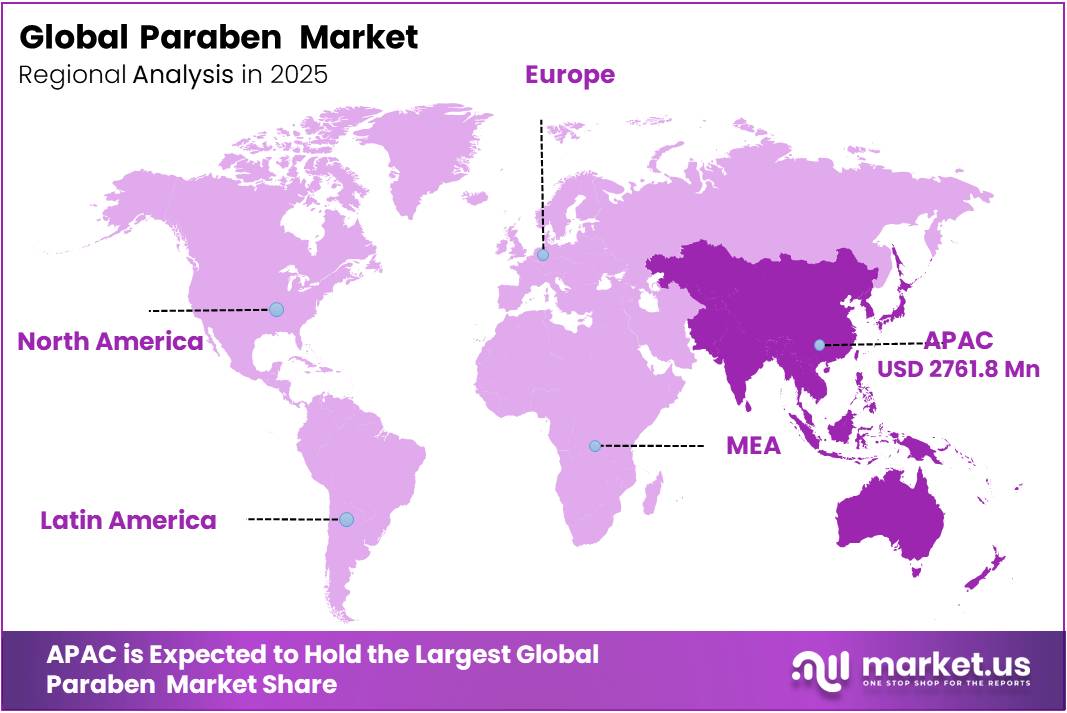
- Asia-Pacific held a dominant position in the Paraben Market, capturing more than a 38.2% share and reaching nearly USD 98.8 Mn.
The industrial scenario is highly regulation-led rather than volume-led. In the UK’s 2026 approved additive list, ethyl p-hydroxybenzoate is listed as E214, sodium ethyl p-hydroxybenzoate as E215, methyl p-hydroxybenzoate as E218, and sodium methyl p-hydroxybenzoate as E219 under preservatives. The European Commission states that EU food additives must be authorized, listed with conditions of use, supported by safety assessment, technological need, and non-misleading use under Regulation (EC) No. 1333/2008.
Safety limits remain the main factor shaping demand. EFSA set a group acceptable daily intake of 0–10 mg/kg body weight for methyl and ethyl parabens and their sodium salts, while propyl paraben was not included in that group ADI because EFSA could not recommend a specific ADI. EFSA also cited earlier permitted food-use levels such as 1 g/kg in jelly coatings of meat products, 0.3 g/kg in confectionery excluding chocolate, and 2 g/kg in liquid dietary food supplements. In the U.S., eCFR states that methylparaben use under good manufacturing practice results in a maximum level of 0.1% in food.
Demand is supported by the need for longer shelf life, safer packaged foods, and lower spoilage. USDA reported that total U.S. food spending reached USD 2.51 trillion in 2025, while food-away-from-home spending rose to USD 1.41 trillion, showing the scale of processed, stored, and distributed food systems that depend on preservation controls. At the same time, UNEP reported 1.05 billion tonnes of food waste in 2022, equal to 19% of food available to consumers, creating a strong future opportunity for effective preservation and shelf-life technologies.
Government initiatives are also reshaping the preservative landscape. The FDA’s FSMA Food Traceability Rule has a listed compliance date of January 20, 2026, with requirements intended to enable faster identification and removal of contaminated foods from the market. In Europe, the 2025 amendment to the Waste Framework Directive introduced binding food-waste reduction targets by 2030, including 10% reduction in processing and manufacturing and 30% per capita reduction across retail and consumption.
By Paraben Type Analysis
Dominance of Methyl Paraben and Growing Demand for Propyl Paraben.
Methyl Paraben is the dominant segment in the global paraben market, holding 38.5% of the total market share. It is widely used in everyday products such as skincare items, shampoos, lotions, medicines, and other personal care products. One of the main reasons for its popularity is its ability to keep products fresh and safe by preventing the growth of harmful bacteria and fungi. It is also a cost-effective preservative, making it a preferred choice for manufacturers across different industries.
Propyl Paraben is the fastest-growing segment and currently accounts for 29.4% of the market. It is often used together with other preservatives to provide stronger protection against microbial contamination. The growing demand for high-quality cosmetics, personal care products, and pharmaceutical formulations is supporting the increased use of propyl paraben. Manufacturers value it for its effectiveness in improving product stability and extending shelf life. As the need for reliable preservation solutions continues to grow, propyl paraben is expected to see increasing adoption across a wide range of applications.
By End-Use Industry Analysis
Dominating Role of Cosmetics & Personal Care and Rising Adoption in Pharmaceuticals
The Cosmetics & Personal Care segment is the dominating application area in the global paraben market, accounting for 41.3% of the total market share. Parabens are widely used in products such as moisturizers, shampoos, conditioners, deodorants, lotions, and various skincare and hygiene products because they help protect these products from bacterial and fungal growth. Their effectiveness in maintaining product quality and extending shelf life has made them a preferred preservative for manufacturers.
The Pharmaceuticals segment is the fastest-growing application area and currently holds a 32.5% market share. Parabens are commonly used in medicines such as syrups, creams, ointments, and other pharmaceutical formulations to protect them from microbial contamination and maintain product stability. As healthcare access improves and the demand for medicines continues to increase globally, pharmaceutical manufacturers are placing greater emphasis on product safety and shelf-life extension. This is expected to support the growing use of parabens in pharmaceutical applications over the coming years.
Key Market Segments
By Paraben Type
- Methyl Paraben
- Propyl Paraben
- Ethyl Paraben
- Butyl Paraben
- Others
By End-Use Industry
- Cosmetics & Personal Care
- Pharmaceuticals
- Food & Beverages
- Others
Driver Analysis
EU concentration caps shifting mix toward compliant parabens
Europe constrains parabens more tightly, but that has not eliminated the category; instead, it has narrowed the usable portfolio and increased demand for compliant formulations centered on methylparaben and ethylparaben, with tighter treatment of propylparaben and butylparaben. Current summaries of Annex V limits indicate up to 0.4% for methylparaben or ethylparaben individually, 0.8% in combination, and about 0.14% for propylparaben and butylparaben, while five other parabens remain prohibited in EU cosmetics; the European Commission’s SCCS framework continues to anchor this risk-based approach.
Strategically, this creates a positive mix effect rather than simple volume destruction: suppliers able to provide compliant grades, reformulation support, and documentation capture value as brands redesign formulas to remain inside concentration ceilings instead of exiting preservation altogether. That supports around +0.6 percentage points to CAGR over the medium term because regulation prunes the market but also formalizes it, favoring technically supported suppliers and sustaining demand in regulated personal care exports from the UK, Turkey, India, and ASEAN manufacturers selling into Europe.
Drivers Impact Analysis
| Driver | (~) % Impact on CAGR | Geographic Relevance | Impact Timeline |
|---|---|---|---|
| Cosmetics shelf-life economics in mass beauty | +1.3% | APAC core, North America core, EU selective, LATAM spill-over | Short term (≤ 2 years) |
| FDA/MoCRA compliance favoring proven preservative systems | +0.8% | North America core, export-oriented Asia | Short term (≤ 2 years) |
| EU concentration caps shifting mix toward compliant parabens | +0.6% | EU core, UK aligned, ASEAN premium exporters | Medium term (2-4 years) |
| China and ASEAN filing discipline boosting formula stability testing | +0.9% | China core, ASEAN corridors, South Korea/Japan adjacent | Medium term (2-4 years) |
| Pharma and topical OTC preservation demand resilience | +1.0% | North America, EU, India, China | Medium term (2-4 years) |
| Cost pressure versus alternative preservatives preserving paraben relevance | +1.2% | India, Southeast Asia, Africa, LATAM, value-tier global brands | Long term (≥ 4 years) |
Restraint Analysis
Clean-beauty reformulation and brand de‑listing
In practical unit-economic terms, reformulation requires stability testing cycles of 6–18 months, incremental R&D and QC spend in the low single digits of product cost, and marketing re-launch budgets that are only justified when brands can claim ingredient upgrades; that combination results in deliberate paraben removal in categories like facial care, baby care, and deodorants, while residual usage survives in value-tier SKUs.
This restraint is estimated to reduce paraben CAGR by around 1.6 percentage points versus a scenario of unchanged formulary practices, because each wave of reformulation permanently shifts recurring demand to alternative systems, pushes private-label buyers to match “clean” claims, and forces parabens deeper into price-sensitive segments where growth per unit is slower and margins thinner.
Restraint Impact Analysis
| Restraint | (~) % Impact on CAGR | Geographic Relevance | Impact Timeline |
|---|---|---|---|
| Clean-beauty reformulation and brand de-listing | -1.6% | North America core, EU, premium APAC | Medium term (2-4 years) |
| Endocrine and toxicity concerns from emerging studies | -1.2% | Global, with EU/US policy focus | Long term (≥ 4 years) |
| EU and regional regulatory tightening risk | -0.9% | EU core, UK, ASEAN exporters | Medium term (2-4 years) |
| Environmental pollutant profile and wastewater scrutiny | -0.7% | EU, US, China, OECD markets | Long term (≥ 4 years) |
| Input cost volatility and logistics bottlenecks | -0.8% | APAC producers, global importers | Short term (≤ 2 years) |
| Substitution by “natural” and alternative preservatives | -1.5% | EU, North America, Japan, Korea | Medium term (2-4 years) |
Opportunity Analysis
Low-dose, compliant paraben reformulation niche
In the EU, UK, and other high-regulation markets, the baseline driver is constrained demand under Annex V caps and partial bans; the untapped opportunity is to occupy the white space between paraben-free and legacy high-dose formulations by building a specialist niche around low-dose, compliant paraben systems tailored to risk-averse yet performance-hungry brands.
If such compliant niche solutions can reclaim even 10–15% of the volume lost to non-paraben alternatives in EU and UK high-value categories, with pricing at a 20–30% premium to commodity parabens due to technical services and safety positioning, this could yield around 1.0 percentage-point upside on CAGR, clearly differentiated from baseline drivers by focusing on risk-management innovation and regulatory comfort rather than existing volume growth in mass markets.
Opportunity Impact Analysis
| Opportunity | (~) % Potential CAGR | Geographic Relevance | Execution Window |
|---|---|---|---|
| Multi-preservative platform bundling for OEMs | +1.4% | North America core, EU, APAC export hubs | Medium term (2-4 years) |
| Pharma/OTC and medical topical expansion | +1.2% | US, EU, India, China | Medium term (2-4 years) |
| “Low-dose, compliant paraben” reformulation niche | +1.0% | EU, UK, Japan, Korea | Medium term (2-4 years) |
| Emerging-market hygiene and institutional channels | +1.6% | South Asia, Africa, LATAM, ASEAN | Long term (≥ 4 years) |
| Data-backed safety and ESG repositioning | +0.9% | Global multinationals, OECD markets | Long term (≥ 4 years) |
| Sodium/methyl paraben specialty grades and blends | +1.1% | East Asia production, global formulators | Short term (≤ 2 years) |
Challenges Analysis
Supply-chain and logistics volatility
Supply-chain challenges in 2026 are systemic rather than crisis-driven, with macroeconomic volatility, geopolitical tension, rising transportation and fuel costs, and supplier reliability issues all converging to impose roughly a 0.9 percentage-point drag on the paraben market’s potential CAGR by inflating landed costs and complicating inventory planning.
General supply-chain analyses for 2026 point to fuel and freight cost inflation, labor shortages in logistics, and the need for real-time visibility as key pain points, with companies facing increased transit times, more frequent delays exceeding 7–10 days on international routes, and higher safety-stock requirements to hedge against stockouts.
Challenges Impact Analysis
| Challenge | (~) % CAGR Friction | Geographic Relevance | Mitigation Horizon |
|---|---|---|---|
| Fragmented global regulatory change | -1.1% | US, EU hubs, UK, Canada, APAC exporters | Long term (≥ 4 years) |
| Supply-chain and logistics volatility | -0.9% | APAC corridors, global importers | Medium term (2-4 years) |
| Rising compliance and documentation burden | -0.8% | US, EU, UK, Canada | Medium term (2-4 years) |
| Talent and digital capability gaps | -0.7% | Global, especially mid-tier producers | Long term (≥ 4 years) |
| Consumer data visibility and reputational risk | -0.6% | North America, EU, OECD markets | Long term (≥ 4 years) |
| Portfolio complexity and multi-jurisdiction SKU management | -0.8% | Multinational brand networks, OEMs | Medium term (2-4 years) |
Geopolitical Impact Analysis
Geopolitical Tensions and Energy Price Volatility Affecting the Global Chlorine Market.
The paraben market around the world is affected by various geopolitical issues, regulatory harmonization, and global trade regulations concerning the chemicals involved in making cosmetics, pharmaceuticals, and foods. The fact that parabens are widely utilized chemicals means that any changes in the trade regulations and safety regulations of chemicals will affect the supply of parabens and their prices. There are different government agencies like the FDA of the United States and the SCCS of the European Commission that determine the level at which parabens are used.
Moreover, geopolitical friction and trade restrictions between the major producers and consumers of chemicals might hamper the availability of raw materials and intermediates necessary for paraben synthesis. In addition, many states are increasingly concentrating on the growth of their local capacity in chemical production and the reduction of imports, thereby gradually restructuring the global supply chains. Increased cost of logistics, higher freight charges, and delays at ports represent some more problems facing international chemical trade, including that of parabens.
The war between Russia and Ukraine and the current situation in some regions of the Middle East have added to the pressure faced by global supply chains owing to fluctuations in energy prices, transport routes, and availability of raw materials. This development, along with some others, has had an indirect impact on production and logistic expenses incurred by manufacturers of chemicals, such as parabens. Nevertheless, thanks to steady demand from the pharma and personal care sector, the market of parabens remains stable.
Regional Analysis
Asia-Pacific Dominates the Paraben Market with Strong Cosmetic and Personal Care Demand
In 2025, Asia-Pacific held a dominant position in the Paraben Market, capturing more than a 38.2% share and reaching nearly USD 98.8 Mn in value. The region remained the leading market because parabens are widely used as preservatives in cosmetics, personal care products, topical formulations, and selected consumer goods where microbial protection and longer shelf life are important. China remained a major demand base, supported by large consumer spending activity.
- In 2025, China’s total retail sales of consumer goods reached 50,120.2 billion yuan, up 3.7% year-on-year, while online retail sales reached 15,972.2 billion yuan, up 8.6%, strengthening digital sales channels for beauty and personal care products.
Key Regions and Countries
- North America
- US
- Canada
- Europe
- Germany
- France
- The UK
- Spain
- Italy
- Rest of Europe
- Asia Pacific
- China
- Japan
- South Korea
- India
- Australia
- Rest of APAC
- Latin America
- Brazil
- Mexico
- Rest of Latin America
- Middle East & Africa
- South Africa
- Saudi Arabia
- UAE
- Rest of MEA
Key Players Analysis
The global paraben market is moderately competitive, with several manufacturers supplying preservatives for cosmetics, personal care products, pharmaceuticals, and other industrial applications. Companies compete mainly on product quality, regulatory compliance, pricing, production efficiency, and supply reliability. Since parabens are used in products that come into direct contact with consumers, maintaining consistent quality and meeting safety standards are critical factors for success in the market.
Manufacturers are increasingly focusing on improving production processes, ensuring product purity, and complying with evolving regulations across different regions. Many companies are also investing in sustainable manufacturing practices and efficient supply chain management to strengthen their market position. As demand for personal care products, cosmetics, and pharmaceutical formulations continues to grow, market participants are working to provide reliable and cost-effective preservative solutions while adapting to changing consumer preferences and regulatory requirements.
The Major Players in The Industry
- Clariant AG
- Ashland Global Holdings Inc.
- BASF SE
- Lonza Group AG
- UENO Fine Chemicals Industry Ltd.
- Gujarat Organics Ltd.
- Salicylates and Chemicals Pvt. Ltd.
- Hefei TNJ Chemical Industry Co., Ltd.
- Symrise AG
- Zhejiang Shengxiao
- Stepan Company
- Sharon Laboratories Ltd.
- San Fu Chemical Co., Ltd.
- Wuhu HuaHai Biology Engineering Co., Ltd.
- Alta Laboratories Ltd.
- Others
Key Developments
- In 2025, Symrise reported EUR 4,929 million in group sales, 2.8% organic growth, EUR 780 million business free cash flow, and a 21.9% adjusted EBITDA margin. In H1 2025, Scent & Care generated EUR 989 million in revenue, with Cosmetic Ingredients including Micro Protection solutions for beauty formulations.
- In fiscal 2025, Ashland Global Holdings Inc reported sales of USD 1.8 billion and adjusted EBITDA of USD 401 million, with a 22.0% adjusted EBITDA margin. Its Personal Care segment generated USD 577 million in sales and USD 158 million adjusted EBITDA. This gives Ashland a strong technical position in preservative and formulation systems.
- In 2025, Clariant AG reported CHF 3.915 billion in sales, CHF 643 million EBITDA, and 10,281 FTE employees. Its Care Chemicals business benefited from Personal & Home Care growth, while innovation sales reached 18.8%. This supports its role as a high-value supplier to cosmetic preservative formulators.
Report Scope
| Report Features | Description |
|---|---|
| Market Value (2025) | USD 224.4 Mn |
| Forecast Revenue (2035) | USD 253.1 Mn |
| CAGR (2026-2035) | 1.2% |
| Base Year for Estimation | 2025 |
| Historic Period | 2020-2024 |
| Forecast Period | 2026-2035 |
| Report Coverage | Revenue Forecast, Market Dynamics, Competitive Landscape, Recent Developments |
| Segments Covered | By Type (Methyl paraben, Propyl paraben, Butyl paraben, Others), By End Use Industry (Food & Beverages, Pharmaceuticals, Cosmetics & Personal Care , Others), By Region and Companies – Industry Segment Outlook, Market Assessment, Competition Scenario, Trends and Forecast 2025–2035 |
| Regional Analysis | North America – The US & Canada; Europe – Germany, France, The UK, Spain, Italy, Russia & CIS, Rest of Europe; APAC– China, Japan, South Korea, India, ASEAN & Rest of APAC; Latin America– Brazil, Mexico & Rest of Latin America; Middle East & Africa– GCC, South Africa, & Rest of MEA |
| Competitive Landscape | Clariant AG, Ashland Global Holdings Inc., BASF SE, Lonza Group AG, UENO Fine Chemicals Industry Ltd., Gujarat Organics Ltd., Salicylates and Chemicals Pvt. Ltd., Hefei TNJ Chemical Industry Co., Ltd., Symrise AG, Zhejiang Shengxiao, Stepan Company, Sharon Laboratories Ltd., San Fu Chemical Co., Ltd., Wuhu HuaHai Biology Engineering Co., Ltd., Alta Laboratories Ltd., Others |
| Customization Scope | Customization for segments, region/country-level will be provided. Moreover, additional customization can be done based on the requirements. |
| Purchase Options | We have three licenses to opt for: Single User License, Multi-User License (Up to 5 Users), Corporate Use License (Unlimited Users and Printable PDF) |





































