
Global Nutritive Sweetener Market Size, Share Analysis Report By Product Type (Fructose, Sucrose, Corn Sugar, Honey, High Fructose Corn Syrup), By Nature (Organic, Conventional), By End Use (Household/Retail, Food Processing, Bakery, Confectionery, Beverages, Pharmaceuticals), By Distribution Channel (Direct Sales, Indirect Sales) , By Region and Companies - Industry Segment Outlook, Market Assessment, Competition Scenario, Trends and Forecast 2025-2034
- Published date: Dec 2025
- Report ID: 170722
- Number of Pages: 258
- Format:
-
keyboard_arrow_up
Quick Navigation
Report Overview
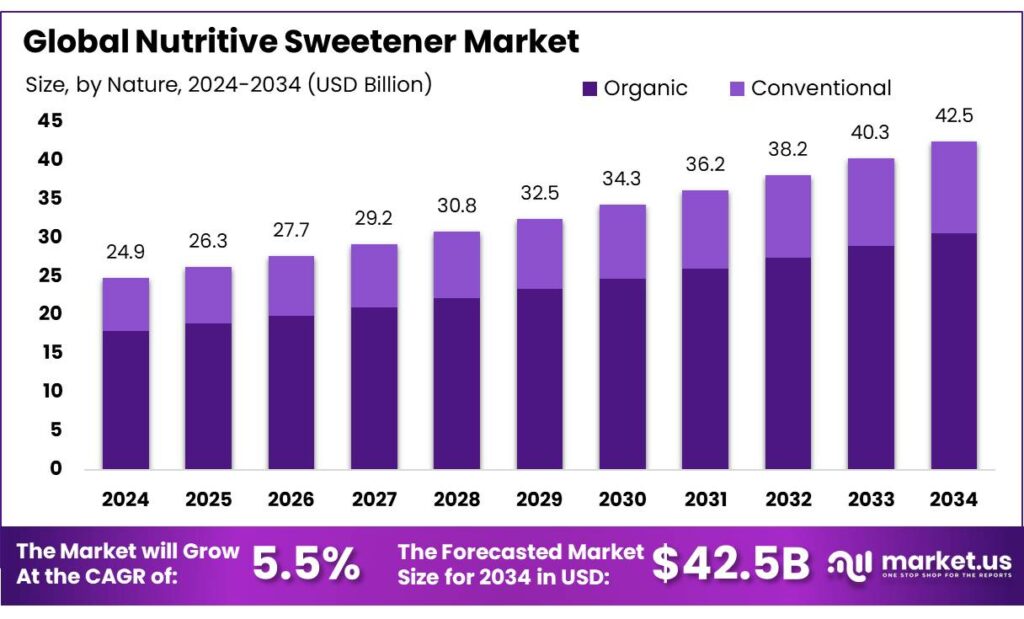
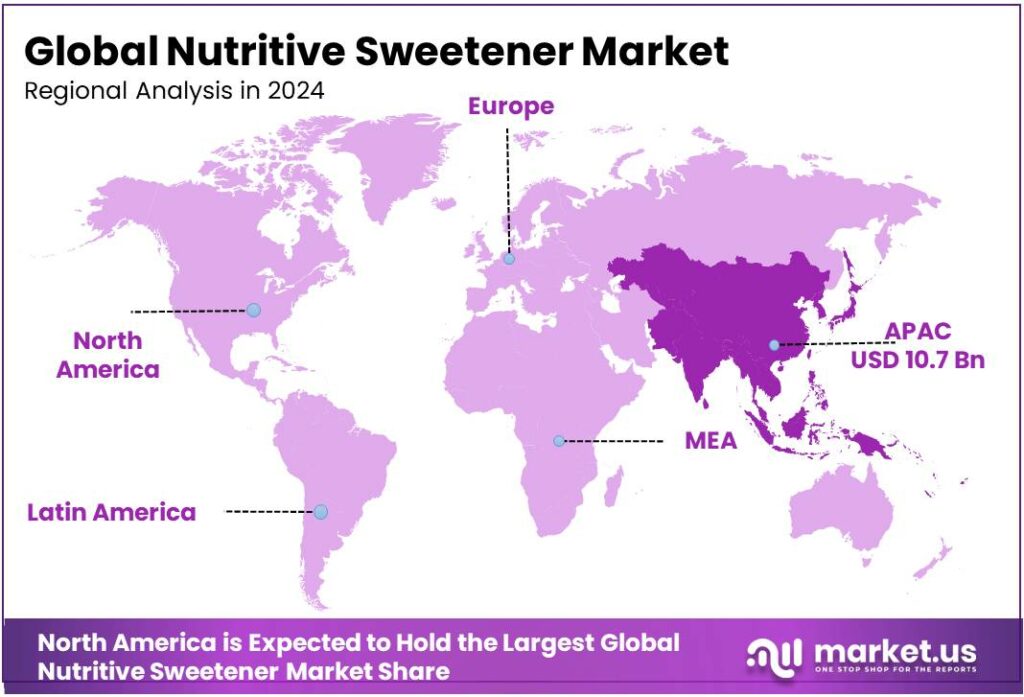
The Global Nutritive Sweetener Market size is expected to be worth around USD 42.5 Billion by 2034, from USD 24.9 Billion in 2024, growing at a CAGR of 5.5% during the forecast period from 2025 to 2034. In 2024, Asia Pacific held a dominant market position, capturing more than a 43.20% share, holding USD 10.7 Billion revenue.
The nutritive sweetener industry comprises carbohydrate-based sweetening agents that contribute energy (calories) to foods and beverages, including sugars, fructose, glucose, sucrose, and sugar alcohols. These ingredients are integral to taste, texture, preservation, and fermentation processes in broad applications spanning bakery, confectionery, beverages, dairy, and pharmaceutical sectors.
Nutritive sweeteners generally provide approximately 4 kcal per gram, underpinning their dual role as taste enhancers and caloric contributors in processed foods and formulations. Their established place in diets and manufacturing operations stems from both functional performance and regulatory acceptance in major global markets.
From an industrial scenario view, upstream supply is concentrated in a few large crop systems. In 2023, global sugarcane production exceeded 2 billion tonnes, compared with 281 million tonnes of sugar beet, showing how strongly the value chain depends on cane cultivation scale and crushing capacity. In trade and balance terms, USDA’s latest shows world centrifugal sugar production around 180.968 million metric tons in 2024/25, while human domestic consumption is about 175.772 million metric tons—a spread that influences inventory building, pricing, and export availability.
Key driving factors are demand resilience in mass-market processed foods, growth in food service, and the “sweetness + functionality” role that nutritive sweeteners provide in bakery, dairy, confectionery, sauces, and beverages. At the same time, the sector is increasingly shaped by policy and public-health signals. WHO recommends reducing “free sugars” intake to <10% of total energy intake, which pushes manufacturers to reformulate and resize sugar usage across portfolios.
- The World Health Organization (WHO) and other public health bodies advocate sugar-reduction policies and fiscal measures such as sugar-sweetened beverage (SSB) taxes in over 115 Member States to discourage excessive sugar consumption and promote healthier diets, thereby incentivizing product reformulations and alternative sweetener adoption in industrial use. WHO guidelines also recommend limiting free sugar intake to less than 10% of total energy intake for adults and children, which has accelerated industry reformulation efforts.
Industrial scenario and dynamics are shaped by both demand-side shifts and regulatory pressures. Rising consumer health awareness regarding caloric intake, obesity, and diabetes has encouraged food manufacturers to reformulate products with reduced added sugars or balanced nutritive sweetener blends, often incorporating lower-glycemic alternatives. Concurrently, high-fructose corn syrup (HFCS), a major nutritive sweetener, has been observed to grow regionally — the HFCS market globally was projected to grow from approximately USD 5.9 billion in 2019 to USD 7.6 billion by 2024 — reflecting competitive positioning with sucrose, especially where price incentives exist.
Key Takeaways
- Nutritive Sweetener Market size is expected to be worth around USD 42.5 Billion by 2034, from USD 24.9 Billion in 2024, growing at a CAGR of 5.5%.
- Fructose held a dominant market position, capturing more than a 31.5% share.
- Conventional held a dominant market position, capturing more than a 72.4% share.
- Food Processing held a dominant market position, capturing more than a 37.8% share.
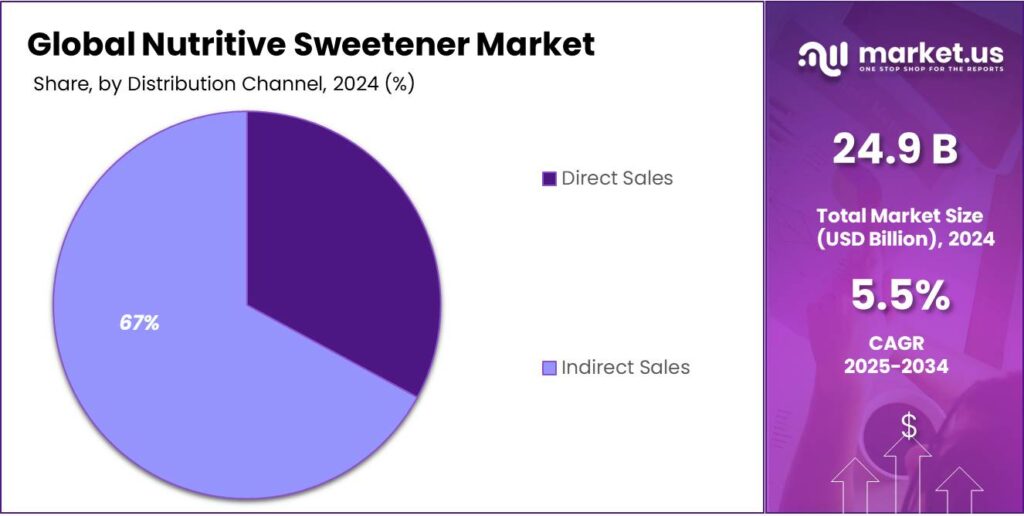
- direct Sales held a dominant market position, capturing more than a 67.3% share.
- Asia Pacific nutritive sweetener market remained the dominant regional segment, accounting for 43.20% of global revenue and an estimated US$10.7 billion.
By Product Type Analysis
Fructose leads with a 31.5% share, supported by strong use in beverages and processed foods
In 2024, Fructose held a dominant market position, capturing more than a 31.5% share. This leadership was driven by its high sweetness level and good solubility, which made it widely used in soft drinks, fruit-based beverages, bakery items, and packaged foods. Fructose was preferred by manufacturers because it enhanced flavor while allowing lower usage volumes compared to standard sugar.
Steady demand from the food and beverage industry supported consistent consumption. In 2025, usage remained stable as producers continued to rely on fructose for taste consistency and cost efficiency in large-scale food formulations, maintaining its strong position in the nutritive sweetener market.
By Nature Analysis
Conventional sweeteners lead with a 72.4% share, driven by large-scale food production and cost efficiency
In 2024, Conventional held a dominant market position, capturing more than a 72.4% share. This dominance was mainly supported by the widespread use of conventional sweeteners in packaged foods, beverages, and confectionery products, where consistency, availability, and pricing stability were critical. Food manufacturers continued to rely on conventional options due to well-established supply chains and predictable performance in processing.
Demand remained strong from mass-market food and beverage producers. In 2025, the segment maintained its leading position as conventional sweeteners continued to be preferred for large-volume applications where cost control and reliable sourcing were key priorities.
By End Use Analysis
Food processing leads with a 37.8% share, supported by high-volume demand and product formulation needs
In 2024, Food Processing held a dominant market position, capturing more than a 37.8% share. This leadership was driven by the large-scale use of nutritive sweeteners in bakery items, confectionery, dairy products, sauces, and ready-to-eat foods, where sweetness, texture, and shelf stability are essential. Food processors favored these sweeteners for their reliable performance during heating and storage.
Steady consumption of packaged and convenience foods supported consistent demand. In 2025, the segment continued to maintain its strong position as manufacturers focused on flavor consistency and cost-effective formulations across mass-produced food products.
By Distribution Channel Analysis
Direct sales dominate with a 67.3% share, driven by bulk procurement and long-term supplier contracts
In 2024, direct Sales held a dominant market position, capturing more than a 67.3% share. This dominance was mainly supported by large food and beverage manufacturers purchasing nutritive sweeteners directly from producers to secure consistent quality, stable pricing, and uninterrupted supply. Direct sales reduced intermediary costs and allowed better control over volume contracts and delivery schedules.
Long-term supply agreements strengthened this channel, especially for high-volume users. In 2025, direct sales continued to lead as manufacturers prioritized efficiency, cost management, and closer supplier relationships in the nutritive sweetener market.
Key Market Segments
By Product Type
- Fructose
- Sucrose
- Corn Sugar
- Honey
- High Fructose Corn Syrup
By Nature
- Organic
- Conventional
By End Use
- Household/Retail
- Food Processing
- Bakery
- Confectionery
- Beverages
- Pharmaceuticals
By Distribution Channel
- Direct Sales
- Indirect Sales
Emerging Trends
Less sugar, same taste” reformulation is the latest trend reshaping how brands use nutritive sweeteners
The clearest latest trend in nutritive sweeteners is not a sudden shift away from sweetness—it is steady reformulation to reduce added sugars while keeping the familiar taste and texture people expect. This trend is being pushed by government rules, school-meal standards, and clearer labeling that makes sugar easier to compare. As a result, many companies now redesign recipes to use smaller, smarter amounts of nutritive sweeteners instead of relying on high sugar loads.
A strong example is what happened in the UK after the Soft Drinks Industry Levy (SDIL). The UK government reported that between 2015 and 2019, around 65% of soft drinks that were above 5 g sugar per 100 mL reformulated to below 5 g/100 mL, raising the share of drinks under that level to 89%. Over a longer period, this delivered a 47% average reduction in sugar in soft drinks in scope of the levy between 2015 and 2024. This is an important “latest trend” signal: brands are not just launching new low-sugar products—they are changing the core recipes of everyday, high-volume items.
This reformulation trend is still accelerating because rules keep tightening. In late 2025, the UK announced it will lower the threshold from 5 g to 4.5 g total sugar per 100 mL, and remove exemptions for certain pre-packaged milk-based drinks from 1 January 2028. The same announcement said the changes are expected to raise up to £45 million annually from 2028. For manufacturers, that means “do nothing” becomes expensive. The practical response is more reformulation, more sugar reduction work, and more careful use of nutritive sweeteners so products stay below new cut-offs.
In the U.S., the trend is being reinforced through both labels and public meal programs. The FDA states the Daily Value for added sugars is 50 grams per day based on a 2,000-calorie diet, and it explains that the Dietary Guidelines recommend limiting added sugars to less than 10% of total daily calories—making “Added Sugars” a key line on the Nutrition Facts label. When a shopper can quickly see added sugars in grams and percent, brands feel pressure to bring those numbers down without hurting taste. That often means reducing sugar grams per serving, using sweetness blends, and adjusting ingredients that affect mouthfeel and shelf life.
Drivers
Government sugar-cut rules are pushing brands to reformulate—and that’s lifting demand for nutritive sweeteners
A major driver for the nutritive sweetener market is the steady push from governments and health agencies to cut “free” or “added” sugars in everyday diets. When public guidance becomes clearer, food companies react fast—because labels, taxes, and consumer expectations start changing at the same time. For example, the World Health Organization (WHO) recommends keeping free sugars below 10% of total energy intake, and suggests aiming for below 5% for extra health benefits.
This policy direction matters because today’s sugar intake is still high in many countries, especially through packaged foods and sweetened drinks. In the U.S., CDC reports that adults (age 20+) consumed an average of about 17 teaspoons of added sugar per day in 2017–2018. That is far above what many health authorities consider a practical limit for daily habits. When a gap like this is widely published, it becomes a reason for action—schools, hospitals, workplaces, and retailers increasingly set nutrition standards, and brands must adapt to keep shelf space and contracts.
Labelling rules also strengthen this driver because they make sugar easier to “see.” In the U.S., FDA guidance highlights that the Daily Value for added sugars is 50 grams per day on a 2,000-calorie diet, and added sugars are listed on the Nutrition Facts label so people can compare products quickly. In real buying situations, that extra line on the label can be enough to push shoppers toward products that look lower in added sugars—so brands often respond with reformulation rather than losing volume.
- Taxes and reformulation programs are another strong proof point. The UK Soft Drinks Industry Levy (SDIL) is designed around sugar thresholds—drinks above 8 g sugar per 100 mL face a higher levy, and those between 5–8 g per 100 mL face a lower levy. The result is not just theory: the UK government reports that around 65% of soft drinks that were above 5 g/100 mL reformulated to below 5 g/100 mL between 2015 and 2019, and that sugar in levy-scope soft drinks fell by an average of 47% between 2015 and 2024.
Restraints
Health-led sugar limits and warning-style labeling are holding back nutritive sweetener demand
One major restraining factor for nutritive sweeteners is the growing public-health push to reduce calorie-added sugars in everyday foods and drinks. Nutritive sweeteners still deliver sweetness, but they also add energy. As more guidelines, labels, and meal standards focus on “added sugars,” many brands reformulate away from caloric sweetness wherever they can.
At the global level, the World Health Organization recommends reducing “free sugars” to less than 10% of total energy intake, with a further reduction to below 5% linked to additional health benefits. When a benchmark like this becomes widely quoted by policymakers and public health programs, companies see a clear signal: products heavily reliant on nutritive sweeteners face more pressure to change.
The restraint becomes stronger because current intake is still high, which keeps sugar reduction on the agenda. The U.S. Centers for Disease Control and Prevention (CDC) reports that in 2017–2018 the average daily intake of added sugars was about 17 teaspoons for adults aged 20+. Numbers like these make “cut sugar” a mainstream goal, not a niche diet trend. That reduces the growth runway for products that depend on caloric sweetening.
Government labeling and nutrition rules amplify the same restraint. The U.S. FDA explains that the Dietary Guidelines recommend keeping added sugars under 10% of total calories per day, and the Nutrition Facts label lists “Added Sugars” to help people make choices. It also notes that on a 2,000-calorie diet, 50 g of added sugars equals that 10% level.
Public procurement standards can directly limit nutritive sweetener use in institutional food. In the U.S., USDA has moved to limit added sugars in school meals for the first time, with requirements rolling in from the 2025–2026 school year and a cap of no more than 10% of weekly calories by fall 2027. These meals serve nearly 30 million lunches and more than 15 million breakfasts daily.
Opportunity
Ethanol blending programs are expanding sugarcane processing—and opening new, bigger channels for nutritive sweeteners
One clear growth opportunity for nutritive sweeteners is coming from the way major sugar-producing countries are expanding and modernizing sugarcane supply chains to serve both food demand and fuel demand. When governments support ethanol blending, mills invest in better crushing capacity, storage, logistics, and quality systems. That same upgraded infrastructure also helps the food industry because it improves the supply of refined sugar, liquid sweeteners, and sugar-derived ingredients used in beverages, bakery, dairy, confectionery, and sauces.
You can see the demand base is still large and rising. USDA’s Foreign Agricultural Service (FAS) estimates total world centrifugal sugar human consumption at about 175.772 million metric tons in 2024/25, increasing to about 178.113 million metric tons in 2025/26. Even a modest increase at this scale is meaningful because it translates into steady purchasing from food and beverage manufacturers, especially in high-volume categories where nutritive sweeteners also add bulk, mouthfeel, browning, and shelf-life—not just sweetness.
- India is a strong example of how policy can create new runway. In a government note on India’s ethanol program, the Press Information Bureau (PIB) highlighted achieving 15% ethanol blending in 2024 and a national target of 20% by 2025. It also quantified program outcomes such as foreign exchange savings of ₹1,06,072 crore and CO₂ reduction of 544 lakh metric tons (as presented by PIB). Separately, PIB reported that during ESY 2024–25, public sector oil marketing companies achieved an average ethanol blending of 19.05% as of 31.07.2025, and 19.93% in July 2025.
For the nutritive sweetener value chain, this matters because ethanol blending encourages mills to run more reliably and plan longer-term. That improves the predictability of cane-based feedstocks like molasses and syrups used for food-grade applications. It also supports investment in better quality control—important for multinational food brands that need consistent specs across regions. USDA FAS data shows India’s sugar consumption itself is expected to rise to about 31.0 million metric tons in 2025/26, reflecting growing domestic food demand alongside these energy-driven supply-chain upgrades.
Regional Insights
Asia Pacific leads with 43.2% share and US$10.7 Bn in 2024, supported by rising demand for sweetened foods and beverage reformulation
In 2024, the Asia Pacific nutritive sweetener market remained the dominant regional segment, accounting for 43.20% of global revenue and an estimated US$10.7 billion, driven by large population bases, rapid urbanisation, and strong expansion of processed food and non-alcoholic beverage sectors. Manufacturers in the region responded to both classical sugar demand and reformulation needs by offering a broad mix of nutritive sweeteners—bulk sucrose, sugar syrups and sugar alcohols—so that food and beverage producers could balance cost, sweetness profile and mouthfeel in products ranging from confectionery to ready meals.
China and India provided the largest volume pools, while Southeast Asian markets showed faster year-on-year growth as retail modernisation and organised foodservice expanded. Health and regulatory signals influenced product mix: rising awareness of sugar-related health risks and growth in sugar-free product lines stimulated substitution toward lower-calorie nutritive options without sacrificing taste, particularly in beverages and dairy analogues.
Key Regions and Countries Insights
- North America
- US
- Canada
- Europe
- Germany
- France
- The UK
- Spain
- Italy
- Rest of Europe
- Asia Pacific
- China
- Japan
- South Korea
- India
- Australia
- Rest of APAC
- Latin America
- Brazil
- Mexico
- Rest of Latin America
- Middle East & Africa
- GCC
- South Africa
- Rest of MEA
Key Players Analysis
Cargill Inc. is a leading player in the nutritive sweetener market with a strong presence in corn-based sweeteners. In 2024, Cargill reported total company revenue of around US$165 billion, with sweeteners supplying beverages, bakery, and confectionery industries across 70+ countries through integrated supply chains.
Showa Sangyo is an established Japanese producer of food ingredients, including nutritive sweeteners. In 2024, the company recorded annual sales of approximately ¥160 billion, with sweetener products supporting domestic food processors. Its operations focused on stable supply, quality control, and long-term partnerships in Japan.
COFCO International is a key global agribusiness player supplying raw materials for nutritive sweeteners. In 2024, the company handled agricultural trade volumes above 130 million metric tons, supporting sweetener production across Asia and global markets. Its scale and sourcing network ensured cost-efficient and reliable supply.
Top Key Players Outlook
- Tate & Lyle
- Cargill Inc.
- Showa Sangyo
- Japan Corn Starch Co.
- COFCO International
Recent Industry Developments
In 2024 Tate & Lyle, the group reported total revenue of £1,647 million for the year ended 31 March 2024, with its Food & Beverage Solutions segment contributing £1,359 million of that figure, showing how central these ingredients businesses have become to the firm’s performance.
In 2024, Cargill recorded US $160 billion in total revenues, down from US $177 billion in fiscal 2023 as commodity markets remained soft and global supply conditions fluctuated, showing the scale of the company’s food ingredient and agricultural footprint that includes sweetener-related products among other portfolios.
Report Scope
Report Features Description Market Value (2024) USD 24.9 Bn Forecast Revenue (2034) USD 42.5 Bn CAGR (2025-2034) 5.5% Base Year for Estimation 2024 Historic Period 2020-2023 Forecast Period 2025-2034 Report Coverage Revenue Forecast, Market Dynamics, Competitive Landscape, Recent Developments Segments Covered By Product Type (Fructose, Sucrose, Corn Sugar, Honey, High Fructose Corn Syrup), By Nature (Organic, Conventional), By End Use (Household/Retail, Food Processing, Bakery, Confectionery, Beverages, Pharmaceuticals), By Distribution Channel (Direct Sales, Indirect Sales) Regional Analysis North America – US, Canada; Europe – Germany, France, The UK, Spain, Italy, Rest of Europe; Asia Pacific – China, Japan, South Korea, India, Australia, Singapore, Rest of APAC; Latin America – Brazil, Mexico, Rest of Latin America; Middle East & Africa – GCC, South Africa, Rest of MEA Competitive Landscape Tate & Lyle, Cargill Inc., Showa Sangyo, Japan Corn Starch Co., COFCO International Customization Scope Customization for segments, region/country-level will be provided. Moreover, additional customization can be done based on the requirements. Purchase Options We have three licenses to opt for: Single User License, Multi-User License (Up to 5 Users), Corporate Use License (Unlimited User and Printable PDF) 
-
-
- Tate & Lyle
- Cargill Inc.
- Showa Sangyo
- Japan Corn Starch Co.
- COFCO International
Our Clients
- 170722
- Dec 2025


