
Global Nitrogen Trifluoride Market Size, Share and Report Analysis By Purity Level (High Purity, Standard Purity, Technical Grade), By Application (Semiconductor Chips, Flat Panel Displays, Solar Cells, Others), By End Use (Electronics, Telecommunications, Automotive, Aerospace, Others), By Distribution Channel ( Direct Sales, Distributors, Online Sales) , By Region and Companies - Industry Segment Outlook, Market Assessment, Competition Scenario, Trends and Forecast 2025-2035
- Published date: Mar 2026
- Report ID: 180243
- Number of Pages: 364
- Format:
-
keyboard_arrow_up
Quick Navigation
Report Overview
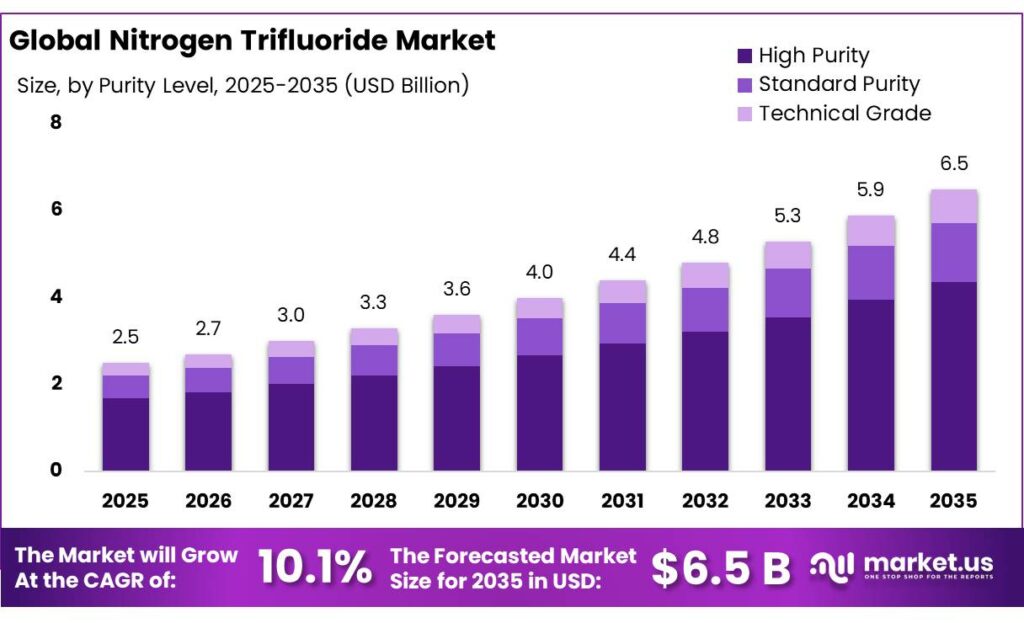
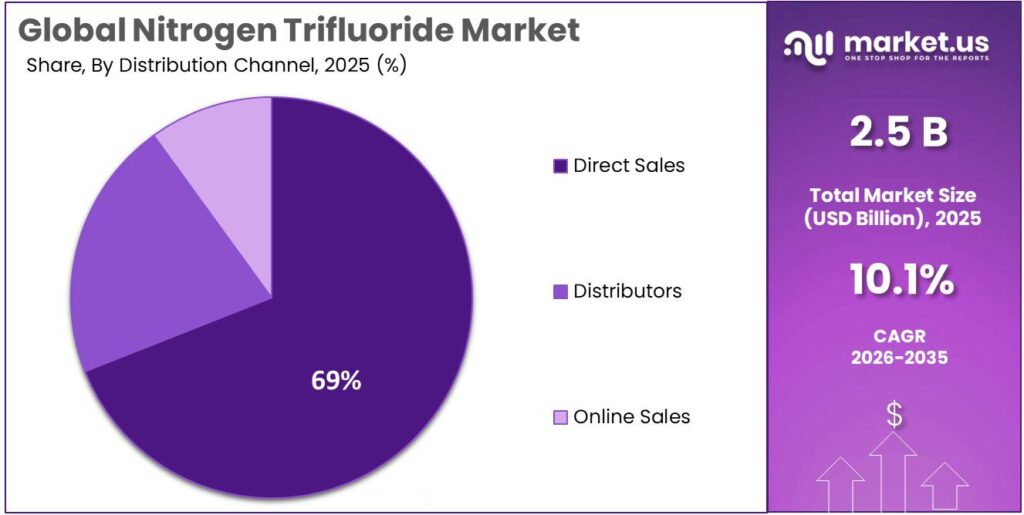
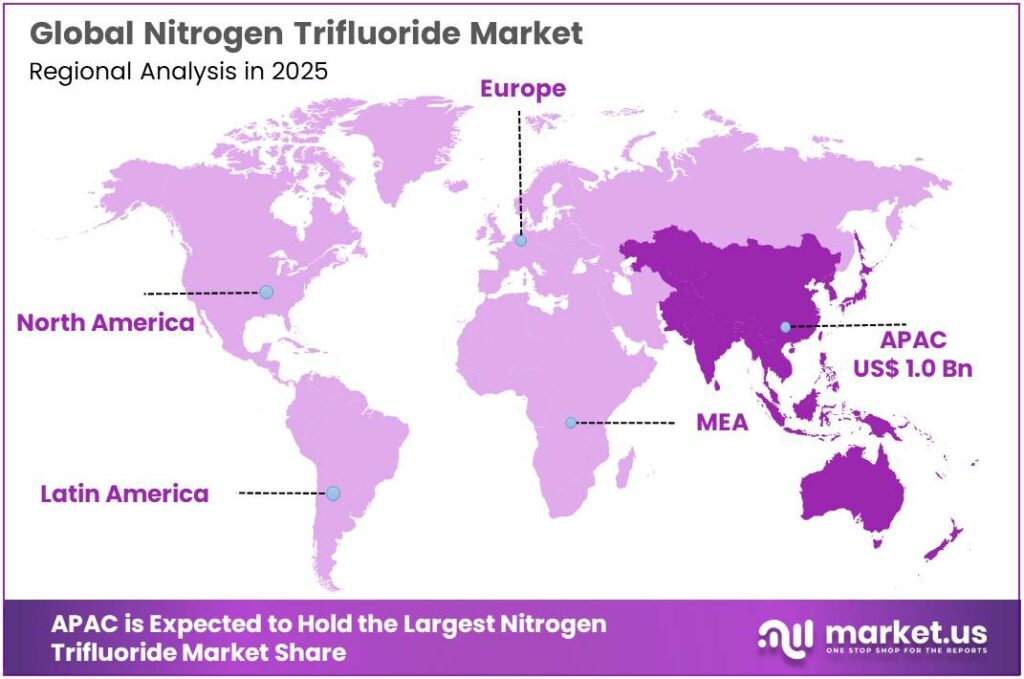
The Global Nitrogen Trifluoride Market is expected to be worth around USD 6.5 Billion by 2035, up from USD 2.5 Billion in 2025, at a CAGR of 10.1% from 2026 to 2035. The Asia Pacific segment maintained 43.7%, supporting a Nitrogen Trifluoride value of USD 1.0 Bn.
Nitrogen trifluoride (NF₃) is a high-purity specialty gas primarily used in electronics manufacturing as an in-situ/remote plasma cleaning and etching gas for chemical vapor deposition (CVD) and related process tools, as well as in certain flat-panel display and photovoltaic (PV) manufacturing steps. Industrial adoption has been supported by high utilization in chamber cleaning applications—reported in the ~85–99% range in plasma-based processes—helping fabs reduce per-clean gas consumption and tool wear versus some legacy perfluorocarbon chemistries.
 From an industrial scenario perspective, NF₃ demand tends to track semiconductor fab utilization, technology-node transitions, and the buildout of new wafer capacity (including logic, memory, and advanced packaging lines that expand overall deposition/cleaning intensity). The sector is in a capex upcycle supported by both market pull and policy push: the U.S. CHIPS and Science Act appropriates $52.7 billion for semiconductor manufacturing, R&D, and workforce programs, while the EU Chips Act targets public investment of more than €43 billion.
Key driving factors include the accelerating scale of global chip demand and the associated expansion of wafer starts. Industry bodies reported global semic onductor sales of $791.7 billion in 2025, underlining the volume growth that typically increases consumption of process gases across deposition and cleaning steps. In parallel, WSTS reported the market reached $346 billion in the first half of 2025, reflecting continued momentum in logic and memory categories that are intensive users of CVD/ALD toolsets where NF₃ cleaning is common.
Regulatory and ESG considerations are an equally important demand-shaping force. NF₃ is a highly potent greenhouse gas; the IPCC AR6-aligned GWP tables widely used in emissions accounting list NF₃ at a 100-year GWP of 17,400. NF₃ was also added to the list of gases under the Doha Amendment to the Kyoto Protocol, reinforcing monitoring and abatement expectations for emitting industries. These dynamics tend to increase adoption of point-of-use abatement, tighter leak management, and inventory transparency, influencing both NF₃ procurement specifications and total “cost-to-use.”
Key Takeaways
- Nitrogen Trifluoride Market is expected to be worth around USD 6.5 Billion by 2035, up from USD 2.5 Billion in 2025, at a CAGR of 10.1%.
- High Purity held a dominant market position, capturing more than a 67.4% share.
- Semiconductor Chips held a dominant market position, capturing more than a 56.2% share.
- Electronics held a dominant market position, capturing more than a 59.3% share.
- Direct Sales held a dominant market position, capturing more than a 69.1% share.
- Asia Pacific remained the dominating region in the Nitrogen Trifluoride (NF₃) market, holding 43.7% share and reaching around US$1.0 Bn.
By Purity Level Analysis
High Purity leads with 67.4% as chipmakers prioritize stable, contamination-free process gases.
In 2024, High Purity held a dominant market position, capturing more than a 67.4% share. This strength comes from how tightly NF₃ quality is linked to performance in semiconductor and display manufacturing, where even small impurities can affect yield, tool uptime, and consistency across high-volume runs.
Buyers in these industries typically prefer high-purity NF₃ because it supports cleaner chamber maintenance and more predictable plasma behavior, which helps reduce unplanned downtime and keeps production stable. In 2025, demand for the high-purity segment continued to stay firm as fabs focused on process control, tighter quality specs, and reliability in supply—especially for advanced and high-throughput lines where gas purity is treated as a non-negotiable input rather than a cost lever.
By Application Analysis
Semiconductor Chips stays on top with 56.2% as fabs keep expanding and cleaning cycles remain constant.
In 2024, Semiconductor Chips held a dominant market position, capturing more than a 56.2% share. This lead is mainly because NF₃ is closely tied to chip production workflows, especially for routine chamber cleaning and process steps that run nonstop in wafer fabs. As chipmakers push for higher output and tighter process control, they rely on consistent, high-performance cleaning gases to keep deposition tools stable and reduce downtime.
In 2025, the Semiconductor Chips segment continued to hold strong as fabs focused on utilization, node transitions, and improving yields—factors that naturally keep NF₃ consumption steady because cleaning frequency rises with production intensity.
By End Use Analysis
Electronics leads with 59.3% as high-volume manufacturing keeps NF₃ use steady and repeatable.
In 2024, Electronics held a dominant market position, capturing more than a 59.3% share. This dominance is closely linked to how widely NF₃ is used across electronics manufacturing processes that depend on plasma cleaning and controlled etching, especially in production environments where equipment must run with minimal interruption.
Electronics makers typically buy NF₃ to maintain tool efficiency, keep chambers clean between runs, and avoid yield losses that come from particle buildup or unstable process conditions. In 2025, the Electronics segment continued to remain strong as manufacturers focused on consistent output, better line utilization, and tighter quality checks—practical priorities that support steady consumption of NF₃ because cleaning and maintenance cycles are built into everyday production.
By Distribution Channel Analysis
Direct Sales leads with 69.1% as big buyers prefer straight-from-supplier supply and tighter control.
In 2024, Direct Sales held a dominant market position, capturing more than a 69.1% share. This channel stays ahead because NF₃ is not a casual purchase—it is a controlled specialty gas that many large customers want delivered under strict quality, safety, and documentation rules.
Direct buying also helps manufacturers lock in supply continuity, align deliveries with production schedules, and handle cylinder management more smoothly, which matters when plants run 24/7. In 2025, Direct Sales continued to hold strong as customers leaned toward longer supply arrangements, predictable pricing structures, and closer coordination on logistics and compliance, all of which are easier to manage when the supplier relationship is direct rather than routed through multiple intermediaries.
Key Market Segments
By Purity Level
- High Purity
- Standard Purity
- Technical Grade
By Application
- Semiconductor Chips
- Flat Panel Displays
- Solar Cells
- Others
By End Use
- Electronics
- Telecommunications
- Automotive
- Aerospace
- Others
By Distribution Channel
- Direct Sales
- Distributors
- Online Sales
Emerging Trends
NF₃ buying is shifting toward “low-emission use” with tighter reporting and stronger abatement
A clear latest trend in the Nitrogen Trifluoride (NF₃) space is the shift from simply buying a process gas to managing it as a climate-sensitive input. NF₃ remains useful for plasma cleaning in electronics manufacturing, but customers are putting much more attention on how much gas is actually destroyed in abatement systems, how leaks are controlled, and how emissions are calculated in carbon reporting. The reason is simple: NF₃ carries a very large climate impact on paper. The IPCC’s AR6 science lists an atmospheric lifetime of 569 years for NF₃, which keeps it in the atmosphere for centuries if released.
What is changing most in 2024–2025 is the accounting discipline around this gas. Many companies are moving to the latest IPCC AR6 global warming potential values, and the GHG Protocol’s updated reference table explicitly recommends using AR6 values. In that table, NF₃ is shown with a 100-year GWP of 17,400. When corporate teams apply these factors in annual emissions inventories, NF₃ quickly becomes a “high-attention line item,” even if the physical volumes look small.
U.S. government reporting data shows how this trend is playing out in real facilities. The U.S. EPA’s GHGRP sector page for electronics manufacturing reports 46 facilities in 2023 with total sector emissions of 5.5 million metric tons CO₂e. In the same table, emissions attributed to NF₃ were 0.5 million metric tons CO₂e in 2023, down from 0.7 million metric tons CO₂e in 2022.
Europe is also reinforcing the “control and phase-down mindset” around fluorinated greenhouse gases. The European Commission notes that Regulation (EU) 2024/573 (the revised F-gas regulation) was adopted in February 2024 and started applying from 11 March 2024, which signals tougher expectations for how fluorinated gases are handled across products, equipment, and reporting.
Drivers
Semiconductor manufacturing expansion is the single biggest demand engine for Nitrogen Trifluoride (NF₃)
The strongest driving factor for Nitrogen Trifluoride (NF₃) is the continued expansion of semiconductor chip manufacturing, because NF₃ is closely tied to the routine plasma cleaning and process steps used inside wafer fabs. As fabs add capacity or run existing tools harder, cleaning cycles do not go away—they usually become more frequent and more tightly controlled. That practical link between “more wafers processed” and “more chamber cleaning required” is why NF₃ demand tends to rise when the chip industry scales up.
The 2024–2025 chip cycle shows why this matters. Global semiconductor sales were reported at $630.5 billion in 2024, then jumped to $791.7 billion in 2025. This kind of growth is not just a headline number—it reflects higher production volumes and broader investment across logic and memory, which keeps fabs running at higher utilization and pushes procurement teams to secure steady supplies of critical process gases. When equipment uptime and yields are the priority, fabs tend to standardize inputs and reduce variability, which supports stable NF₃ consumption patterns rather than “buying only when needed.”
Government-backed manufacturing programs add another layer of momentum, because they encourage large, multi-year buildouts that lock in demand for fab inputs. In the United States, the CHIPS and Science Act provides the Department of Commerce $52.7 billion over five years, and the CHIPS Program Office is responsible for administering $39 billion in semiconductor incentives. In Europe, the European Commission stated the Chips Act would mobilize more than €43 billion in public and private investments.
A useful way to understand the “why now” is to look at how food systems indirectly support this same chip-driven story. Food production and distribution increasingly depend on electronics—automation, sensors, industrial controls, packaging lines, cold-chain monitoring, and data infrastructure. FAO’s projections indicate global food production will increase by 60% between 2005/07 and 2050 under its baseline scenario.
Restraints
Climate rules and emissions reporting are the biggest restraint because NF₃ has a very high climate impact
The most important restraining factor for Nitrogen Trifluoride (NF₃) is the growing pressure from climate regulation and corporate emissions reporting. NF₃ is extremely effective in electronics manufacturing, but it is also a potent greenhouse gas if it escapes into the air. The IPCC’s AR6 science lists an atmospheric lifetime of 569 years for NF₃ and a 100-year global warming potential (GWP100) of 17,400, which means small releases can carry a very large CO₂-equivalent footprint over time.
Policy and reporting frameworks reinforce this restraint. NF₃ was formally added to the basket of greenhouse gases under the Doha Amendment to the Kyoto Protocol, which signaled that governments consider it a tracked climate gas rather than an industrial “niche” material. On the corporate side, inventory rules also tightened: the GHG Protocol announced that NF₃ is required to be included in greenhouse-gas inventories under multiple standards.
A food-industry lens helps explain why this restraint is getting louder. Global food systems already face heavy climate attention because of waste and emissions, and those debates spill into broader climate policy and corporate reporting culture. FAO estimates that roughly one-third of food produced for human consumption is lost or wasted globally—about 1.3 billion tons.
There is also a wider climate-policy direction that makes fluorinated gases a sensitive topic. In Europe, the Commission describes stricter rules aimed at preventing emissions from fluorinated greenhouse gases and broader measures that signal a long-term move away from these categories where alternatives exist.
Opportunity
New semiconductor fabs and government-backed chip programs create the clearest growth runway for NF₃
One major growth opportunity for Nitrogen Trifluoride (NF₃) is the steady buildout of new semiconductor manufacturing capacity, especially where governments are actively pushing local chip production. NF₃ is closely linked to wafer fabrication because it is widely used in plasma cleaning routines that keep deposition tools running clean and stable. When a new fab comes online, it does not “try NF₃ once” and move on—cleaning and maintenance are built into daily production. That makes new fabs a long-term demand anchor, not a short-term spike.
The timing is supportive because the semiconductor industry itself expanded strongly in the last two years. Global semiconductor sales totaled $630.5 billion in 2024 and then rose to $791.7 billion in 2025, a 25.6% year-on-year increase As chip output grows, fabs typically focus on higher tool utilization and tighter process control, both of which reinforce regular use of high-performance chamber cleaning gases. In real purchasing terms, this trend favors suppliers that can deliver consistent quality, dependable logistics, and steady supply volumes—areas where NF₃ vendors can deepen relationships through long-term contracts and on-site support.
Government initiatives are adding fuel to this opportunity because they encourage multi-year, large-scale manufacturing expansion. In the United States, the CHIPS and Science Act provides $52.7 billion over five years, and the CHIPS Program Office is responsible for administering $39 billion in semiconductor incentives. In Europe, the European Chips Act is framed around mobilizing more than €43 billion in public and private investment to strengthen the region’s chip capacity and resilience.
A practical way to see the long-term pull is through the food economy’s push for efficiency and reliability. Even though NF₃ is not a food ingredient, food production and distribution are becoming more dependent on electronics—automation, sensors, packaging systems, cold-chain monitoring, and data infrastructure—all of which require semiconductors. FAO estimates that roughly one-third of food produced for human consumption is lost or wasted globally, amounting to about 1.3 billion tons.
Regional Insights
Asia Pacific dominates with 43.7% share and about US$1.0 Bn, backed by the region’s heavy chip manufacturing footprint.
Asia Pacific remained the dominating region in the Nitrogen Trifluoride (NF₃) market, holding 43.7% share and reaching around US$1.0 Bn. This leadership is closely tied to the region’s role as the world’s most active semiconductor manufacturing base, where NF₃ is routinely used for plasma chamber cleaning and related fab processes.
Demand strength in Asia is visible in broader semiconductor indicators: the Semiconductor Industry Association reported global semiconductor sales rising from US$630.5 billion (2024) to US$791.7 billion (2025), showing how strongly fab activity rebounded in 2025. As fabs in Asia ramped production to serve AI, memory, and consumer electronics supply chains, procurement for key process gases typically stayed steady because cleaning cycles are built into daily tool operation.
Key Regions and Countries Insights
- North America
- US
- Canada
- Europe
- Germany
- France
- The UK
- Spain
- Italy
- Rest of Europe
- Asia Pacific
- China
- Japan
- South Korea
- India
- Australia
- Rest of APAC
- Latin America
- Brazil
- Mexico
- Rest of Latin America
- Middle East & Africa
- GCC
- South Africa
- Rest of MEA
Key Players Analysis
Central Glass operates across chemical and functional materials, which supports electronics supply chains where high-spec inputs are required. In its latest disclosed financial snapshot, consolidated net sales for the nine months ended Dec. 31, 2025 were ¥104,521 million, showing the scale of operations behind its materials portfolio. For customers, this size typically translates into stronger capability around quality systems, plant reliability, and compliance documentation—areas that matter for specialty gases used in sensitive manufacturing environments. The company’s financial capacity also supports continued investments tied to electronics-linked materials demand.
Formosa’s strength is its large, integrated industrial base. The Formosa Plastics Group reported overall revenue of NT$2.1019 trillion in 2024 and pre-tax profit of NT$24.2 billion. This scale can be important in NF₃-related supply chains because large chemical groups tend to have strong upstream infrastructure, logistics depth, and operating discipline—useful when supporting high-volume electronics customers that need reliable deliveries and controlled product handling. Even when NF₃ is not the largest product line, the group’s balance-sheet scale supports supply continuity.
Kanto Denka is a Japan-based fluorochemical player serving industrial and electronics-facing applications. In its consolidated results for the fiscal year ended March 2024, the company reported net sales of ¥64,768 million, a 17.7% year-on-year decrease, reflecting how electronics cycles can impact specialty chemical demand. For NF₃ customers, this kind of performance context matters because it affects production planning, inventory decisions, and how aggressively a supplier invests in capacity and operational upgrades during downcycles.
Top Key Players Outlook
- Mitsui Chemicals Inc
- American Gas Group
- Central Glass Co. Ltd
- Formosa Plastics Corporation
- Kanto Denka Kogyo Co. Ltd
- SK Materials
- Foosung Co. Ltd
- HYOSUNG
- Linde plc
- Navin Fluorine International Limited
- OCI COMPANY Ltd.
Recent Industry Developments
In 2024, Mitsui Chemicals reported sales revenue of ¥1,809.2 billion and operating income before special items of ¥101.0 billion, so the NF₃ exit reads more like a portfolio choice driven by fit and returns than a lack of scale.
Formosa Plastics Group reported NT$2.1019 trillion in overall revenue in 2024 and NT$24.2 billion in pre-tax profit, showing the scale and financial capacity behind its chemical operations during that year.
Report Scope
Report Features Description Market Value (2025) USD 2.5 Bn Forecast Revenue (2035) USD 6.5 Bn CAGR (2026-2035) 10.1% Base Year for Estimation 2025 Historic Period 2020-2024 Forecast Period 2026-2035 Report Coverage Revenue Forecast, Market Dynamics, Competitive Landscape, Recent Developments Segments Covered By Purity Level (High Purity, Standard Purity, Technical Grade), By Application (Semiconductor Chips, Flat Panel Displays, Solar Cells, Others), By End Use (Electronics, Telecommunications, Automotive, Aerospace, Others), By Distribution Channel ( Direct Sales, Distributors, Online Sales) Regional Analysis North America – US, Canada; Europe – Germany, France, The UK, Spain, Italy, Rest of Europe; Asia Pacific – China, Japan, South Korea, India, Australia, Singapore, Rest of APAC; Latin America – Brazil, Mexico, Rest of Latin America; Middle East & Africa – GCC, South Africa, Rest of MEA Competitive Landscape Mitsui Chemicals Inc, American Gas Group, Central Glass Co. Ltd, Formosa Plastics Corporation, Kanto Denka Kogyo Co. Ltd, SK Materials, Foosung Co. Ltd, HYOSUNG, Linde plc, Navin Fluorine International Limited, OCI COMPANY Ltd. Customization Scope Customization for segments, region/country-level will be provided. Moreover, additional customization can be done based on the requirements. Purchase Options We have three licenses to opt for: Single User License, Multi-User License (Up to 5 Users), Corporate Use License (Unlimited User and Printable PDF)  Nitrogen Trifluoride MarketPublished date: Mar 2026add_shopping_cartBuy Now get_appDownload Sample
 -
-
- Mitsui Chemicals Inc
- American Gas Group
- Central Glass Co. Ltd
- Formosa Plastics Corporation
- Kanto Denka Kogyo Co. Ltd
- SK Materials
- Foosung Co. Ltd
- HYOSUNG
- Linde plc
- Navin Fluorine International Limited
- OCI COMPANY Ltd.
Our Clients
- 180243
- Mar 2026


