
Global Microspheres Market Size, Share Analysis Report By Product (Hollow Microspheres, Solid Microspheres), By Material (Glass, Polymer, Ceramic, Fly Ash, Metallic), By Application (Construction Composites, Healthcare and Biotechnology, Paints And Coatings, Cosmetics And Personal Care, Oil And Gas, Automotive, Others) , By Region and Companies - Industry Segment Outlook, Market Assessment, Competition Scenario, Trends and Forecast 2025-2034
- Published date: Jan 2026
- Report ID: 174121
- Number of Pages: 341
- Format:
-
keyboard_arrow_up
Quick Navigation
Report Overview
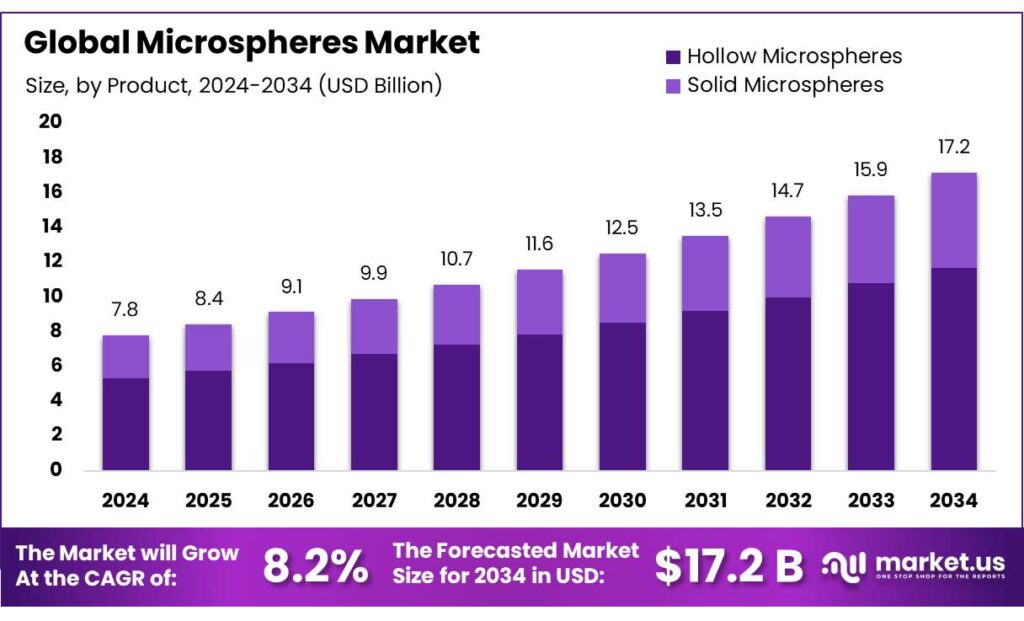
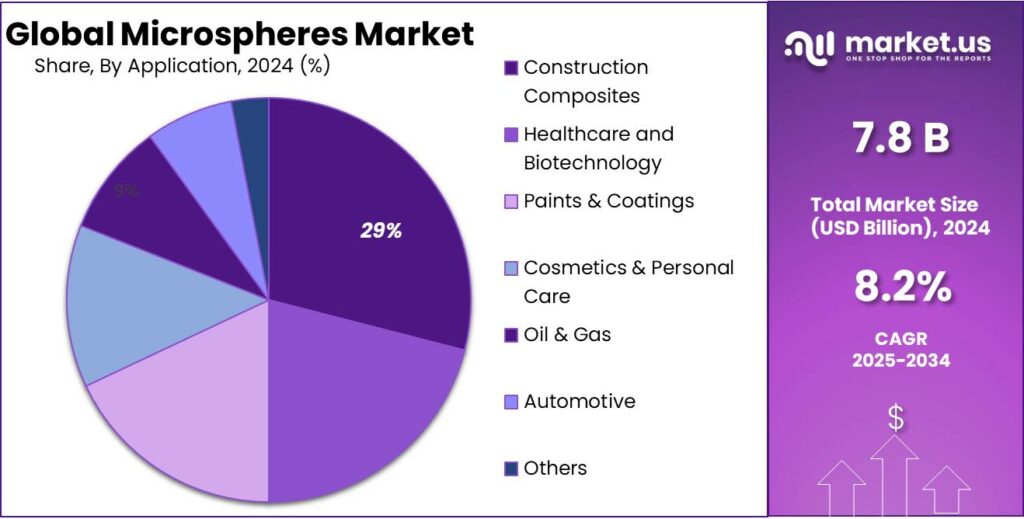
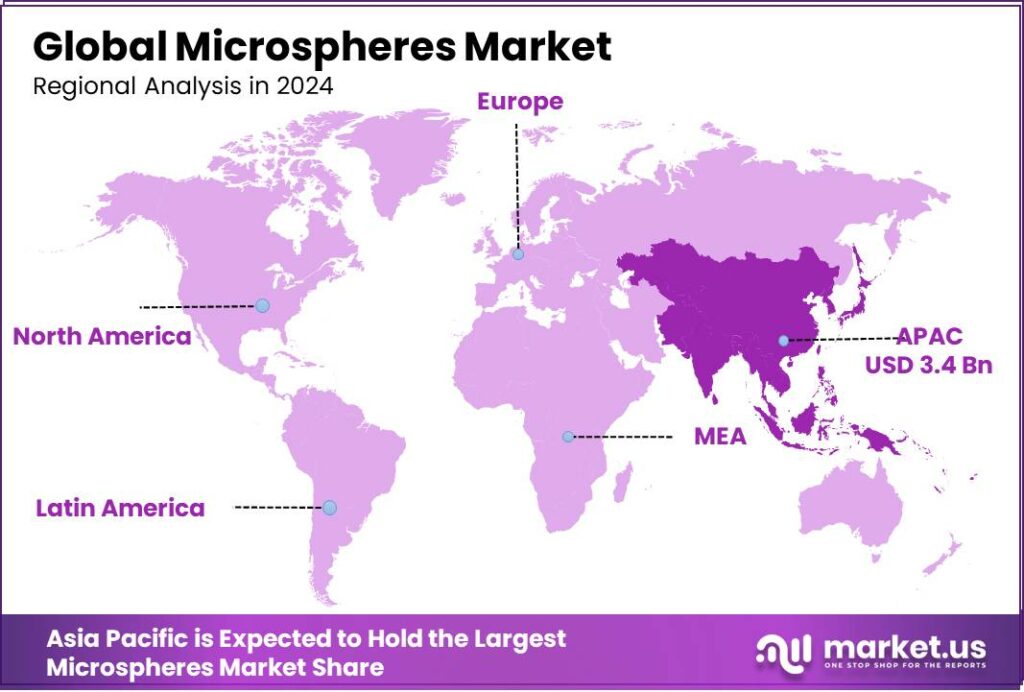
Global Microspheres Market size is expected to be worth around USD 17.2 Billion by 2034, from USD 7.8 Billion in 2024, growing at a CAGR of 8.2% during the forecast period from 2025 to 2034. In 2024 Asia Pacific held a dominant market position, capturing more than a 44.2% share, holding USD 3.4 Million in revenue.
Microspheres are engineered, near-perfect spherical particles—typically 1–1,000 microns—made from glass, polymers, ceramics, or bio-based materials. In industry, they are valued because “small geometry” creates outsized performance: they can lower density, tune viscosity, improve insulation, and act as carriers for controlled release. For example, hollow glass microspheres are produced as thin-walled, low-density particles that can survive processing and remain chemically stable, enabling lightweighting without sacrificing performance.
Across the industrial landscape, microspheres sit inside everyday formulations rather than being a standalone end product. In paints, coatings, adhesives, and composites, hollow glass grades are used to reduce weight and help manage surface/finish issues. Product specifications show why: a representative grade lists a typical density of 0.25 g/cc with crush strength of 750 psi, while another lists 0.32 g/cc with 2,000 psi crush strength—important for mixing, pumping, and durability in demanding applications. Oil-and-gas buoyancy modules and deep-water insulation also lean on these strength-to-weight properties.
A key demand driver is efficiency-led lightweighting. Government energy programs highlight that reducing a vehicle’s weight by 10% can improve fuel economy by 6%–8%, which keeps OEMs and material suppliers searching for practical weight reduction routes across plastics, sealants, body fillers, and specialty composites—areas where microspheres are a proven lever.
Regulation is reshaping polymer microsphere choices: the EU’s 2023 restriction on intentionally added microplastics was built on estimates that more than 42,000 tonnes of intentionally present microplastics are released to the environment annually, pushing manufacturers toward alternative materials, improved containment, or redesign.
In food and nutrition-linked uses, microspheres are often discussed through microencapsulation—protecting sensitive nutrients, masking taste, and improving stability through processing and storage. The “why” is visible in public-health and food-security numbers: WHO reports 30.7% prevalence of anaemia among women aged 15–49 in 2023, strengthening the case for scalable fortification formats that keep iron and vitamins stable in real supply chains.
India’s fortification approach illustrates the industrial pathway: the government notes rice is staple for about 65% of the population, while foodgrain distribution programs reach 78.90 crore beneficiaries; India’s fortification regulations specify iron addition in the range of 28–42.5 mg per kg, creating a large, standards-driven demand base for stable delivery technologies.
- Government and industry initiatives reinforce these pull factors. UNEP’s SDG 12.3 mandate aims to halve per-capita food waste by 2030, and its report highlights real-world reductions such as 31% in Japan and 18% in the United Kingdom under structured reporting and public–private programs.
Key Takeaways
- Microspheres Market size is expected to be worth around USD 17.2 Billion by 2034, from USD 7.8 Billion in 2024, growing at a CAGR of 8.2%.
- Hollow Microspheres held a dominant market position, capturing more than a 68.4% share.
- Glass held a dominant market position, capturing more than a 39.9% share in the microspheres market.
- Construction Composites held a dominant market position, capturing more than a 29.3% share in the microspheres market.
- Asia Pacific led the microspheres market with 44.20% share, valued at USD 3.4 Bn.
By Product Analysis
Hollow Microspheres dominate with a 68.4% share due to lightweight performance and material efficiency advantages.
In 2024, Hollow Microspheres held a dominant market position, capturing more than a 68.4% share. This leadership reflects their strong adoption across coatings, composites, construction materials, automotive parts, and specialty packaging, where weight reduction and performance balance matter most.
Hollow microspheres help manufacturers lower density without compromising strength, which directly supports fuel efficiency targets, easier handling, and reduced material consumption. Their ability to improve thermal insulation, surface smoothness, and dimensional stability makes them a preferred choice in value-added formulations. As industries continue to focus on cost control and functional performance, hollow microspheres remain integral to product optimization strategies.
By Material Analysis
Glass microspheres dominate with a 39.9% share due to strength, consistency, and wide industrial usability.
In 2024, Glass held a dominant market position, capturing more than a 39.9% share in the microspheres market. This dominance is largely driven by the material’s reliable mechanical strength, chemical stability, and uniform particle structure, which suit demanding industrial applications. Glass microspheres are widely used in construction materials, paints and coatings, automotive components, and industrial fillers, where durability and surface finish are critical. Their ability to enhance compressive strength while maintaining lightweight characteristics makes them valuable for manufacturers aiming to improve product performance without increasing material usage.
By Application Analysis
Construction composites lead with a 29.3% share driven by durability and lightweight building needs.
In 2024, Construction Composites held a dominant market position, capturing more than a 29.3% share in the microspheres market. This strong position is linked to rising use of advanced composite materials in modern construction, where strength-to-weight balance is essential. Microspheres are widely incorporated into construction composites to reduce overall material weight while maintaining structural integrity. They also improve thermal insulation, crack resistance, and surface finish, which supports longer service life for buildings and infrastructure. These performance benefits make microspheres a practical choice for large-scale construction and renovation projects.
Key Market Segments
By Product
- Hollow Microspheres
- Solid Microspheres
By Material
- Glass
- Polymer
- Ceramic
- Fly Ash
- Metallic
By Application
- Construction Composites
- Healthcare and Biotechnology
- Paints & Coatings
- Cosmetics & Personal Care
- Oil & Gas
- Automotive
- Others
Emerging Trends
Reusable and recycling-ready food packaging design
A clear latest trend in the microspheres market is the shift toward packaging designs that must be reusable or easier to recycle, especially for food logistics. Brands still want lighter packs and better protection, but now they also need formats that fit tightening policy goals. In Europe, the updated packaging framework summarized by EUR-Lex sets reuse targets that directly influence material choices: by 2030, 40% of transport packaging must be reusable, and beverage distributors must ensure 10% of products are in reusable packaging by 2030.
This trend is also tied to food loss and waste targets, because better packaging performance is one of the fastest levers companies can pull. FAO notes that around 14% of the world’s food, valued at about USD 400 billion per year, is lost after harvest and before reaching retail, while about 17%—around 931 million tonnes—is wasted at retail and by consumers. UNEP’s Food Waste Index Report 2024 adds more recent measurement detail, estimating 1.05 billion tonnes of food wasted in 2022, and that roughly 19% of food available to consumers goes to waste.
- Instead of adding microspheres wherever performance is needed, product teams are increasingly testing whether the formulation still works inside the rules of circular packaging. In the U.S., the national direction is similar: EPA’s 2030 goal aims to reduce food waste by 50%, down to 164 pounds per person, and federal agencies have issued strategies to drive progress toward that target.
This pushes brands to invest in packaging that protects food and prevents waste, but also to avoid materials that are likely to be penalized later by recyclability requirements or extended producer responsibility costs. So, the latest trend is smarter microsphere use: choosing grades and loading levels that deliver lightweighting and toughness while supporting reuse durability and “recycling-ready” packaging designs.
Drivers
Lightweight, longer-lasting food packaging demand
Microspheres are gaining demand because food brands are under pressure to ship more products safely, with less material, and with better shelf stability. A big part of this comes from the scale of food moving through modern supply chains and the cost of losses. The UN notes that about 13.2% of food produced is lost between harvest and retail, and an estimated 19% of total global food production is wasted in households. When food companies try to cut damage, leakage, and spoilage, they invest in better packaging films, barrier coatings, and protective layers.
In 2024, this “do more with less” push is strongly linked to food waste reduction and efficiency goals set by governments and global bodies. The United Nations’ SDG 12.3 focuses on cutting food loss and waste, and the UN’s End Food Waste Day messaging keeps the topic active for regulators and brands. At the same time, the FAO has long highlighted the sheer magnitude of the challenge—roughly one-third of food produced for human consumption is lost or wasted globally, about 1.3 billion tonnes per year.
In 2025, the same driver is reinforced by urban lifestyles and longer distribution chains. The UN has reported that around 55% of the world’s population lives in urban areas today, and that share is expected to rise to 68% by 2050. More urban living usually means more reliance on packaged and transported food, including ready-to-eat and delivered formats, which increases the need for lightweight, protective packaging.
Restraints
Environmental and Recycling Challenges Slow Microspheres Adoption
One major factor holding back broader adoption of microspheres—especially in packaging, coatings, and food contact uses—is the growing concern over environmental impact and challenges in recycling complex materials. As food and consumer goods companies work to reduce waste and improve sustainability, they face strong pressure from governments, NGOs, and consumers to cut plastic pollution and improve recyclability of materials. In many regions, packaging that includes microspheres, particularly polymer-based or composite systems, can be harder to recycle through existing systems.
For example, the United Nations Environment Programme (UNEP) highlights that more than 400 million tonnes of plastic waste are generated each year, with only about 9% recycled, 12% incinerated, and the remainder ending up in landfills or the natural environment. This stark imbalance underlines why regulators and brands are pushing for material simplification, reduced use of mixed polymers, and designs that fit into existing recycling streams.
In 2024, many food packaging companies felt this tension acutely. The Food and Agriculture Organization of the United Nations (FAO) estimates that roughly 14% of the world’s food is lost between harvest and retail, with another 17% wasted at the consumer level. These figures drive investment in packaging that extends shelf life and protects food quality—roles where microsphere-enhanced films and composites can help. But at the same time, the environmental footprint of that packaging is being scrutinized.
Beyond regulations, public sentiment is shifting. Surveys show that more than 60% of consumers prefer products with easily recyclable packaging, even if cost is higher. Although microspheres deliver real technical benefits, the perception of “non-standard” materials can negatively impact brand trust in sustainability-focused markets. As a result, some companies delay or limit the use of microsphere-enhanced materials until clear recycling pathways are established.
Opportunity
Food loss and waste cuts create opportunity
One major growth opportunity for microspheres is the fast-rising focus on reducing food loss and waste through better packaging, insulation, and cold-chain performance. Food companies and retailers are being pushed to protect freshness for longer, ship products further, and still use less material. That pressure is backed by hard numbers: FAO highlights that around 13.2% of food is lost in the supply chain after harvest and before retail, and that food lost from harvest up to retail is about 14%, valued at roughly USD 400 billion. On the waste side, UNEP’s Food Waste Index points to 19% of food available to consumers going to waste, totaling about 1.05 billion tonnes in 2022, with households alone at 631 million tonnes.
The policy direction makes this opportunity bigger, not smaller. Globally, SDG Target 12.3 calls for halving per-capita food waste at retail and consumer levels and reducing losses along supply chains by 2030. Governments are also setting national targets that force action from industry. In the United States, EPA’s 2030 goal aims to reduce food waste by 50%, and it translates that ambition into a clear per-person outcome—down to 164 pounds per person.
In 2024 and into 2025, the “growth pocket” is strongest where food companies need measurable improvements but cannot afford heavy redesigns. That makes adoption easier for converters and packagers who want upgrades that are compatible with existing equipment. As food waste numbers like 1.05 billion tonnes and USD 400 billion stay in the spotlight, more companies will pay for material solutions that protect food better while using resources smarter, making food-protective packaging and cold-chain materials a clear growth opportunity for microspheres.
Regional Insights
Asia Pacific is the dominating region in the microspheres market, holding 44.20% share and valued at USD 3.4 Bn.
In 2024, Asia Pacific led the microspheres market with 44.20% share, valued at USD 3.4 Bn, because the region combines fast infrastructure build-out with the world’s deepest base of end-use manufacturing. Microspheres are used in lightweight construction materials, cementitious composites, insulation systems, and coatings—applications that scale quickly when road, housing, and industrial projects expand. India’s highway build program is one example of continued execution intensity: under Bharatmala, 18,926 km had been completed by 30 November 2024, reflecting the pace at which large material volumes move through the system.
In 2025, the region’s lead is reinforced by transportation and industrial production, where microspheres support lightweighting and surface-performance goals in automotive parts, paints, and polymer compounds. Asia Pacific’s scale advantage is visible in vehicle manufacturing: global motor vehicle production datasets consistently show the region’s large output base, which matters because microspheres are widely adopted in underbody coatings, interior trims, and composite fillers.
Key Regions and Countries Insights
- North America
- US
- Canada
- Europe
- Germany
- France
- The UK
- Spain
- Italy
- Rest of Europe
- Asia Pacific
- China
- Japan
- South Korea
- India
- Australia
- Rest of APAC
- Latin America
- Brazil
- Mexico
- Rest of Latin America
- Middle East & Africa
- GCC
- South Africa
- Rest of MEA
Key Players Analysis
Trelleborg AB integrates microspheres into engineered polymer and sealing solutions. In 2024, the group reported operations across 40+ countries and employed nearly 16,000 people. Microspheres help enhance lightweight performance and dimensional stability in industrial applications, especially in construction, transportation, and infrastructure-related components requiring long service life.
Sigmund Lindner GmbH is known for technical glass beads and microspheres used in industrial and specialty applications. In 2024, the company operated production sites in Europe, Asia, and North America with decades of manufacturing experience exceeding 70 years. Its microspheres support precision applications requiring uniformity, strength, and chemical resistance.
Chase Corp is active in specialty chemicals and performance materials where microspheres support insulation, protection, and bonding applications. As of 2024, the company managed multiple manufacturing facilities primarily across North America and generated revenue exceeding USD 1 billion. Microspheres contribute to improved processing efficiency and reduced material density in its advanced material solutions.
Top Key Players Outlook
- Akzo Nobel N.V.
- Trelleborg AB
- Chase Corp
- MO SCI, LLC
- Sigmund Lindner GmbH
- Momentive Performance Materials
- Potters Industries LLC
- DiaSorin S.p.A
- Matsumoto Yushi-Seiyaku Co. Ltd
- 3M Company
Recent Industry Developments
In 2024, AkzoNobel reported revenue near USD 11.5 B with its coatings and performance materials segments driving steady volume growth, and its performance coatings business contributing a significant portion of earnings through specialized, high-value applications.
Trelleborg, the company operated in 40 countries with about 16,782 employees and reported Sales of SEK 34,170 M in 2024, reflecting its broad industrial footprint and continued investment in technology and capacity expansion.
Report Scope
Report Features Description Market Value (2024) USD 7.8 Bn Forecast Revenue (2034) USD 17.2 Bn CAGR (2025-2034) 8.2% Base Year for Estimation 2024 Historic Period 2020-2023 Forecast Period 2025-2034 Report Coverage Revenue Forecast, Market Dynamics, Competitive Landscape, Recent Developments Segments Covered By Product (Hollow Microspheres, Solid Microspheres), By Material (Glass, Polymer, Ceramic, Fly Ash, Metallic), By Application (Construction Composites, Healthcare and Biotechnology, Paints And Coatings, Cosmetics And Personal Care, Oil And Gas, Automotive, Others) Regional Analysis North America – US, Canada; Europe – Germany, France, The UK, Spain, Italy, Rest of Europe; Asia Pacific – China, Japan, South Korea, India, Australia, Singapore, Rest of APAC; Latin America – Brazil, Mexico, Rest of Latin America; Middle East & Africa – GCC, South Africa, Rest of MEA Competitive Landscape Akzo Nobel N.V., Trelleborg AB, Chase Corp, MO SCI, LLC, Sigmund Lindner GmbH, Momentive Performance Materials, Potters Industries LLC, DiaSorin S.p.A, Matsumoto Yushi-Seiyaku Co. Ltd, 3M Company Customization Scope Customization for segments, region/country-level will be provided. Moreover, additional customization can be done based on the requirements. Purchase Options We have three licenses to opt for: Single User License, Multi-User License (Up to 5 Users), Corporate Use License (Unlimited User and Printable PDF) 
-
-
- Akzo Nobel N.V.
- Trelleborg AB
- Chase Corp
- MO SCI, LLC
- Sigmund Lindner GmbH
- Momentive Performance Materials
- Potters Industries LLC
- DiaSorin S.p.A
- Matsumoto Yushi-Seiyaku Co. Ltd
- 3M Company
Our Clients
- 174121
- Jan 2026


