


Report Overview
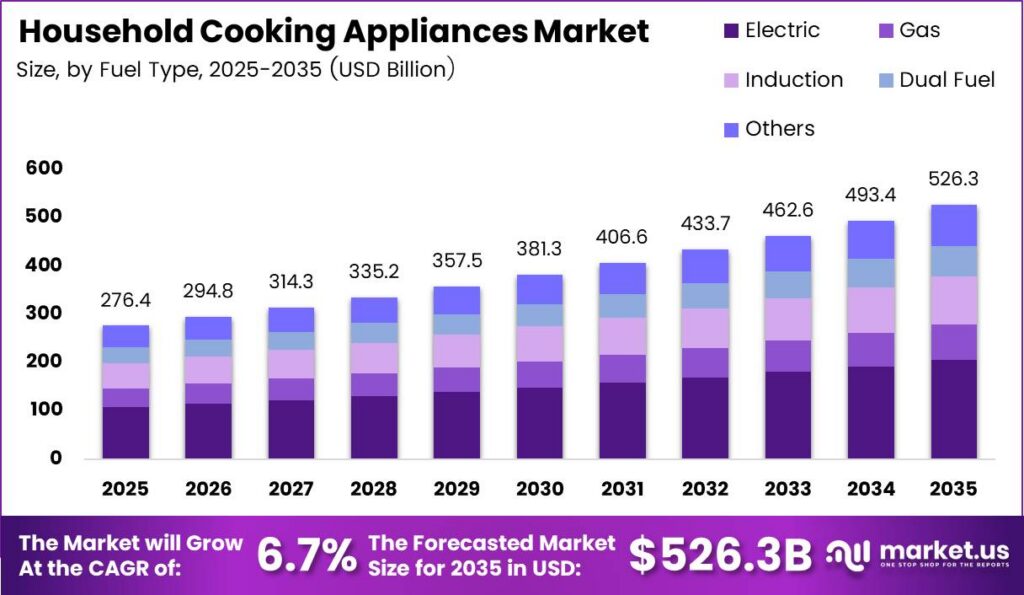
Global Household Cooking Appliances Market size is expected to be worth around USD 526.3 Billion by 2035 from USD 276.4 Billion in 2025, growing at a CAGR of 6.7% during the forecast period 2026 to 2035. Household cooking appliances prepare food through controlled heat, combining everyday utility with convenience and kitchen integration. These valuations represent planning estimates rather than independently validated market measurements.
Household cooking appliances serve residential kitchens through replacement purchases, first-time ownership, and coordinated kitchen installations rather than industrial food production. According to the U.S. Department of Energy, announced cooking-product standards could save consumers US$1.6 billion over 30 years. Lower lifetime operating costs strengthen the purchase case for efficient models, while manufacturers must balance component expense against price-sensitive household budgets and retailer margin requirements.
Key Takeaways
- Household Cooking Appliances Market size is expected to be worth around USD 526.3 Billion by 2035 from USD 276.4 Billion in 2025, growing at a CAGR of 6.7%
- Cooktops and Hobs hold an estimated 27.00% Product Type share in 2025.
- Electric appliances hold an estimated 39.00% Fuel Type share in 2025.
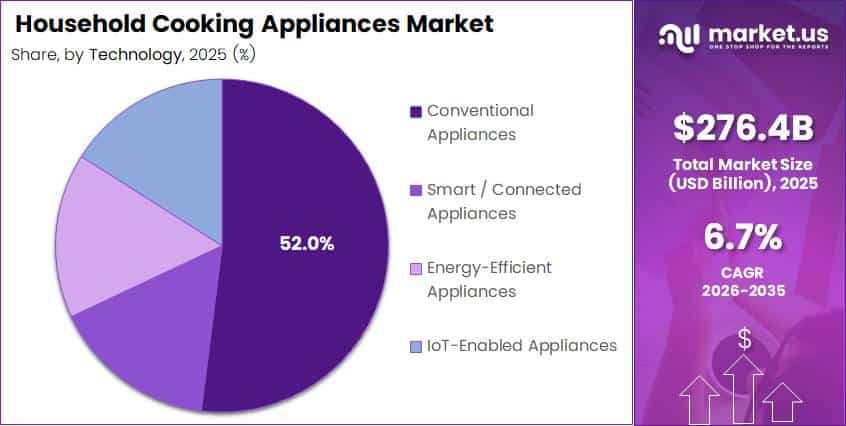
- Conventional Appliances hold an estimated 52.00% Technology share in 2025.
- Mid-Range products hold an estimated 45.00% Price Range share in 2025.
- Online Retail / E-Commerce accounts for an estimated 25.00% Distribution Channel share in 2025.
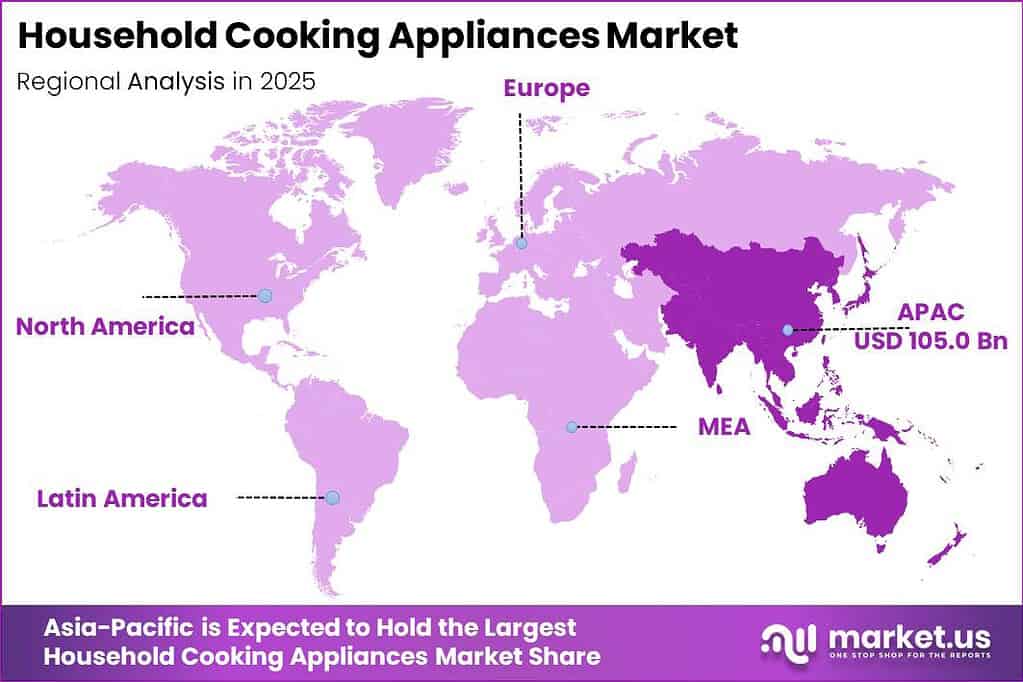
- Asia-Pacific leads with an estimated 38.00% share, valued at approximately USD 105.0 billion in 2025.
- The forecast period runs from 2026 to 2035.
Government-backed access programs create a different investment case from discretionary kitchen remodeling because they address households entering formal cooking-product channels. As reported by the International Energy Agency, annual African clean-cooking investment reached US$770 million in 2024. That capital supports fuel access, distribution, and equipment adoption rather than appliance sales alone, favoring suppliers with affordable products, local service coverage, and dependable procurement relationships.
Premium kitchen development increasingly combines cooking functions with digital interfaces, making software usefulness part of the hardware purchase decision for households. Data from LG shows its December 2024 Signature announcement included a microwave with three cameras and a 27-inch touchscreen. This product direction raises development costs and support obligations, so investors should assess practical cooking benefits rather than treating larger displays as automatic pricing power.
Asia-Pacific represents the leading regional position, with an estimated 38.00% share in 2025 and approximately USD 105.0 billion in revenue. Regional leadership makes product localization, dealer coverage, and affordable feature selection central commercial priorities rather than optional adaptations for later expansion. Investors should distinguish this planning allocation from independently measured regional sales, while testing whether distribution investment converts household access into profitable appliance purchases.
Product Type Analysis
Cooktops and Hobs dominate with an estimated 27.00% share in 2025 due to essential daily cooking and installation flexibility.
In 2025, Cooktops and Hobs held an estimated 27.00% share in the Product Type segment of the Household Cooking Appliances Market. Figures from the European Commission show hob rules saved approximately 2.3 TWh of primary energy in 2020. Direct heating makes heat-transfer efficiency central to operating costs, rewarding designs that reduce wasted energy. Suppliers can defend replacement demand through durable surfaces, practical controls, and compatibility with existing kitchens.
Cooking Ranges combine oven and surface cooking, making installation dimensions and household budgets central to replacement decisions across established residential kitchens. According to the U.S. Department of Energy, cooking-product standards could save 0.22 quadrillion BTU over 30 years of shipments. That estimate includes separate cooktops and ovens, so it indicates broader efficiency pressure rather than range-only savings. Manufacturers should prioritize shared components and predictable installation costs to protect margins.
Ovens serve buyers who value enclosed heat control, baking consistency, and coordinated kitchen layouts rather than basic surface cooking alone at home. As reported by the European Commission, oven measures could save EU users €1.4 billion in 2030. Better insulation and controlled heat circulation reduce energy losses during repeated cooking cycles. Suppliers can convert those operating benefits into stronger replacement propositions, provided purchase premiums remain clear and affordable.
Fuel Type Analysis
Electric dominates with an estimated 39.00% share in 2025 due to established household wiring and familiar controls.
In 2025, Electric held an estimated 39.00% share in the Fuel Type segment of the Household Cooking Appliances Market, requiring clear separation from induction. Data from Eurostat shows electricity supplied 51.6% of EU household cooking energy in 2023. That energy measure covers electric cooking broadly, not resistance-only appliance sales. Suppliers should separate fuel availability from heating technology when planning portfolios, because installation economics can outweigh differences in cooking features.
Gas appliances connect cooking-equipment purchases with fuel availability, cylinder distribution, and household preferences for visible flame control during everyday meal preparation at home. The International Energy Agency indicates LPG serves more than 70% of Africans with clean-cooking access. Reliable fuel delivery therefore supports equipment usefulness, while supply interruptions can weaken repeat purchases. Manufacturers should evaluate distribution partnerships and safety support alongside burner performance before entering new customer catchments.
Induction products compete through rapid pan heating, but buyers must consider cookware compatibility and the electrical requirements of their chosen installation. Based on U.S. Department of Energy data, tested induction products boiled water 20% to 40% faster than conventional alternatives. Electromagnetic heating transfers energy directly into compatible cookware, reducing the time spent heating surrounding structures. Retailers can improve conversion through demonstrations that explain both cooking speed and installation obligations.
Technology Analysis
Conventional Appliances dominate with an estimated 52.00% share in 2025 due to familiar operation and accessible purchase prices.
In 2025, Conventional Appliances held an estimated 52.00% share in the Technology segment of the Household Cooking Appliances Market within the forecast framework. Figures from the U.S. Department of Energy show approximately 97% of gas-stove models already met its announced 2024 efficiency levels. Established designs can satisfy efficiency requirements without elaborate digital interfaces. Manufacturers can therefore protect accessible price points while improving reliability, controls, and serviceability instead of adding unnecessary electronics.
Smart / Connected Appliances target households willing to pay for remote monitoring, guided cooking, and useful integration with other household devices. According to Eurostat, 14% of EU internet users used smart home appliances in 2024, including several non-cooking categories. Connectivity adds value when alerts and controls reduce supervision rather than merely duplicate physical buttons. Manufacturers should judge success through sustained feature use and manageable support costs, not connection capability alone.
Energy-Efficient Appliances compete on lifetime operating expense, making purchase premiums easier to defend when households understand their own cooking frequency and tariffs. As reported by the European Commission, efficient cooking products could avoid 2.7 million tonnes of annual EU carbon emissions by 2030. Reduced heat loss lowers energy requirements without necessarily changing meal output. Suppliers should connect verified performance with ownership costs, while avoiding claims that all efficient products require connectivity.
Price Range Analysis
Mid-Range dominates with an estimated 45.00% share in 2025 due to balanced functionality and manageable household spending.
Economy appliances address households that prioritize essential cooking functions and manageable purchase costs over integrated styling or extensive programs during replacement decisions. Data from Haier shows its Indian 20-litre solo microwave listed at ₹6,990 in October 2026. Fewer heating functions and simpler controls help keep the initial outlay accessible. Manufacturers need disciplined component sourcing and dependable basic performance because warranty claims can quickly absorb margins on lower-priced products.
In 2025, Mid-Range held an estimated 45.00% share in the Price Range segment of the Household Cooking Appliances Market within the forecast framework. Haier indicates its Indian 30-litre convection microwave with air fryer listed at ₹18,990 in October 2026. Combining cooking methods can replace separate purchases and justify a higher ticket. Retailers should demonstrate practical versatility while controlling promotions that erase the value gained from richer feature packages.
Premium appliances target buyers who value kitchen integration, advanced cooking control, and stronger service support enough to accept higher upfront spending at purchase. Figures from Miele show its U.S. 30-inch induction range listed at US$10,299 in October 2026. Combining a range and induction surface concentrates installation and performance expectations in the same purchase. Suppliers need reliable service and clear product differentiation because expensive features alone cannot guarantee repeat recommendation.
Distribution Channel Analysis
Online Retail / E-Commerce holds an estimated 25.00% share in 2025 due to convenient comparison and broad digital reach.
In 2025, Online Retail / E-Commerce held an estimated 25.00% share in the Distribution Channel segment of the Household Cooking Appliances Market. According to the U.S. Census Bureau, e-commerce represented 16.4% of all U.S. retail sales that year. That broader benchmark highlights digital purchasing without measuring cooking-appliance penetration. Sellers need accurate dimensions, installation guidance, and dependable delivery because product mismatch can turn online convenience into expensive returns and customer complaints.
Supermarkets and Hypermarkets connect cooking-appliance purchases with regular household shopping, making accessible pricing and simple product selection important for shoppers making quick comparisons. As reported by Walmart, its U.S. network included 3,559 supercenters at fiscal year-end 2025. That footprint indicates potential customer reach rather than uniform appliance availability across stores. Suppliers should match assortments to shelf space and local purchasing power while guarding against promotional terms that weaken profitability.
Specialty Stores support purchases where customers need physical inspection, feature comparisons, and help coordinating delivery or installation before committing household funds. Data from Best Buy shows its Domestic and International segments operated 1,117 stores at fiscal year-end 2025. Physical advice can reduce selection errors for products with strict dimensions and connection requirements. Manufacturers should train retail staff and align service promises with actual local capacity to preserve customer trust.
Key Market Segments
By Product Type
- Cooktops and Hobs
- Cooking Ranges
- Ovens
- Microwave Ovens
- Cooker Hoods and Chimneys
- Rice Cookers
- Induction Cookers
- Other Household Cooking Appliances
By Fuel Type
- Electric
- Gas
- Induction
- Dual Fuel
- Other Fuel Types
By Technology
- Conventional Appliances
- Smart / Connected Appliances
- Energy-Efficient Appliances
- IoT-Enabled Appliances
By Price Range
- Economy
- Mid-Range
- Premium
By Distribution Channel
- Online Retail / E-Commerce
- Supermarkets and Hypermarkets
- Specialty Stores
- Brand-Owned Stores
- Department Stores
- Direct-to-Consumer Brand Websites
- Other Distribution Channels
Regional Analysis
Asia-Pacific Dominates the Household Cooking Appliances Market with an Estimated Market Share of 38.00% in 2025, Valued at USD 105.0 Billion
Asia-Pacific accounts for an estimated 38.00% of the market in 2025, making regional distribution execution central to the forecast and investment case. Haier indicates DTC-fulfilled orders reached 57% of its China volume in 2025 across company operations. That company-specific measure highlights fulfillment control rather than regional cooking-appliance penetration. Suppliers should connect local assortments with reliable last-mile delivery, because broad access alone does not ensure profitable conversion or repeat purchases.
North American investment depends partly on whether completed homes translate into occupied kitchens and equipment purchases rather than standing inventory awaiting buyers. Figures from the U.S. Census Bureau show February 2025 housing completions at a 1,592,000-unit seasonally adjusted annual rate. That rate measures construction activity, not actual annual appliance shipments. Manufacturers should align builder relationships and production schedules with housing absorption while preserving replacement channels that rely less on property transactions.
Europe offers a clear operating-cost argument for cooking-product upgrades, although household energy consumption does not directly measure appliance revenue or replacement intentions. According to Eurostat, cooking represented 6.4% of EU household final energy consumption in 2024. Repeated cooking use makes efficient heat delivery relevant to ownership expense. Suppliers should present savings within realistic household budgets rather than promise that cooking upgrades alone will materially reduce total home energy spending.
Key Regions and Countries
North America
- US
- Canada
Europe
- Germany
- France
- The UK
- Spain
- Italy
- Rest of Europe
Asia Pacific
- China
- Japan
- South Korea
- India
- Australia
- Rest of APAC
Latin America
- Brazil
- Mexico
- Rest of Latin America
Middle East and Africa
- GCC
- South Africa
- Rest of MEA
Market Dynamics
Efficiency changes the investment case when reduced operating expense supports replacement without requiring households to expand their total kitchen budgets at purchase. As reported by the European Commission, policy modelling projected a 22 TWh annual reduction in cooking-appliance primary energy consumption by 2030. That scenario represents technical and policy effects rather than observed sales. Manufacturers should prioritize cost-effective insulation, heating control, and credible ownership-cost comparisons over features with unclear household benefits.
Drivers
Established clean-cooking programs create first-time equipment purchases rather than simply shifting households between premium brands during discretionary kitchen upgrades and replacements. According to the IEA tracking cited here, more than 2 billion people lacked clean-cooking access in 2024. Its 2025 Africa roadmap required approximately 80 million annual access gains, around 7 times the prevailing pace. That scenario supports affordable distribution investment, not an assumption that universal access becomes realized appliance revenue.
Conversion activity carries an analyst-modelled contribution of 0.45 percentage points, with all driver effects totaling 1.35 percentage points inside the 6.7% baseline CAGR. These estimates describe embedded influences rather than additional growth that investors should add again to the forecast when building valuation scenarios. Suppliers can capture that activity through accessible products, procurement relationships, and local dealers, while treating replacement, multifunction cooking, efficiency, and digital distribution as distinct commercial routes.
| Driver | (~) % Impact on CAGR Forecast | Geographic Relevance | Impact Timeline |
|---|---|---|---|
| Established clean-cooking conversion programs | +0.45% | South Asia; Southeast Asia; sub-Saharan Africa | Medium term (2–4 years) |
| Essential end-of-life appliance replacement | +0.30% | Global; mature installed-base markets | Short term (≤ 2 years) |
| Multifunction countertop appliance adoption | +0.25% | North America; Europe; urban Asia-Pacific | Short term (≤ 2 years) |
| Energy-saving product upgrades | +0.20% | Europe; East Asia; electricity-cost-sensitive markets | Medium term (2–4 years) |
| Online distribution penetration | +0.15% | Asia-Pacific; Latin America; secondary cities | Short term (≤ 2 years) |
Restraints
Mortgage lock-in delays move-triggered kitchen purchases when owners avoid exchanging inexpensive existing loans for materially higher borrowing costs during a property transaction. As reported by Freddie Mac, July 2024 mortgage rates averaged 6.85%, while June existing-home sales fell 5.4% monthly and annually. Those housing measures indicate transaction pressure rather than equivalent appliance declines. Manufacturers with exposure to built-in packages should protect replacement channels and avoid producing against uncertain remodeling schedules.
Transaction-sensitive purchases carry an analyst-modelled deduction of 0.40 percentage points, while total restraint exposure reaches 1.15 percentage points within the scenario framework. A separate challenge allowance of 0.80 percentage points produces a mechanical stress-case CAGR of 4.75% against the 6.7% baseline. That calculation illustrates sensitivity rather than a probability-weighted forecast or proof of independent effects. Suppliers should manage promotions and inventory carefully because overlapping pressures can reduce margins before sales visibly contract.
| Restraint | (~) % Impact on CAGR Forecast | Geographic Relevance | Impact Timeline |
|---|---|---|---|
| Mortgage lock-in suppressing kitchen transactions | -0.40% | North America; mortgage-sensitive European markets | Short term (≤ 2 years) |
| Household liquidity constraints | -0.30% | Global; lower-income consumer segments | Short term (≤ 2 years) |
| Insufficient household electrical capacity | -0.20% | Older urban housing; emerging-market settlements | Long term (≥ 4 years) |
| Import duties raising retail prices | -0.15% | Import-dependent appliance markets | Short term (≤ 2 years) |
| Mandatory safety-certification market exclusions | -0.10% | Regulated import markets; smaller suppliers | Short term (≤ 2 years) |
Challenges
Maritime routing disruption affects replenishment even when factories retain capacity and households continue buying appliances through normal retail and replacement channels worldwide. Data from UNCTAD shows Suez tonnage fell 70% by mid-2024, while Cape of Good Hope arrivals rose 89%. Rerouting increased container-vessel demand by an estimated 12%, and the Shanghai Containerized Freight Index more than doubled from late 2023. Manufacturers face longer replenishment cycles and less room for fixed-price delivery commitments.
An illustrative cost sensitivity assumes freight represents 4% of delivered cost and rises 50%, raising delivered cost by approximately 2% before offsets. That example is not an observed industry average, and the analyst-modelled routing drag of 0.30 percentage points is not a measured shipment decline. Manufacturers should compare alternate routes, regional assembly, secondary suppliers, and inventory buffers against stockout costs. Distributors need flexible purchasing terms because delayed arrivals can disrupt promotions without eliminating underlying household requirements.
| Challenge | (~) % CAGR Friction Drag | Geographic Relevance | Mitigation Horizon |
|---|---|---|---|
| Maritime Routing Cost Volatility | -0.30% | Asia–Europe; globally traded finished appliances | Short term (≤ 2 years) |
| Electronic Component Qualification Complexity | -0.18% | Global; digitally controlled product lines | Medium term (2–4 years) |
| Installation Technician Coverage Gaps | -0.14% | North America; Europe; emerging-market secondary cities | Medium term (2–4 years) |
| Connected Appliance Cybersecurity Maintenance | -0.10% | Europe; North America; connected-product markets | Long term (≥ 4 years) |
| Regional Cooking Performance Adaptation | -0.08% | South Asia; East Asia; Middle East | Medium term (2–4 years) |
Opportunities
Manufacturer-certified refurbishment can formalize fragmented resale through safety screening, traceable testing, and warranties rather than simply shifting existing purchases between new-product brands. The European Commission records repair-directive adoption on 13 June 2024 and national application from 31 July 2026. Qualifying repair adds one legal-guarantee year, but manufacturer duties depend on listed product legislation. Investors should not presume cooking-appliance coverage, and commercial viability still requires dependable returns sourcing and incremental formal-channel sales.
An illustrative refurbishment model sets new-product revenue at 100, refurbished revenue at 65, and all-in cost at 42, producing approximately 35.4% gross margin. That exceeds an assumed 30% new-product margin by 5.4 percentage points, but these figures are execution assumptions rather than reported results. Modelled opportunities total 0.85 percentage points, producing a 7.55% upside scenario. Suppliers must deduct cannibalization, manage warranties, and exclude service revenue from appliance-only forecasts before claiming incremental value.
| Opportunity | (~) % Potential CAGR Upside | Geographic Relevance | Execution Window |
|---|---|---|---|
| Manufacturer-certified refurbished cooking appliances | +0.30% | Europe; North America; organized resale markets | Medium term (2–4 years) |
| Accessible cooking platforms for aging households | +0.20% | Japan; Europe; North America | Medium term (2–4 years) |
| Battery-buffered portable cooking systems | +0.15% | Recreational-vehicle; outdoor; mobile-living segments | Long term (≥ 4 years) |
| Appliance-integrated nutrition-service partnerships | +0.10% | North America; Europe; affluent Asian markets | Long term (≥ 4 years) |
| Household-appliance fleet leasing | +0.10% | Managed rental housing; student accommodation | Medium term (2–4 years) |
Key Company Insights
Haier Smart Home Co., Ltd.
Haier’s investment case combines a broad household-appliance business with cooking exposure through regional operations, including GE Appliances in North America and its manufacturing network. According to Haier Smart Home, consolidated revenue reached RMB302.35 billion in 2025. That figure measures the whole company, not cooking sales, so investors should avoid treating corporate scale as cooking-market share. Financial breadth matters most when the company converts sourcing, distribution, and service capabilities into profitable category execution.
Haier’s North American cooking investment emphasizes flexible manufacturing rather than dependence on a single heating technology or narrow product configuration for production. As reported by GE Appliances, its Roper plant completed a US$180 million investment in June 2025. Expanded lines support gas, electric, and induction ranges, allowing production choices to follow customer preferences. Investors should assess utilization and product mix because flexible capacity creates value only when orders cover the added operating base.
Whirlpool Corporation
Whirlpool offers direct financial visibility into cooking products, making its reported category performance more useful than a broad corporate revenue comparison for investors. Data from Whirlpool shows cooking-category net sales reached US$3,687 million in 2025. That product grouping supports closer assessment of category exposure but does not establish a global market share. Investors should examine mix, promotion, and replacement channels because revenue scale alone does not demonstrate durable pricing power or operating returns.
Whirlpool’s premium cooking development connects appliance hardware with guided preparation, placing practical camera usefulness alongside traditional oven performance in the customer purchase decision. Whirlpool indicates its January 2026 KBIS announcement included a 30-inch KitchenAid Smart Electric Double Wall Oven with an Intelligent Cooking Camera. The design can support differentiated selling, but added electronics also create service obligations. Retail execution should explain cooking benefits clearly enough to justify the premium without relying on display novelty.
Key Players
- Haier Smart Home Co., Ltd.
- Whirlpool Corporation
- Midea Group Co., Ltd.
- BSH Hausgeräte GmbH
- Electrolux AB
- LG Electronics Inc.
- Samsung Electronics Co., Ltd.
- Panasonic Holdings Corporation
- Groupe SEB S.A.
- Arçelik A.Ş. / Beko
- Miele & Cie. KG
- Hisense Home Appliances Group Co., Ltd.
- Sharp Corporation
- De’Longhi S.p.A.
- SharkNinja, Inc.
Recent Developments
2026
- October 2026: LG Electronics product availability included its Canadian LSIL6336XE induction range, with a 6.3-cubic-foot oven and 4.3 kW element. According to LG Canada, availability began October 1, supporting a combined speed and capacity proposition.
- September 2026: Electrolux Group product unveiling introduced the AEG OnePot Pasta hob, with approximately 15-minute preparation and sensory testing involving more than 100 participants. As reported by Electrolux, the concept targets simpler meal preparation rather than feature breadth alone.
- July 2026: SharkNinja product launch introduced its first Ninja Crispi Microwave at US$449. Data from SharkNinja shows the launch expanded its cooking portfolio into microwaves, creating another route to compete for countertop space.
- July 2026: SharkNinja product announcement introduced the MultiPot XL 12-in-1 multicooker at US$249. SharkNinja indicates the design supports two 3.3-quart pots or one 7.5-quart pot, supporting either separated meals or larger batches.
- April 2026: Miele innovation unveiling presented a 14-centimetre steam drawer with approximately 14 litres of cooking capacity. Figures from Miele show European retail introduction was planned for March 2027, making this a product-pipeline development rather than completed market availability.
- April 2026: LG Electronics innovation unveiling presented a built-in kitchen package with a 6-in-1 compact oven and 189-millimetre hood-integrated induction unit. According to LG, the package combines functions within constrained kitchen space, supporting coordinated specification decisions.
- February 2026: Samsung Electronics product introduction presented redesigned Bespoke Smart Slide-in Ranges. As reported by Samsung, No Preheat Air Fry Max offered up to 15% faster air frying under its stated comparison conditions, making verified performance demonstration important to premium selling.
2025
- October 2025: SharkNinja product launch introduced the Crispi Pro glass air fryer at US$279, with 6-quart XL capability and six cooking functions. Data from SharkNinja shows the product extends its glass cooking platform into larger meal preparation.
- September 2025: Miele innovation announcement introduced its KM 8000 induction generation, including full-surface models accommodating up to six cookware items. Miele indicates PowerFlex zones reach 7.3 kW, supporting flexible pan placement and high-output cooking.
- June 2025: BSH investment opened its first African factory in Cairo, with roughly €50 million invested and planned annual capacity up to 350,000 stoves. Figures from Bosch show the facility established regional production capacity, making utilization and distribution coverage central return drivers.
- April 2025: BSH distribution expansion opened a 6,684-square-foot Beverly Hills Experience and Design Center. According to the official Thermador announcement, the site supports Bosch, Thermador, and Gaggenau presentations, strengthening physical product evaluation and premium specification support.
Geopolitical Impact Analysis
Trade-policy uncertainty complicates appliance purchasing because manufacturers commit to materials and components before distributors know final retail conditions. As reported by the WTO, world merchandise-trade volume grew 4.6% in 2025, while its March 2026 baseline forecast anticipated 1.9% growth in 2026. Those figures cover global goods rather than appliances, but the slowdown scenario changes planning conditions for steel panels, copper wiring, and electronic controls. Manufacturers should avoid translating aggregate trade growth directly into cooking-product orders. Purchasing teams need contract flexibility when component deliveries and retailer commitments follow different schedules. Distributors should balance availability against inventory exposure instead of assuming earlier trade strength guarantees continued household spending.
Maritime rerouting creates a separate exposure because longer journeys can absorb shipping capacity without equivalent growth in delivered cargo volumes. Data from UNCTAD shows maritime-trade volume increased 2.2% in 2024, while transport work measured in ton-miles rose 5.9%. That gap highlights distance-related pressure rather than a matching increase in appliance sales or freight prices. Cooking-equipment manufacturers must consider finished ranges, glass cooktops, steel housings, and electronic assemblies moving through extended supply routes. Longer transit can increase replenishment uncertainty and working-capital needs even when factories operate normally. Regional inventory buffers and alternative sourcing can improve delivery reliability, but buyers must weigh those protections against storage expense and duplicated stock.
Report Scope
| Report Features | Description |
|---|---|
| Market Value (2025) | USD 276.4 Billion |
| Forecast Revenue (2035) | USD 526.3 Billion |
| CAGR (2026-2035) | 6.7% |
| Base Year for Estimation | 2025 |
| Historic Period | 2021-2025 |
| Forecast Period | 2026-2035 |
| Report Coverage | Revenue Forecast, Market Dynamics, Market Opportunity Analysis, Technology and Innovation Landscape, Competitive Landscape, Recent Developments |
| Segments Covered | By Product Type (Cooktops and Hobs, Cooking Ranges, Ovens, Microwave Ovens, Cooker Hoods and Chimneys, Rice Cookers, Induction Cookers, Other Household Cooking Appliances), By Fuel Type (Electric, Gas, Induction, Dual Fuel, Other Fuel Types), By Technology (Conventional Appliances, Smart / Connected Appliances, Energy-Efficient Appliances, IoT-Enabled Appliances), By Price Range (Economy, Mid-Range, Premium), By Distribution Channel (Online Retail / E-Commerce, Supermarkets and Hypermarkets, Specialty Stores, Brand-Owned Stores, Department Stores, Direct-to-Consumer Brand Websites, Other Distribution Channels) |
| Regional Analysis | North America (US and Canada), Europe (Germany, France, The UK, Spain, Italy, and Rest of Europe), Asia Pacific (China, Japan, South Korea, India, Australia, and Rest of APAC), Latin America (Brazil, Mexico, and Rest of Latin America), Middle East and Africa (GCC, South Africa, and Rest of MEA) |
| Competitive Landscape | Haier Smart Home Co., Ltd., Whirlpool Corporation, Midea Group Co., Ltd., BSH Hausgeräte GmbH, Electrolux AB, LG Electronics Inc., Samsung Electronics Co., Ltd., Panasonic Holdings Corporation, Groupe SEB S.A., Arçelik A.Ş. / Beko, Miele & Cie. KG, Hisense Home Appliances Group Co., Ltd., Sharp Corporation, De’Longhi S.p.A., SharkNinja, Inc. |
| Customization Scope | Customization for segments, region / country-level will be provided. Additional customization can be done based on requirements. |
| Purchase Options | We have three licenses to opt for: Single User License | Multi-User License (Up to 5 Users) | Corporate Use License (Unlimited User and Printable PDF) |








