
Global Floating LNG Terminal Market Size, Share Analysis Report By Containment System (Membrane, Moss), By Vessel Type (FLNG, FSRU, FSU), By Application (Industrial Process, Power Generation, Regasification, Shipping Fuel, Others), By Storage Capacity (100 To 180 K Cubic Meter, Above 180 K Cubic Meter, Up To 100 K Cubic Meter), By End User (Petrochemicals, Transportation, Utilities, Others) , By Region and Companies - Industry Segment Outlook, Market Assessment, Competition Scenario, Trends and Forecast 2025-2034
- Published date: Dec 2025
- Report ID: 170814
- Number of Pages: 341
- Format:
-
keyboard_arrow_up
Quick Navigation
Report Overview
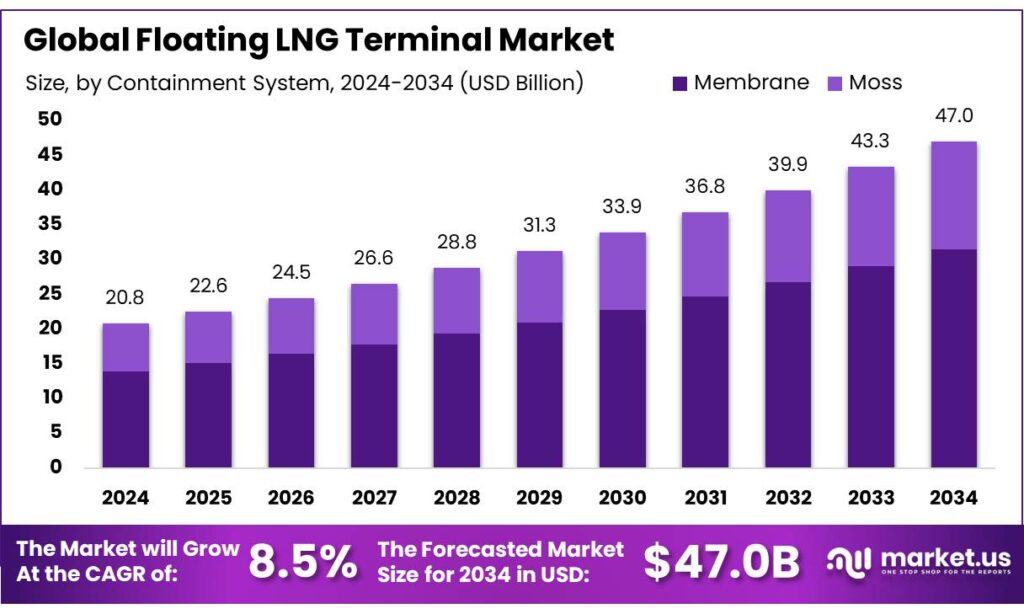
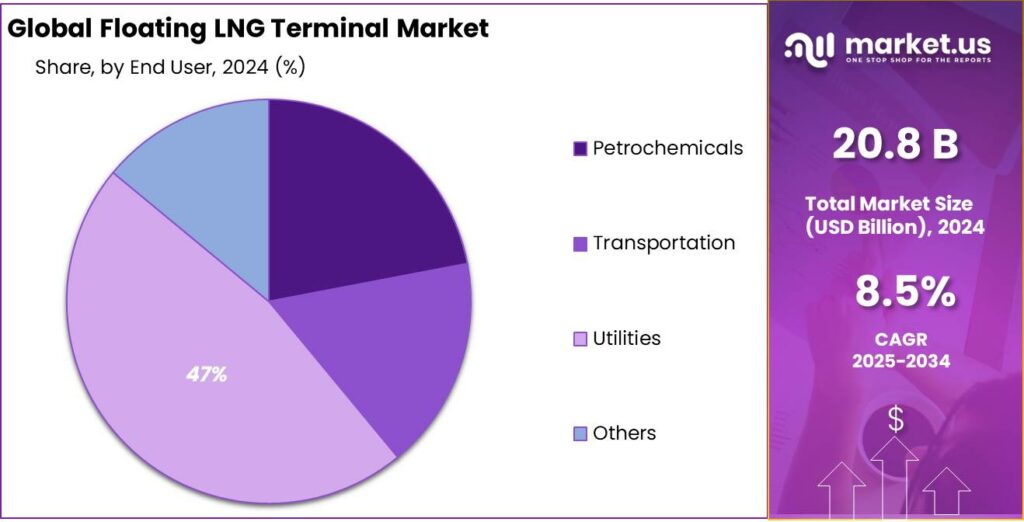
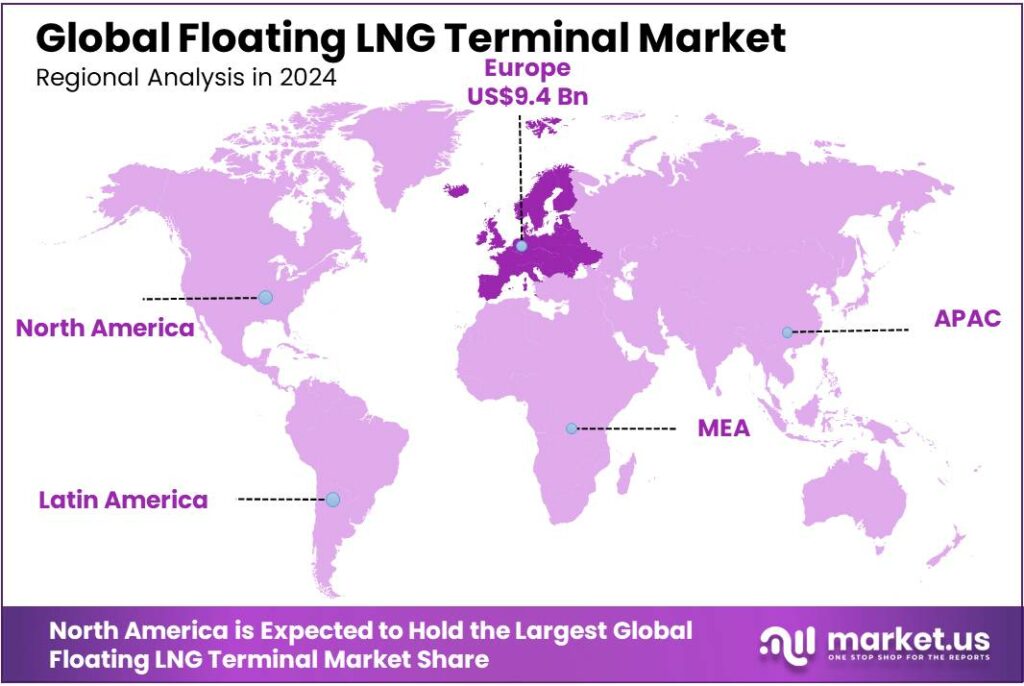
The Global Floating LNG Terminal Market size is expected to be worth around USD 47.0 Billion by 2034, from USD 20.8 Billion in 2024, growing at a CAGR of 8.5% during the forecast period from 2025 to 2034. In 2024, Europe held a dominant market position, capturing more than a 45.30 share, holding USD 9.4 Billion revenue.
Floating LNG terminals are offshore gas infrastructure that either liquefies gas at sea (FLNG) for export or stores and regasifies LNG close to demand centers. They matter because they shorten the distance between upstream gas, shipping lanes, and end-users—often where onshore land, permitting, or pipelines are limiting. In today’s LNG system, overall scale is large: global LNG trade reached 411.24 million tonnes (MT) in 2024, connecting 22 exporting markets with 48 importing markets, reflecting how widely LNG is now used as a balancing fuel for power and industry.
Industrially, the floating segment is expanding alongside broader LNG capacity additions. GIIGNL reports 492 MTPA of global liquefaction capacity in 2024 and 1,188 MTPA of regasification capacity, supported by 12 new terminals and 7 expansions in that year’s dataset. This “capacity race” is not just about mega onshore plants; it increasingly includes floating assets because they are relocatable, can be deployed faster than many land-based terminals, and can serve as a bridge solution where long-term demand is uncertain.
A major demand-side driver is energy security and supply diversification—especially in Europe after pipeline disruptions. The European Commission notes EU countries boosted LNG import capacity to 50 bcm/year as of May 2024, with expectations to reach 70 bcm by the end of 2024, supported by a record wave of new FSRU terminal projects.
On the supply side, FLNG is attractive for monetizing offshore and “stranded” fields without building long pipelines to shore. Project sizes remain meaningful: Reuters reports Mozambique’s government approved Eni’s plan for the $7.2 billion Coral Norte FLNG project, targeting 3.55 million tonnes per year of LNG for roughly 30 years, with production planned to start in the second half of 2028. At the same time, ongoing onshore expansions reinforce liquefaction growth signals—for example, Reuters reported Cheniere’s Corpus Christi Stage 3 includes 7 midscale trains totaling over 10 mtpa of capacity.
- Government policies and initiatives globally are also shaping the investment landscape. In India, for example, the Syama Prasad Mookerjee Port, Kolkata awarded a 30-year licence for a floating LNG terminal project that includes a 1.5 MMTPA FSRU, with expansion potential to 3 MMTPA, aimed at strengthening regional natural gas supply for industrial and power sectors.
Key Takeaways
- Floating LNG Terminal Market size is expected to be worth around USD 47.0 Billion by 2034, from USD 20.8 Billion in 2024, growing at a CAGR of 8.5%.
- Membrane held a dominant market position, capturing more than a 67.2% share.
- FLNG held a dominant market position, capturing more than a 47.1% share.
- Regasification held a dominant market position, capturing more than a 39.8% share.
- 100 To 180 K Cubic Meter held a dominant market position, capturing more than a 44.4% share.
- Utilities held a dominant market position, capturing more than a 47.5% share.
- Europe accounted for 45.30% of the global floating LNG terminal market, representing an estimated US$9.4 billion.
By Containment System Analysis
Membrane systems lead with 67.2% due to flexibility and efficient LNG storage design
In 2024, Membrane held a dominant market position, capturing more than a 67.2% share, supported by its wide adoption in floating LNG terminals for both liquefaction and regasification applications. This containment system was preferred because it allows better use of vessel space, lower structural weight, and improved thermal efficiency compared to alternative designs.
In 2024, operators favored membrane systems for large-scale offshore LNG projects as they support higher storage capacity while maintaining safety and operational reliability. The technology also aligned well with cost-control objectives, as reduced steel usage and faster construction timelines helped manage capital expenditure. In 2025, demand for membrane containment systems remained strong as new floating LNG terminals were planned to support flexible gas supply, energy security, and rapid deployment in offshore and remote locations.
By Vessel Type Analysis
FLNG vessels lead with 47.1% as offshore gas monetization gains momentum
In 2024, FLNG held a dominant market position, capturing more than a 47.1% share, driven by rising demand for offshore gas processing and export without the need for onshore infrastructure. FLNG vessels allowed gas producers to monetize remote and stranded gas reserves directly at sea, reducing land acquisition and pipeline costs.
In 2024, several energy operators favored FLNG projects due to their shorter development timelines and ability to relocate assets based on field life. The vessel type also supported faster market entry for LNG exports, particularly in regions with limited coastal infrastructure. In 2025, FLNG vessels continued to attract investment as energy security concerns and LNG trade expansion encouraged flexible and scalable floating solutions.
By Application Analysis
Regasification leads with 39.8% as demand for flexible LNG import capacity rises
In 2024, Regasification held a dominant market position, capturing more than a 39.8% share, supported by the growing need for fast and flexible LNG import solutions across energy-importing regions. Floating regasification terminals were widely adopted to quickly enhance gas supply without long onshore construction timelines.
In 2024, these terminals played a critical role in balancing seasonal demand and improving energy security, especially in markets facing supply disruptions. Their ability to be deployed and commissioned faster than land-based terminals increased their attractiveness for short- to medium-term supply planning. In 2025, regasification applications continued to expand as governments and utilities focused on diversification of gas sources and reliable LNG imports through adaptable floating infrastructure.
By Storage Capacity Analysis
Mid-range storage capacity leads with 44.4% as it balances scale and flexibility
In 2024, 100 To 180 K Cubic Meter held a dominant market position, capturing more than a 44.4% share, driven by its suitability for a wide range of floating LNG terminal applications. This storage capacity was preferred as it offered a balanced solution between operational flexibility and sufficient LNG volume for steady supply.
In 2024, operators selected this range to support both regasification and liquefaction needs while maintaining manageable vessel size and cost efficiency. The segment also aligned well with regional import terminals where moderate storage volumes met daily demand without overinvestment. In 2025, demand for 100 to 180 K cubic meter capacity remained strong as floating LNG projects focused on scalable designs that support reliable gas supply and adaptable deployment strategies.
By End User Analysis
Utilities dominate with 47.5% as stable gas supply becomes a priority
In 2024, Utilities held a dominant market position, capturing more than a 47.5% share, supported by the growing reliance on LNG to ensure reliable and continuous gas supply for power generation and distribution networks. Utilities increasingly adopted floating LNG terminals to secure long-term fuel availability while avoiding delays linked to onshore terminal development.
In 2024, these end users favored floating solutions for their flexibility, faster deployment, and ability to respond to demand fluctuations. The segment also benefited from policy support aimed at strengthening energy security and reducing dependence on single supply sources. In 2025, utilities continued to lead demand as floating LNG terminals became a strategic tool for managing peak load requirements and maintaining grid stability.
Key Market Segments
By Containment System
- Membrane
- Moss
By Vessel Type
- FLNG
- FSRU
- FSU
By Application
- Industrial Process
- Power Generation
- Regasification
- Shipping Fuel
- Others
By Storage Capacity
- 100 To 180 K Cubic Meter
- Above 180 K Cubic Meter
- Up To 100 K Cubic Meter
By End User
- Petrochemicals
- Transportation
- Utilities
- Others
Emerging Trends
Digitalisation and Operational Optimisation in Floating LNG Terminals
One of the strongest and most human-relevant trends shaping the future of Floating LNG Terminals today is the growing focus on digitalisation and operational optimisation across the LNG value chain. As these maritime terminals become increasingly central to how nations secure energy, governments and operators are investing in smarter systems, better monitoring and more efficient operations that make floating LNG usage safer, cleaner, and more cost-effective.
Governments are also encouraging more efficient LNG infrastructure because it aligns with broader energy transition and environmental goals. In India, for example, regulatory authorities are planning for significant growth in LNG infrastructure by 2030, with expectations that LNG loading capacity will rise from about 18 existing loading bays to 27–28 bays to serve a growing industrial and retail gas demand. This shift isn’t just about quantity — it pushes operators to adopt modern systems that maximise the efficiency of every new terminal site.
- The International Energy Agency (IEA) notes that more than 300 billion cubic meters per year (bcm/yr) of new LNG export capacity is expected to come online between 2025 and 2030, marking a major investment wave in global gas infrastructure. Smart operations are becoming key as new capacity gets connected to markets.
In practical terms, this digital transformation trend is not just a technical upgrade — it’s a step toward a more secure and resilient energy future. By investing in smarter systems now, countries and companies alike are building LNG infrastructure that can adapt to rapid changes in demand, respond to weather challenges, and support broader goals of cleaner, safer energy for communities everywhere.
Drivers
Rising Natural Gas Demand and Energy Security Needs
One of the clearest and most powerful forces pushing the growth of Floating LNG Terminals is the strong and sustained rise in natural gas demand worldwide, paired with urgent government goals to boost energy security and ensure stable fuel supplies. These two elements together are reshaping how countries think about LNG infrastructure, moving from fixed, land-based facilities to flexible, offshore solutions that can be deployed faster and adapt to changing market conditions.
- According to the International Energy Agency (IEA), India alone is expected to see its natural gas consumption increase by nearly 60% by 2030, driven by expanding industrial use, power generation needs, and city gas networks. This means total gas use in India could reach 103 billion cubic meters (bcm) per year by the end of the decade. This kind of demand growth is mirrored in other Asian markets like China, where energy-hungry industry and urban populations continue to expand.
Government policy initiatives further reinforce this trend. In India, for example, the national government has taken decisive steps to expand LNG infrastructure and encourage broader usage of natural gas by allowing 100% Foreign Direct Investment (FDI) under an automatic route for the establishment of LNG infrastructure, including terminals of all kinds. India currently has eight operational LNG regasification terminals with a combined capacity of roughly 52.7 million metric tonnes per annum (MMTPA), serving both industrial and city gas distribution sectors, and this infrastructure forms the backbone for future floating terminal deployments.
- Governments are also aligning LNG growth strategies with broader energy transition and climate goals. Many see natural gas as a “bridge fuel” — one that’s cleaner burning than coal or oil, reduces greenhouse gas emissions, and supports energy reliability while renewable capacity scales up. This aligns with official objectives to increase the share of gas in primary energy mixes; for instance, India has set a target to raise the contribution of natural gas from around 6-7% today to 15% by 2030, reflecting both environmental and energy diversification aims.
Restraints
Operational Risks and Environmental Vulnerabilities of Floating LNG Terminals
One major factor slowing the adoption and scaling of Floating LNG Terminals — especially Floating Storage and Regasification Units (FSRUs) — is how exposed these offshore systems are to real-world weather, operational challenges, and environmental risks. While floating terminals promise speed and flexibility, the reality for many countries and operators is that these benefits come with very real operational and environmental trade-offs that can undermine energy security goals, disrupt supplies, and even lead to costly downtime.
Floating LNG terminals sit offshore at sea, which means they are directly exposed to the elements — wind, waves, storms, cyclones and rough sea currents. This may sound straightforward, but weather can cause unplanned disruptions that directly affect energy availability and cost-effectiveness. Independent energy analysts have highlighted that almost 90% of proposed floating LNG import projects in South and Southeast Asia are located in regions prone to tropical storms, typhoons, cyclones and other hazardous ocean conditions. Countries such as the Philippines, Vietnam and Bangladesh are top examples where severe weather regularly tests maritime infrastructure.
Governments are aware of these operational and environmental risks, and in some cases have adjusted policies or paused projects to account for them. For example, decisions by courts in Europe have paused or relocated floating LNG installations due to concerns that the conditions which justified emergency terminals earlier no longer exist, highlighting how regulatory and legal risks compound operational vulnerabilities.
LNG is often promoted as a cleaner alternative to coal and oil, environmental groups and analysts point out that LNG production, transport and usage still generate significant greenhouse gas emissions, including methane leaks and other pollutants. Such concerns are shaping public opinion and regulatory environments in key markets, creating additional hurdles for gaining approvals or community support for floating terminal projects in sensitive coastal regions.
Opportunity
Surge in Global LNG Demand and Capacity Expansion
One of the most promising growth opportunities for Floating LNG Terminals lies in the expected surge in global demand for liquefied natural gas (LNG) and the rapid expansion of LNG supply capacity over the coming decade. This opportunity is rooted in real changes in energy consumption patterns, government policies that support energy diversification, and the ongoing transition toward cleaner fuels.
- According to the International Energy Agency (IEA), governments and industry forecasts suggest that global LNG export capacity could increase by more than 300 billion cubic meters per year (bcm/yr) by 2030 as projects already under construction or approved reach completion. This marks the largest wave of capacity additions in history, driven largely by new supply from producers such as the United States and Qatar.
At the same time, LNG demand is also rising strongly. The IEA projects that in key import markets like India, LNG demand could grow by 78% by 2030, reaching about 64 billion cubic meters per year (bcm/yr) compared with around 36.17 bcm/yr in 2024. This strong increase reflects expanding industrial activity, power generation needs, and broader use of gas across sectors.
Importantly, government initiatives across the world are backing this shift. For example, India — one of the fastest-growing energy markets globally — is planning to increase LNG import capacity by 27% to around 66.7 million metric tons per year (MMTPA) by 2030 through the addition of two new terminals. This policy direction not only secures fuel for domestic use but also opens the door for integrating floating solutions where land-based space is limited or demand timing demands faster implementation.
Regional Insights
Europe leads with 45.3% share and US$9.4 Bn in 2024, underpinned by rapid regasification expansion and energy security measures
In 2024, Europe accounted for 45.30% of the global floating LNG terminal market, representing an estimated US$9.4 billion in value as governments and utilities moved quickly to diversify gas supplies and expand import capacity. The region’s strong position reflected a large increase in regasification throughput—Europe imported over 100 million tonnes of LNG in 2024—while planned and fast-track floating solutions were used to avoid long onshore construction timelines and bolster seasonal and emergency supply.
Major Western European markets (including Spain, France, the Netherlands, Italy and Belgium) drove demand through both permanent and mobile FSRU/FLNG projects that targeted power generation and industrial feedstock needs; the EU’s policy push to increase LNG shares in imports (rising to roughly 37% of imports in 2024) reinforced investment appetite for flexible floating assets.
Key Regions and Countries Insights
- North America
- US
- Canada
- Europe
- Germany
- France
- The UK
- Spain
- Italy
- Rest of Europe
- Asia Pacific
- China
- Japan
- South Korea
- India
- Australia
- Rest of APAC
- Latin America
- Brazil
- Mexico
- Rest of Latin America
- Middle East & Africa
- GCC
- South Africa
- Rest of MEA
Key Players Analysis
In 2024, EXMAR remained a specialized player in floating LNG infrastructure, operating 1 FLNG unit and multiple FSRUs for gas production and regasification projects. The company generated approximately US$1.1 billion in revenue, benefiting from long-term LNG processing contracts and niche offshore energy solutions.
In 2024, ABB supported floating LNG terminals through power, automation, and electrical systems used in offshore LNG vessels. The company supplied integrated solutions for FLNG and FSRU projects worldwide. ABB recorded revenue of nearly US$32 billion, with its energy and process automation segment playing a critical role in LNG terminal efficiency.
In 2024, BASF SE participated in the floating LNG value chain as a major industrial end user and infrastructure partner to secure stable gas supply. The company supported LNG terminal developments to safeguard feedstock availability. BASF reported total revenue of around US$74 billion, with energy-intensive operations relying heavily on LNG imports.
Top Key Players Outlook
- Mitsui O.S.K.Lines
- Eni S.p.A.
- Höegh LNG
- BASF SE
- EXMAR
- ABB
- Petroliam Nasional Berhad (PETRONAS)
- Woodside
- Golar LNG Limited
- Excelerate Energy, Inc.
- Shell plc
Recent Industry Developments
In 2025, Eni together with Area 4 partners made a final investment decision (FID) for the Coral North FLNG project, a second floating LNG facility projected to produce an additional 3.6 MTPA of LNG per year once operational, potentially doubling Mozambique’s offshore LNG output and supporting energy supply to both European and Asian markets.
October 2024, MOL signed a long-term time charter agreement with Singapore LNG Corporation Pte Ltd to provide Singapore’s first floating LNG terminal; this FSRU will have 200,000 m³ storage capacity and 5 million tonnes per annum (MTPA) regasification capacity, helping Singapore increase LNG imports and support around 95 % of its electricity generation that relies on imported gas.
Report Scope
Report Features Description Market Value (2024) USD 20.8 Bn Forecast Revenue (2034) USD 47.0 Bn CAGR (2025-2034) 8.5% Base Year for Estimation 2024 Historic Period 2020-2023 Forecast Period 2025-2034 Report Coverage Revenue Forecast, Market Dynamics, Competitive Landscape, Recent Developments Segments Covered By Containment System (Membrane, Moss), By Vessel Type (FLNG, FSRU, FSU), By Application (Industrial Process, Power Generation, Regasification, Shipping Fuel, Others), By Storage Capacity (100 To 180 K Cubic Meter, Above 180 K Cubic Meter, Up To 100 K Cubic Meter), By End User (Petrochemicals, Transportation, Utilities, Others) Regional Analysis North America – US, Canada; Europe – Germany, France, The UK, Spain, Italy, Rest of Europe; Asia Pacific – China, Japan, South Korea, India, Australia, Singapore, Rest of APAC; Latin America – Brazil, Mexico, Rest of Latin America; Middle East & Africa – GCC, South Africa, Rest of MEA Competitive Landscape Mitsui O.S.K.Lines, Eni S.p.A., Höegh LNG, BASF SE, EXMAR, ABB, Petroliam Nasional Berhad (PETRONAS), Woodside, Golar LNG Limited, Excelerate Energy, Inc., Shell plc Customization Scope Customization for segments, region/country-level will be provided. Moreover, additional customization can be done based on the requirements. Purchase Options We have three licenses to opt for: Single User License, Multi-User License (Up to 5 Users), Corporate Use License (Unlimited User and Printable PDF)  Floating LNG Terminal MarketPublished date: Dec 2025add_shopping_cartBuy Now get_appDownload Sample
 -
-
- Mitsui O.S.K.Lines
- Eni S.p.A.
- Höegh LNG
- BASF SE
- EXMAR
- ABB
- Petroliam Nasional Berhad (PETRONAS)
- Woodside
- Golar LNG Limited
- Excelerate Energy, Inc.
- Shell plc
Our Clients
- 170814
- Dec 2025


