Report Overview
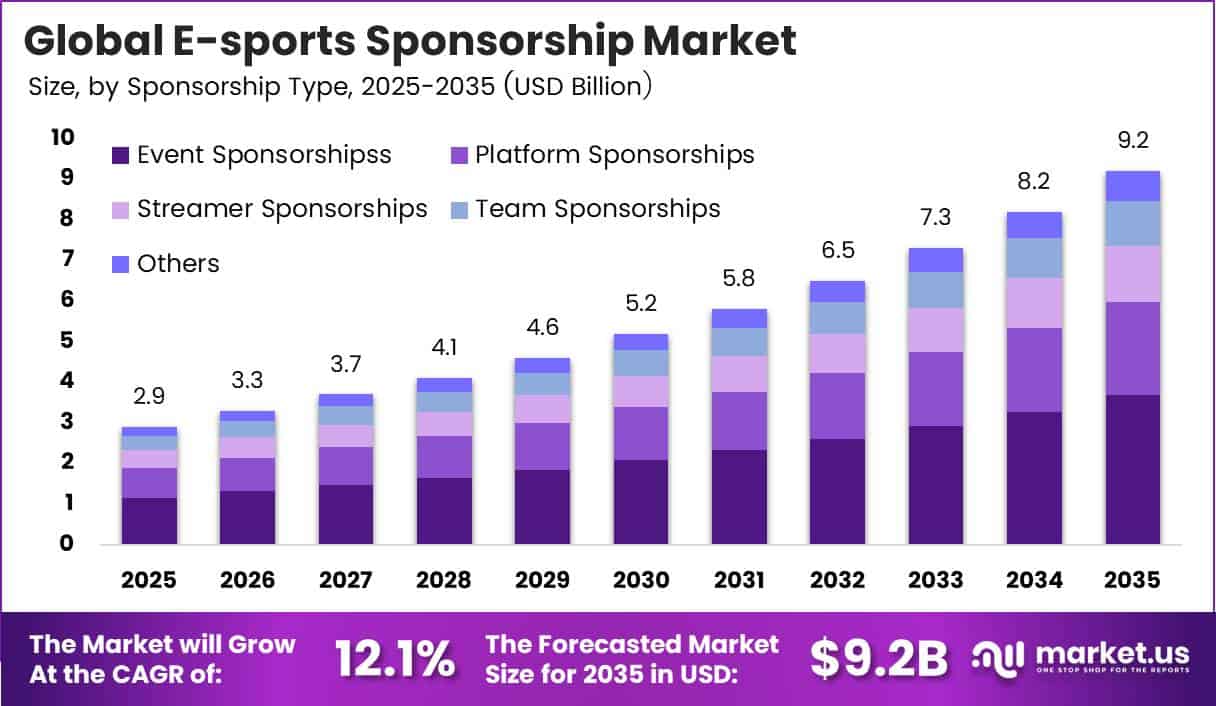
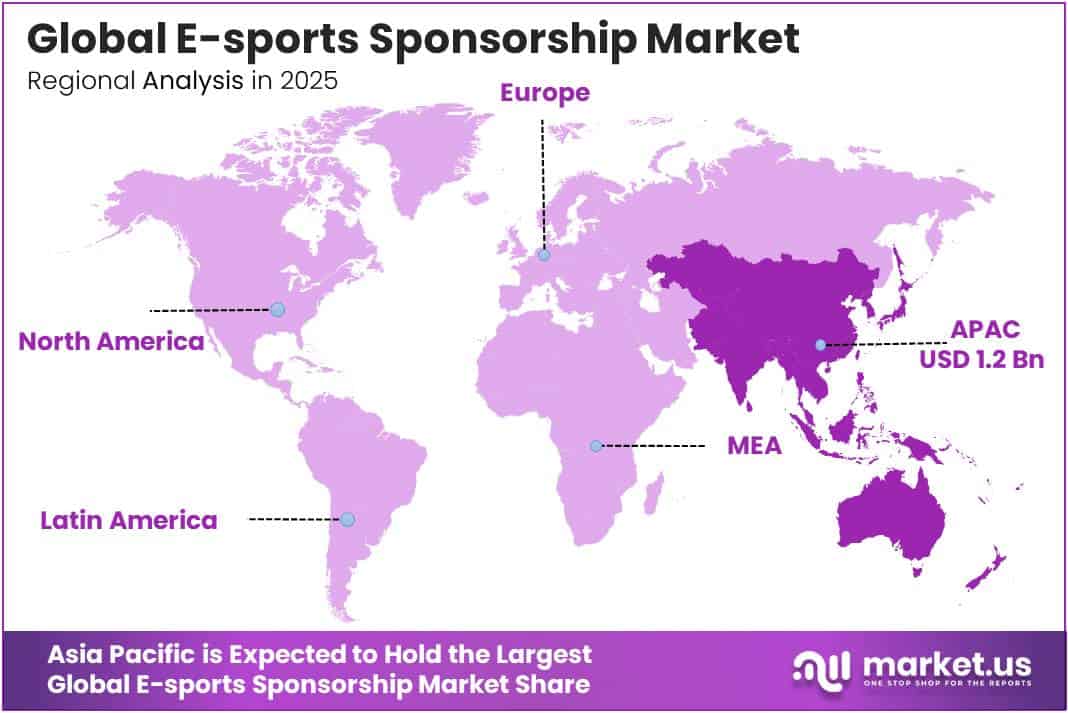
In 2025, the Global E-sports Sponsorship Market was valued at USD 2.9 billion. The market is projected to grow at a CAGR of 12.1% during 2026–2035, reaching approximately USD 9.2 billion by 2035. Asia Pacific dominated the global market in 2025, accounting for more than 42.5% of the total market share and generating approximately USD 1.2 billion in revenue.
More people online means a bigger audience for esports sponsors. The ITU says about 6 billion people used the Internet in 2025, up from 5.8 billion in 2024. That is more than 240 million new users in one year. Young people are the audience sponsors care about most, and the ITU reports that 82% of people aged 15 to 24 are online, compared with 72% of everyone else.
Hardware and brand sales show the audience is growing. NVIDIA’s Gaming revenue rose 41% to a record USD 16.0 billion in fiscal 2026. Monster Beverage posted record net sales of USD 8.29 billion in 2025. Brands are following these engaged buyers into tournaments, streams and team deals.
Asia-Pacific has the most viewers because so many people there play mobile games. WGSN counted 500 million esports streaming viewers across the region in 2024, mostly watching mobile titles. The ITU says 5G now reaches more than half of the world’s people and makes up over one third of mobile broadband subscriptions. Logitech’s fiscal 2026 sales grew about 15% in Asia Pacific but fell 1% in the Americas
Key Takeaways
- The Global E-sports Sponsorship Market reached USD 2.9 billion in 2025 and will reach USD 9.2 billion by 2035. The market will grow at a 12.1% CAGR from 2026 to 2035.
- By sponsorship type, Event Sponsorships lead with a 37.4% share.
- By industry vertical, Beverage and Food Brands lead with a 23.4% share.
- By game genre, MOBA leads with a 30.8% share.
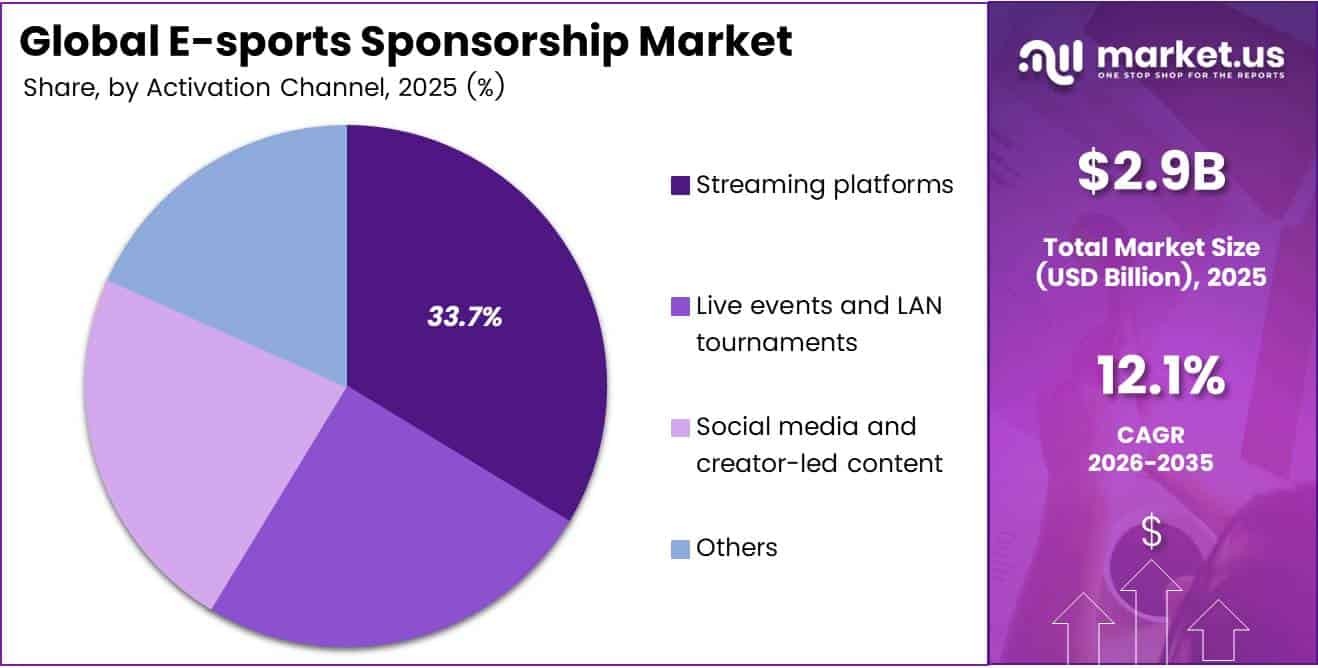
- By activation channel, Streaming platforms lead with a 33.7% share.
- Asia-Pacific leads with a 42.5% share and USD 1.2 billion in revenue.
By Sponsorship Type
Event Sponsorships dominate with 37.4% due to massive live audiences in fixed slots.
Event sponsorships lead because big tournaments draw millions of fans into one fixed time window, which lets a brand own the moment. The League of Legends World Championship 2025 averaged 1,534,999 concurrent viewers across nearly 90 hours of airtime. A brand on the stage, jerseys, and broadcast stays in front of that crowd for days, not minutes.
Streamer and influencer sponsorships grow the fastest because creators stream all year, not just during finals season. Twitch averaged more than 6.9 million active streaming channels per month in 2025, with around 93,200 channels live at any moment. That many creators let brands choose by game, language, and audience size.
GameSquare signed more than USD 8 million in new annual partnerships with Web3 brands after July 2025, and much of that value comes through creator content. Many small creator deals also cost less than one big event package, which suits brands trying esports for the first time.
By Industry Verticals
Beverage and Food Brands dominate with 23.4% due to large ad budgets and snacking habits.
Beverage and food brands lead because esports fans snack and drink through long viewing sessions, and these companies have some of the biggest ad budgets in the world. The Coca-Cola Company raised its advertising spend to USD 5.4 billion in 2025, up from USD 5.1 billion in 2024.
Its system sold 33.8 billion unit cases that year, so even a small shift toward gaming can pay for large deals. PepsiCo spent another USD 5.4 billion on advertising and other marketing in 2025. Energy drinks and snacks fit naturally into late-night streams and LAN events, which helps these brands track sales lift.
Financial services and crypto brands grow the fastest because they target the same young, digital-first fans who watch esports. Coinbase’s marketing program costs reached USD 402.6 million in 2025, up 63% from USD 247.1 million in 2024. The company linked that rise to more digital advertising and brand spending.
By Game Genre
MOBA dominates with 30.8% due to mature global franchised league systems.
MOBA titles lead because they have the oldest global league systems and draw the biggest single-match crowds. The 2025 League of Legends World Championship final between T1 and KT Rolster peaked at 6,752,585 viewers, not counting Chinese platforms, and the full event logged 136.4 million hours watched.
Riot’s franchised leagues in Korea, China, Europe and North America also give brands steady, multi-year inventory they can plan around. Sports simulation titles grow the fastest because they link esports with real football clubs and leagues that brands already sponsor. Electronic Arts said its sports portfolio reached 265 million players by September 2024, up from 150 million in 2022.
In fiscal 2026, EA’s live services and other net bookings rose 5% to USD 5.63 billion, mainly from extra content in its football franchise. A sponsor can now stretch one stadium deal across the real club, the game, and the club’s esports team. Sports fans also understand football games right away, which makes it easier for mass-market brands to get into esports.
By Activation Channel
Streaming platforms dominate with 33.7% due to always-on live match broadcast reach.
Streaming platforms lead because nearly every esports match, from local qualifiers to world finals, reaches fans through a live stream. Viewers watched more than 19 billion hours on Twitch in 2025, and about 2.17 million people watch at the same time on average.
Social media and creator-led content grow the fastest because mobile players share clips, memes, and short videos across many apps every day. KRAFTON said mobile games made up 52.3% of its record 2025 revenue, and paying users of Battlegrounds Mobile India grew 27% over 2024. Many of these fans watch short clips more than full broadcasts, so brands now pay creators for native posts on TikTok, Instagram, and YouTube Shorts.
Key Market Segments
By Sponsorship Type
- Event Sponsorships
- Platform Sponsorships
- Streamer/Influencer Sponsorships
- Team Sponsorships
- Others
By Industry Verticals
- Beverage and Food Brands
- Apparel and Lifestyle
- Automotive and Mobility
- Financial Services and Crypto
- Technology and Consumer Electronics
- Telecommunications and Internet Providers
- Others
By Game Genre
- MOBA
- Battle Royale
- FPS
- Sports Simulation
- Strategy Games
- Others
By Activation Channel
- Streaming Platforms
- Live Events and LAN Tournaments
- Social Media and Creator-led Content
- Others
Geopolitical Impact Analysis
Conflict on key shipping routes raises the cost of delivering live esports events. Every LAN final needs gaming PCs, GPUs, monitors, and stage gear, and most of it ships from Asia. UNCTAD reports that the Red Sea crisis cut Suez Canal transits by 70%. Ships that once crossed the Red Sea in days now take weeks to sail around the Cape of Good Hope.
Container freight rates nearly doubled in 2024. Longer routes pushed ton-miles up by about 6%, almost three times faster than trade volumes grew. UNCTAD expects seaborne trade to grow only 0.5% in 2025. Sponsors that supply hardware to Riyadh, Paris or Seoul events now pay more to move equipment and need longer lead times.
Tariffs and chip shortages add more pressure on hardware sponsors. The WTO reports that world merchandise trade volume grew 4.6% in 2025, but it expects growth to slow to 1.9% in 2026. Growth could drop to 1.4% if the Middle East oil shock lasts. AI-related goods escaped most new tariffs.
Regional Analysis
Asia Pacific dominates the E-sports Sponsorship Market, holding a 42.5% share and generating USD 1.2 billion in revenue. China, South Korea and Japan run the region’s biggest leagues. Southeast Asia and India add a fast-growing mobile audience. Big mobile titles anchor the competitive scene, including Honor of Kings, PUBG Mobile and Mobile Legends: Bang Bang.
North America has a mature esports sponsorship base. Hardware and telecom brands lead spending, and big franchise leagues anchor most deals. Consumer demand cooled in 2025. Logitech reported that its Americas sales fell 1%, partly because of weak North American gaming sales.
Europe is a strong region for sponsorship growth. Logitech reported that EMEA sales grew about 9% in fiscal 2026. Non-gaming brands now sign major team deals. In February 2026, Team Vitality partnered with French retailer E.Leclerc. Premium deals with top-tier teams now cost between EUR 750,000 and EUR 1.2 million a year in rights fees. Brands spend another 40% to 60% on activation on top of that. Germany, France, and the UK host most top events and team headquarters.
Key Regions and Countries
North America
- US
- Canada
Europe
- Germany
- France
- The UK
- Spain
- Italy
- Rest of Europe
Asia Pacific
- China
- Japan
- South Korea
- India
- Australia
- Rest of APAC
Latin America
- Brazil
- Mexico
- Rest of Latin America
Middle East and Africa
- GCC
- South Africa
- Rest of MEA
Market Dynamics
Drivers
| Driver | (~) % Impact on CAGR Forecast | Geographic Relevance | Impact Timeline |
|---|---|---|---|
| Internet-Connected Viewing Base | +1.7% | Global, strongest in Asia Pacific | Short term (2 years or less) |
| Mega-Event Audience Scale | +1.2% | Global, led by Asia and GCC | Short term (2 years or less) |
| Creator Co-Streaming Growth | +0.8% | North America, Europe, Asia Pacific | Short term (2 years or less) |
| Sponsor Category Expansion | +0.6% | Global developed markets | Medium term (2 to 4 years) |
| Standard Gaming Ad Formats | +0.5% | North America and Europe | Medium term (2 to 4 years) |
Internet-Connected Viewing Base
The expanding online audience strongly supports the baseline 12.1% CAGR by creating more live broadcasts, creator streams, and short videos for sponsors. The ITU reported that 5.5 billion people used the Internet in 2024, equal to 68% of the global population and 227 million more users than in 2023.
The Esports World Cup Foundation reported that its 2025 event reached 750 million viewers and generated 350 million viewing hours. The IAB improved commercial access on June 26, 2025, when it introduced standard gaming advertising formats and performance measures for a channel used by more than 80% of US Internet users.
These advances help sponsors compare campaigns, select audiences, and plan renewals. They also allow rights holders to replace single-country packages with annual regional contracts, supporting an estimated +1.7% contribution to the forecast CAGR.
Restraints
| Restraint | (~) % Impact on CAGR Forecast | Geographic Relevance | Impact Timeline |
|---|---|---|---|
| Minor-Targeting Advertising Bans | -1.2% | Europe and the UK | Short term (2 years or less) |
| Betting and Crypto Promotion Limits | -0.7% | Europe, Asia Pacific, Middle East | Short term (2 years or less) |
| High Rights-Fee Commitments | -0.5% | North America and Europe | Medium term (2 to 4 years) |
| Brand Safety Exclusions | -0.4% | Global | Short term (2 years or less) |
| Marketing Budget Freezes | -0.3% | Global cyclical markets | Short term (2 years or less) |
Minor-Targeting Advertising Bans
Restrictions on advertising to minors create a major sales barrier because young viewers form an important part of the esports audience. The European Union’s Digital Services Act became fully applicable on February 17, 2024, and bans profiling-based advertising to minors.
Regulators can fine a non-compliant platform up to 6% of its global annual turnover, encouraging sponsors and platforms to limit precise audience targeting. Ofcom introduced more than 40 child-safety measures for UK online services. Providers had to complete risk assessments by July 24, 2025, and apply safeguards from July 25, 2025.
The US Federal Trade Commission also requires clear disclosure of paid endorsements and can seek penalties of up to USD 50,120 per violation under its Penalty Offense Authority. These rules increase legal checks, reduce targeting options, and delay campaign approval, creating an estimated -1.2% deduction from the forecast CAGR.
Challenges
| Challenge | (~) % CAGR Friction Drag | Geographic Relevance | Mitigation Horizon |
|---|---|---|---|
| ROI Measurement Fragmentation | -1.0% | Global | Medium term (2 to 4 years) |
| Audience Fraud Exposure | -0.7% | Global digital channels | Medium term (2 to 4 years) |
| Creator Talent Volatility | -0.6% | North America, Europe, Asia Pacific | Short term (2 years or less) |
| Tournament Calendar Congestion | -0.5% | Global major-event markets | Medium term (2 to 4 years) |
| Publisher-Controlled Inventory | -0.5% | Global | Long term (4 years or more) |
ROI Measurement Fragmentation
Fragmented measurement creates a major operational challenge because sponsors cannot compare tournament exposure, creator content, social clips, and in-game placements through one performance measure. In 2025, the World Federation of Advertisers found that sponsorship assessment focused mainly on awareness at 84% and consideration at 65%, rather than direct sales results.
The Media Rating Council also updated its invalid-traffic guidance in April 2024, adding property-level reporting and stronger controls for false or incomplete traffic. Rights holders need common impression definitions, audited traffic controls, and privacy-safe identifiers to reduce the estimated -1.0% friction drag on market growth.
Opportunities
| Opportunity | (~) % Potential CAGR Upside | Geographic Relevance | Execution Window |
|---|---|---|---|
| Sponsor-Linked Digital Commerce | +1.4% | Global | Medium term (2 to 4 years) |
| Women’s Esports Portfolios | +0.9% | North America, Europe, Asia Pacific | Medium term (2 to 4 years) |
| Emerging-Market Mobile Leagues | +0.8% | South Asia, Southeast Asia, Latin America, Africa | Long term (4 years or more) |
| B2B Data Monetization | +0.6% | North America and Europe | Medium term (2 to 4 years) |
| Modular SME Sponsorships | +0.5% | Global regional leagues | Short term (2 years or less) |
Sponsor-Linked Digital Commerce
Sponsor-linked digital commerce offers strong future upside because most sponsorship packages still separate brand exposure from in-game purchases, virtual items, rewards, and fan memberships. Riot Games created a digital revenue pool that allocates 50% through general shares, 35% through competitive performance, and 15% through fan engagement.
Take-Two Interactive reported that digital channels generated 96.4% of revenue in fiscal 2025, while recurrent consumer spending represented 79.4%. The IAB reports that more than 80% of US Internet users identify as gamers, but many sponsorship deals still focus on media exposure instead of digital transactions.
An illustrative shift of 10% of activation activity from physical merchandise to digital rewards could reduce variable fulfillment costs by an estimated 60% to 80% and lift contribution margins by around 8 to 12 percentage points. Successful execution could add about +1.4% to the forecast CAGR without requiring more physical event capacity.
Key Players Analysis
The Tier 1 leaders bring in big revenue and spend steadily on esports. NVIDIA leads the hardware group, with fiscal 2026 revenue of USD 215.9 billion, up 65%. It spent USD 18.5 billion on research and development, and NVIDIA GPUs run the official tournament PCs at major events.
Gaming keeps growing at NVIDIA. Fourth-quarter Gaming revenue rose 47% from a year earlier to USD 3.7 billion, mainly because of strong demand for Blackwell GPUs. Beverage brands lead the consumer side of Tier 1. Monster Beverage’s 2025 net sales reached USD 8.29 billion, up USD 801.6 million from 2024.
Case sales grew 13.3% to 959.0 million cases, and fourth-quarter operating income rose 42.3% to USD 542.6 million. That cash pays for team and creator deals. PepsiCo, Red Bull and Coca-Cola compete in the same category, and PepsiCo brought its Mountain Dew fan zones back to the Esports World Cup.
Tier 2 challengers are strong in specific niches. Logitech’s fiscal 2026 sales came to USD 4.84 billion, and its Gaming segment, which includes Streamlabs, earned USD 1.41 billion. Logitech spent USD 316.2 million on research and development and plans to raise that to about 6% of sales in fiscal 2027.
Razer, AMD and Intel compete for PC hardware sponsorships, and Adidas, Nike, Puma and Champion compete in apparel. Coinbase and Mastercard are the main names in the fast-growing financial services and crypto category.
Top Key Players in the Market
- Adidas
- AMD
- ATandT
- Champion
- Coca-Cola
- Coinbase
- Intel Corporation
- Logitech G
- Mastercard
- Monster Energy
- Nike
- Nvidia Corporation
- PepsiCo
- Puma
- Razer Inc.
- Red Bull
- Unilever
- Verizon
Recent Developments
- In September 2025, GameSquare Holdings expanded Rollbit’s sponsorship of the FaZe Clan Counter-Strike team from USD 1.75 million to USD 3.25 million a year. The deal added center-patch jersey branding.
- In January 2026, the Esports World Cup Foundation announced a USD 75 million total prize pool for the 2026 Esports World Cup, up from USD 71.5 million in 2025. It set aside USD 30 million for the Club Championship.
- In July 2026, the Esports World Cup Foundation opened its first international edition in Paris. The event brought together more than 2,000 players and 200 clubs from over 100 countries, after more than 1.5 million players competed in 330 qualifiers.
Report Scope
| Report Features | Description |
|---|---|
| Market Value (2025) | USD 2.9 billion |
| Forecast Revenue (2035) | USD 9.2 billion |
| CAGR (2026-2035) | 12.1% |
| Base Year for Estimation | 2025 |
| Historic Period | 2020-2024 |
| Forecast Period | 2026-2035 |
| Report Coverage | Revenue Forecast, Market Dynamics, Competitive Landscape, Recent Developments |
| Segments Covered | By Sponsorship Type (Event Sponsorships, Platform Sponsorships, Streamer/Influencer Sponsorships, Team Sponsorships, Others); By Industry Verticals (Beverage and Food Brands, Apparel and Lifestyle, Automotive and Mobility, Financial Services and Crypto, Technology and Consumer Electronics, Telecommunications and Internet Providers, Others); By Game Genre (MOBA, Battle Royale, FPS, Sports Simulation, Strategy Games, Others); By Activation Channel (Streaming platforms, Live events and LAN tournaments, Social media and creator-led content, Others) |
| Regional Analysis | North America – US, Canada; Europe – Germany, France, The UK, Spain, Italy, Rest of Europe; Asia Pacific – China, Japan, South Korea, India, Australia, Singapore, Rest of APAC; Latin America – Brazil, Mexico, Rest of Latin America; Middle East & Africa – GCC, South Africa, Rest of MEA |
| Competitive Landscape | Adidas, AMD, ATandT, Champion, Coca-Cola, Coinbase, Intel Corporation, Logitech G, Mastercard, Monster Energy, Nike, Nvidia Corporation, PepsiCo, Puma, Razer Inc., Red Bull, Unilever, Verizon |
| Customization Scope | Customization for segments, region/country-level will be provided. Moreover, additional customization can be done based on the requirements. |
| Purchase Options | We have three licenses to opt for: Single User License, Multi-User License (Up to 5 Users), Corporate Use License (Unlimited Users and Printable PDF) |