Report Overview
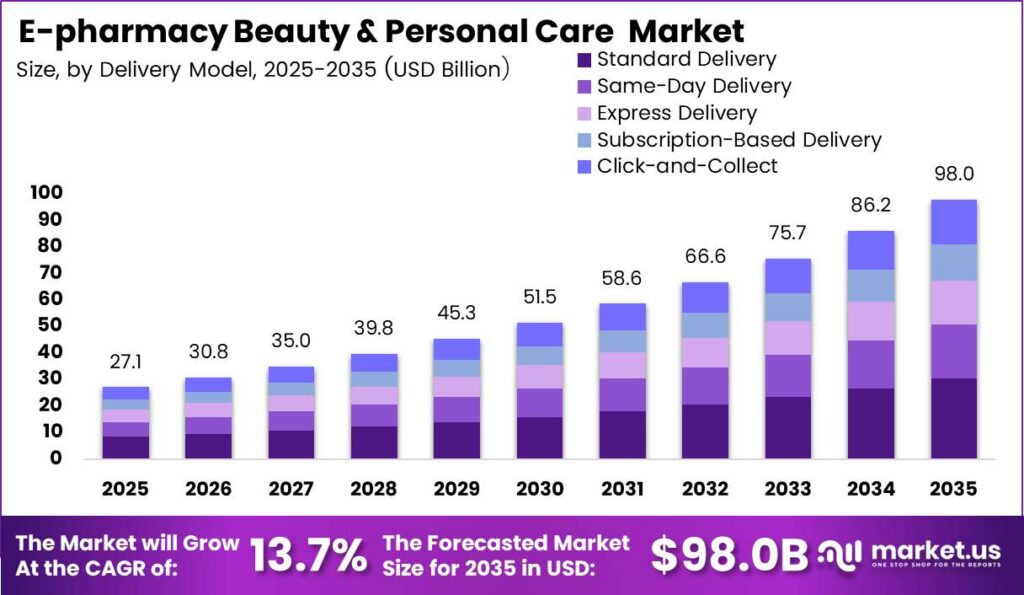
Global E-pharmacy Beauty and Personal Care (BPC) Market size is expected to be worth around USD 98.0 Billion by 2035 from USD 27.1 Billion in 2025, growing at a CAGR of 13.7% during the forecast period 2026 to 2035. E-pharmacy beauty and personal care platforms dispense clinically validated skincare, hair care, medicated cosmetics, and daily hygiene formulations through licensed digital pharmacies and integrated teleconsultation networks. Therefore, pharmacy operators capture higher retail margins by bundling active cosmetic regimens with prescription therapies.
The market structure connects dermatological laboratories, licensed fulfillment pharmacies, and last-mile couriers with healthcare clinics and consumer households. According to U.S. Census Bureau, U.S. retail e-commerce sales reached USD 340.2 Billion in Q2 2026, marking a 12.2% annual increase and representing 17.1% of total retail sales. This shift toward digital retail channels lowers overhead costs per transaction for pharmacy distributors. Consequently, operators can reallocate capital from physical storefronts into automated cold-chain and dermatology fulfillment hubs.
Key Takeaways
- The global E-pharmacy Beauty and Personal Care (BPC) Market was valued at USD 27.1 Billion in 2025.
- Global market revenue is projected to reach USD 98.0 Billion by 2035.
- The market is forecast to expand at a compound annual growth rate of 13.7% during the forecast period from 2026 to 2035.
- In the Product Type segment, Skincare Products held the leading share of 26.00% in 2025.
- Within the Product Category segment, Over-the-Counter (OTC) Beauty and Personal Care Products accounted for the largest share of 32.00% in 2025.
- Under the Delivery Model segment, Standard Delivery captured the top share of 31.00% in 2025.
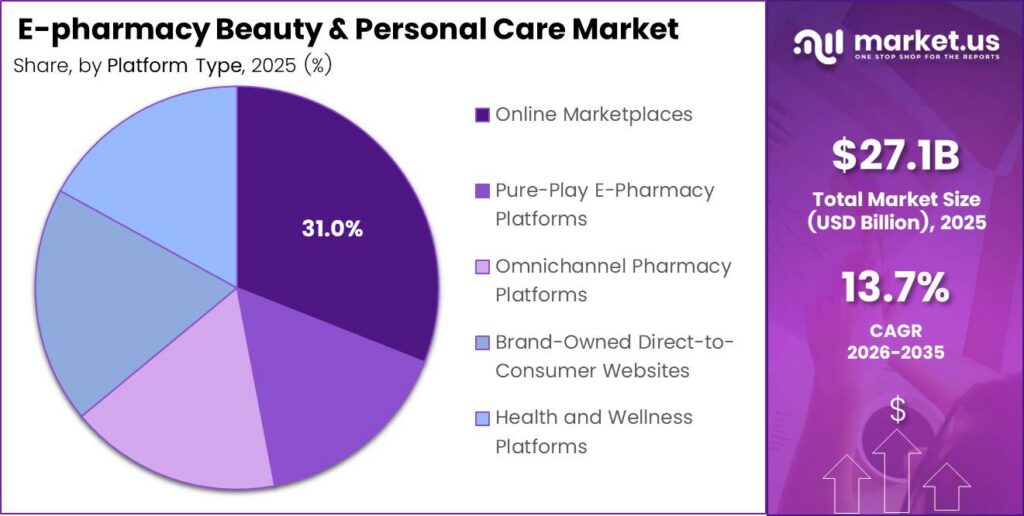
- In the Platform Type segment, Online Marketplaces led the market with a 31.00% share in 2025.
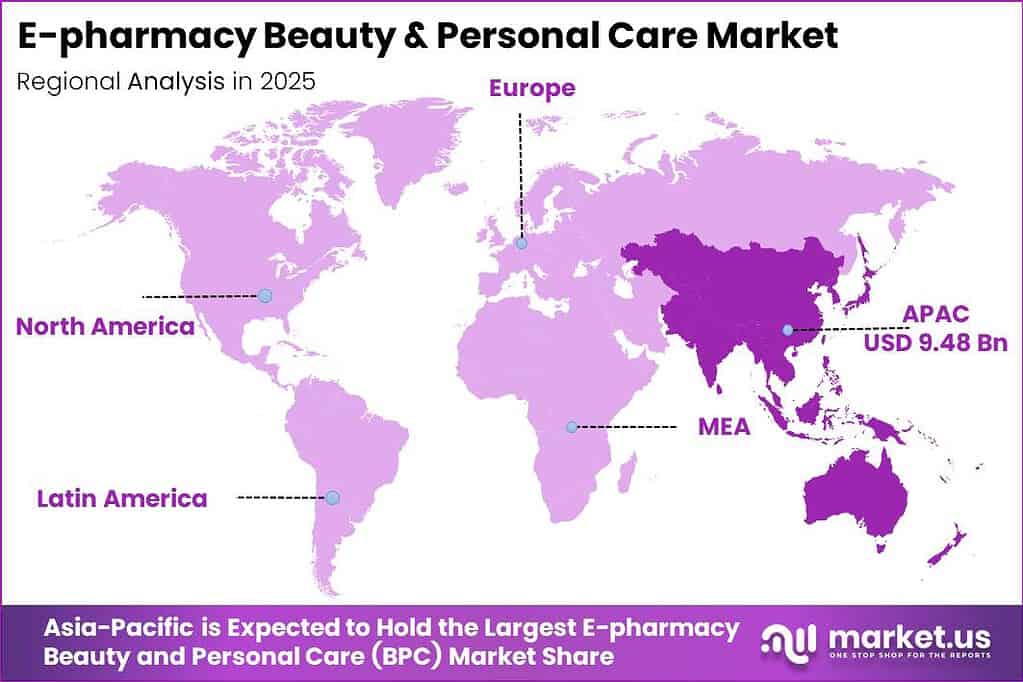
- Asia-Pacific dominated the regional landscape in 2025 with a 35.00% market share, valued at USD 9.48 Billion.
Strict federal safety mandates govern how manufacturers formulate, register, and distribute active cosmetic products sold through digital pharmacies. As reported by U.S. Food and Drug Administration , mandatory filings under the Modernization of Cosmetics Regulation Act reached 16,398 active cosmetic product facilities and 1,298,361 active cosmetic product listings as of June 30, 2026. Mandatory facility registration forces unverified third-party sellers out of digital channels. This means compliant e-pharmacies gain market share as consumers prioritize verified clinical sourcing.
Retail conglomerates are expanding physical and digital touchpoints to capture premium skincare spending. In November 2024, a major Indian retail operator unveiled a luxury beauty flagship store spanning 6,200 square feet at Jio World Plaza in Mumbai featuring 15 shop-in-shop luxury boutiques, virtual try-on technology, and skincare treatment suites. The operator also invested in a UK facial fitness brand to scale studios over 5 years. As a result, omnichannel pharmacies can cross-sell high-margin clinical treatments to digital pharmacy subscribers.
Asia-Pacific dominates the global market with a 35.00% share in 2025, supported by rapid digital adoption and expanding pharmacy delivery networks across urban centers. Meanwhile, European digital infrastructure also sets a benchmark for online pharmacy uptake. Data from Eurostat shows that 95% of European Union individuals aged 16 to 74 used the internet in 2025, and 78% of those internet users bought goods or services online, up from 62% in 2015. High internet penetration directly lowers digital customer acquisition costs for regional e-pharmacies.
Leading digital platforms are also acquiring direct-to-consumer skincare formulators to capture full manufacturing margins. In August 2024, a major Indian beauty and wellness e-retailer completed the acquisition of an additional 39% equity stake in a clinical skincare brand for INR 265 Crore . This transaction raised its total ownership from 51% to 90% and lifted its owned-brand portfolio annualized gross merchandise value run-rate by 49% in fiscal 2026 . Therefore, vertical integration into proprietary skincare brands protects e-pharmacy gross margins against third-party wholesale price inflation.
Product Type Analysis
Skincare Products dominates with 26.00% share in 2025 due to high clinical regimen repeat purchases.
In 2025, Skincare Products held a 26.00% share in the Product Type segment of the E-pharmacy Beauty and Personal Care (BPC) Market. Cosmetics Europe found that skincare represents the largest category in the European cosmetics and personal care sector, valued at EUR 32.3 Billion in retail sales in 2025. Active epidermal formulations such as retinoids, ceramides, and niacinamide require continuous cellular turnover cycles of 6 to 12 weeks to maintain barrier repair. Therefore, e-pharmacy operators achieve predictable recurring revenue by locking skincare buyers into automated refill subscriptions.
Hair Care Products address scalp pathologies including androgenetic alopecia, seborrheic dermatitis, and follicular thinning through medicated shampoos and topical serums. Based on Cosmetics Europe data , hair care products generated EUR 20.3 Billion in European retail sales in 2025, while toiletries accounted for EUR 26.4 Billion across the region. Active scalp treatments containing ketoconazole, minoxidil, and salicylic acid require pharmacist verification to prevent dermal irritation and systemic absorption risks. Consequently, digital pharmacies capture higher basket values by bundling diagnostic trichology consultations with multi-month hair regimens.
Makeup and Color Cosmetics on e-pharmacy platforms focus on non-comedogenic, hypoallergenic, and mineral-based pigments designed for post-procedure and acne-prone skin. Cosmetics Europe indicates that online buyers of cosmetics, beauty, and wellness products reached 31.3% of all European Union online shoppers in 2024, while the total population share buying cosmetics online rose 35% from 13.9% in 2020 to 18.8% in 2024, according to Eurostat . Dermatological patients require iron-oxide and zinc-oxide color formulations that conceal erythema without occluding sebaceous glands. This signals that e-pharmacies should stock tinted dermatological sunscreens to increase cross-category conversion.
Product Category Analysis
Over-the-Counter (OTC) Beauty and Personal Care Products dominates with 32.00% share in 2025 due to immediate purchase accessibility without prescriptions.
In 2025, Over-the-Counter (OTC) Beauty and Personal Care Products held a 32.00% share in the Product Category segment of the E-pharmacy Beauty and Personal Care (BPC) Market. Figures from Redcare Pharmacy N.V. Annual Report show that non-prescription OTC beauty, personal care, and wellness revenue grew 15.5% year-over-year to EUR 1.9 Billion in 2025, up from EUR 1.6 Billion in 2024. Non-prescription barrier creams, emollients, and medicated cleansers bypass physician authorization gates, allowing immediate checkout alongside routine medication refills. This means e-pharmacies can deploy checkout recommendation algorithms on OTC items to boost blended order margins.
Prescription-Based Dermatology Products encompass high-potency topical corticosteroids, tretinoin, calcineurin inhibitors, and oral isotretinoin dispensed under licensed medical supervision. According to World Health Organization, skin and subcutaneous diseases accounted for 4.69 Billion incident cases globally and caused 41.9 Million disability-adjusted life years, ranking among the top 10 causes of disability worldwide. High global prevalence of chronic inflammatory dermatoses necessitates regulated prescription therapy to control flare-ups and prevent secondary bacterial infections. Therefore, e-pharmacies that integrate asynchronous teledermatology prescribing capture high-retention patient cohorts.
Natural and Organic Beauty Products utilize botanical extracts, cold-pressed plant oils, and biodegradable surfactants free from synthetic parabens and sulfates. As reported by U.S. Food and Drug Administration , mandatory MoCRA filings as of January 1, 2025 recorded 9,528 active cosmetic manufacturing facilities, including 1,800 domestic and 7,732 foreign sites, alongside 589,762 listed products. In October 2026, Walgreens Boots Alliance launched clean skincare brand Facetheory, serving over 700,000 direct-to-consumer customers, across 224 Boots UK stores . Botanical formulations require verified stability testing and preservative efficacy, pushing clean beauty brands into trusted pharmacy channels.
Delivery Model Analysis
Standard Delivery dominates with 31.00% share in 2025 due to lower shipping costs on planned orders.
In 2025, Standard Delivery held a 31.00% share in the Delivery Model segment of the E-pharmacy Beauty and Personal Care (BPC) Market. Data from Redcare Pharmacy N.V. Annual Report shows that consolidated group revenue increased 24.1% year-over-year to EUR 2,940.9 Million in 2025, with active customer average revenue per basket reaching EUR 179.83. Non-urgent personal care regimens and bulk skincare replenishments allow centralized warehouse batching and parcel consolidation over 2 to 5 business days. Consequently, e-pharmacies maximize fulfillment profitability by steering high-volume routine baskets toward standard ground shipping.
Same-Day Delivery fulfills acute dermatological treatments, sun care, and urgent personal hygiene items within hours of order placement through urban micro-fulfillment centers. Amazon.com, Inc. found that expanding Amazon Pharmacy 3-hour rapid prescription and healthcare delivery to more than 350 U.S. cities by Q3 2026 drove a 60% year-over-year increase in active customers and a 50% increase in repeat buyers. Acute flare-ups of eczema, contact dermatitis, and cold sores require immediate topical intervention to halt symptom progression. This creates a defensive moat for operators with dense urban pharmacy nodes.
Express Delivery provides sub-hour and 1-to-2 hour hyperlocal dispatch by pairing retail pharmacy inventory with on-demand courier fleets. Based on Walmart Inc. Form 10-K data, Walmart U.S. e-commerce net sales reached USD 99.6 Billion in fiscal 2026, rising from USD 79.3 Billion in fiscal 2025 and USD 65.4 Billion in fiscal 2024 through store-fulfilled pickup and delivery. Utilizing existing brick-and-mortar pharmacy shelves as forward dark stores eliminates long-haul line-haul transit times for temperature-sensitive cosmeceuticals. Therefore, omnichannel retailers can monetize express delivery fees while increasing store inventory turns.
Platform Type Analysis
Online Marketplaces dominates with 31.00% share in 2025 due to broad multi-brand assortment and traffic scale.
In 2025, Online Marketplaces held a 31.00% share in the Platform Type segment of the E-pharmacy Beauty and Personal Care (BPC) Market. Eurostat indicates that 23.59% of European Union enterprises conducted e-sales in 2024, generating 19.49% of total enterprise turnover from e-sales, with website and app sales accounting for 8.39% of turnover. Aggregated marketplace ecosystems combine pharmacy storefront modules with millions of active daily shoppers, lowering customer acquisition costs for emerging dermo-cosmetic brands. This means beauty manufacturers must optimize marketplace retail media spend to capture high-intent search traffic.
Pure-Play E-Pharmacy Platforms operate dedicated digital dispensaries focused exclusively on prescription medications, over-the-counter therapeutics, and pharmacy-grade dermo-cosmetics. Figures from DocMorris AG Annual Report show that consolidated net revenue rose 11% to CHF 1,124.5 Million and external revenue reached CHF 1,185.7 Million in 2025 across more than 10 Million active customers. Dedicated digital pharmacies utilize automated central dispensing robots and clinical tele-pharmacists to cross-sell hypoallergenic skincare directly to chronic medication patients. Consequently, pure-play operators achieve lower unit fulfillment costs than fragmented store networks.
Omnichannel Pharmacy Platforms integrate physical drugstore chains with mobile apps, click-and-collect lockers, and local store delivery networks. According to U.S. Census Bureau , U.S. Health and Personal Care Stores recorded USD 340,615 Million in retail sales during the first 9 months of 2026, with September 2026 sales reaching USD 39,535 Million, including USD 34,759 Million at pharmacies and drug stores. In January 2026, Kroger Health surpassed 250,000 students trained in its Prescription Drug Safety program across 2,200 pharmacies in 35 states and 220 clinic locations . Physical pharmacy footprints build clinical trust that increases online conversion rates.
Key Market Segments
By Product Type
- Skincare Products
- Hair Care Products
- Makeup and Color Cosmetics
- Bath and Body Care Products
- Oral Care Products
- Feminine Hygiene Products
- Baby Care Products
- Other Beauty and Personal Care Products
By Product Category
- Over-the-Counter (OTC) Beauty and Personal Care Products
- Prescription-Based Dermatology Products
- Natural and Organic Beauty Products
- Dermatologically Tested / Cosmeceutical Products
- Premium and Luxury Beauty Products
- Mass-Market Beauty Products
By Delivery Model
- Standard Delivery
- Same-Day Delivery
- Express Delivery
- Subscription-Based Delivery
- Click-and-Collect / Store Pickup
By Platform Type
- Online Marketplaces
- Pure-Play E-Pharmacy Platforms
- Omnichannel Pharmacy Platforms
- Brand-Owned Direct-to-Consumer Websites
- Health and Wellness Platforms
Regional Analysis
Asia-Pacific Dominates the E-pharmacy Beauty and Personal Care (BPC) Market with a Market Share of 35.00% in 2025, Valued at USD 9.48 Billion
Asia-Pacific leads the global market with a 35.00% revenue share in 2025, valued at USD 9.48 Billion, propelled by dense urban populations and rapid quick-commerce pharmacy expansion in India, China, and Southeast Asia. As reported by FSN E-Commerce Ventures Ltd. , Nykaa consolidated revenue from operations grew 26.05% year-over-year to INR 10,022.35 Crore in fiscal 2026, while its Beauty vertical gross merchandise value rose 27% to INR 14,954 Crore across online channels and 313 physical stores in 99 cities. High mobile payment adoption enables regional platforms to scale dermo-cosmetic delivery into secondary cities.
Europe represents a mature digital pharmacy landscape supported by mandatory electronic prescription rollouts in Germany and high per-capita dermo-cosmetic expenditure across Western Europe. Data from Cosmetics Europe shows that European cosmetics and personal care retail sales reached EUR 110 Billion in 2025, rising from EUR 104 Billion in 2024, led by Germany at EUR 18.0 Billion and the United Kingdom at EUR 14.7 Billion. Strict European Union chemical safety regulations favor pharmacy-backed skincare brands over unverified imports. Therefore, European mail-order pharmacies capture steady cross-border demand for clinical skincare lines.
Key Regions and Countries
North America
- US
- Canada
Europe
- Germany
- France
- The UK
- Spain
- Italy
- Rest of Europe
Asia Pacific
- China
- Japan
- South Korea
- India
- Australia
- Rest of APAC
Latin America
- Brazil
- Mexico
- Rest of Latin America
Middle East and Africa
- GCC
- South Africa
- Rest of MEA
Market Dynamics
Consumer migration toward clinically backed self-care regimens and rapid pharmacy fulfillment is reshaping unit economics across global health and beauty retail. Eurostat found that among European Union individuals aged 16 to 74 in 2024, 14.6% purchased medicine and dietary supplements online, marking a 22% increase since 2020, while 11.4% bought cleaning and personal hygiene products online, up 37% from 8.4% in 2020. Rising digital propensity for health and hygiene purchases allows e-pharmacies to amortize logistics fixed costs across higher order frequencies.
Drivers
Consumers are shifting trust away from mass-prestige cosmetics toward clinically validated dermo-cosmetic formulations containing niacinamide, retinoids, ceramides, and azelaic acid. Between 2024 and 2025, major beauty groups reported dermatological division growth at 2 to 3 times the rate of mass-market lines. On e-pharmacy platforms, products paired with teleconsultations or pharmacist chats convert at 1.5 to 2 times the rate of standard beauty listings, while average order values run 20% to 30% higher.
Regimen-based skincare also shortens repeat purchase cycles to 45 to 60 days. Commercially, this shift allows e-pharmacies to transition from discount-heavy customer acquisition to subscription models where acquisition costs are recovered within 2 to 3 orders instead of 5 to 6 orders. Brand-funded retail media placements add 150 to 300 basis points to blended gross margins. Consequently, pharmacy operators can offset thin prescription dispensing margins and improve platform profitability.
| Driver | (~) % Impact on CAGR Forecast | Geographic Relevance | Impact Timeline |
|---|---|---|---|
| Dermatology-Led Skincare Demand via Pharmacy Channels | +2.8% | Global, strongest in North America, Western Europe, India | Short term (≤ 2 years) |
| Quick-Commerce and Same-Day Pharmacy Fulfilment | +2.2% | India, Southeast Asia, Middle East | Short term (≤ 2 years) |
| Smartphone and Digital Payment Penetration in Tier-2/3 Cities | +1.9% | India, Indonesia, Brazil, Africa | Medium term (2–4 years) |
| Social Commerce and Influencer-Driven Discovery | +1.5% | Global, led by China and US | Short term (≤ 2 years) |
| Ageing Population Spending on Personal Care | +1.2% | Japan, Europe, North America, China | Long term (≥ 4 years) |
| Pharmacy Private-Label BPC Expansion | +0.9% | Europe, North America, India | Medium term (2–4 years) |
Restraints
Regulatory ambiguity across developing markets restricts the online dispensing of medicated beauty and personal care products. In India, draft e-pharmacy rules notified in 2018 remain unfinalized due to legal challenges and opposition from chemist associations representing 12 Lakh offline retailers. Similar licensing gaps persist across Southeast Asia and Latin America for topical retinoids, hydroquinone, and minoxidil. As a result, digital platforms must delist or geo-block 15% to 25% of medicated stock-keeping units in contested jurisdictions.
State-by-state licensing and pharmacist-of-record staffing requirements add INR 8 to 15 in compliance costs per order and delay regional expansion by 6 to 12 months. This regulatory friction compresses platform contribution margins by 100 to 200 basis points and deters late-stage institutional capital. Therefore, e-pharmacy operators must delay dark-store infrastructure rollouts to 2027 and 2028, capping near-term revenue capture in high-growth regional markets.
| Restraint | (~) % Impact on CAGR Forecast | Geographic Relevance | Impact Timeline |
|---|---|---|---|
| Unresolved E-Pharmacy Legal Status and Licensing Gaps | -1.8% | India, parts of Southeast Asia, Latin America | Short term (≤ 2 years) |
| Cosmetic Ingredient Bans and Reformulation Mandates | -1.2% | European Union, United States, UK | Short term (≤ 2 years) |
| Cross-Border Shipping Restrictions on Regulated BPC SKUs | -0.9% | China, GCC, ASEAN | Medium term (2–4 years) |
| Deep-Discount Prohibitions and Price Controls | -0.7% | India, Germany, France | Short term (≤ 2 years) |
| Elevated Cost of Capital for Venture-Backed Platforms | -0.6% | Global, acute in India and Europe | Short term (≤ 2 years) |
Challenges
Fragmented multi-tier wholesale distribution exposes digital platforms to counterfeit and grey-market dermo-cosmetic infiltration. Imported skincare products frequently pass through 3 to 5 intermediary tiers before reaching pharmacy warehouses, allowing diverted parallel imports and relabeled expired stock to enter inventory. Customs enforcement records from 2024 and 2025 rank cosmetics among the top seized counterfeit categories, while brand protection teams estimate that 10% to 20% of high-value skincare listings on emerging open marketplaces are non-genuine.
Product authenticity disputes increase customer return rates by 2 to 4 percentage points, while serialization and batch-traceability audits add 1% to 2% to cost of goods sold. A single counterfeit incident reduces category repeat purchases by 15% to 30% among affected buyers. Consequently, e-pharmacies must increase working capital commitments to establish direct brand sourcing, unit-level QR serialization, and automated seller-risk scoring to protect clinical trust.
| Challenge | (~) % CAGR Friction Drag | Geographic Relevance | Mitigation Horizon |
|---|---|---|---|
| Counterfeit and Grey-Market Infiltration | -1.4% | India, China, Southeast Asia, Africa | Medium term (2–4 years) |
| Cold-Chain and Temperature-Sensitive Logistics | -0.8% | India, Middle East, Latin America | Medium term (2–4 years) |
| High Return and Damage Rates | -0.6% | Global | Short term (≤ 2 years) |
| Licensed Pharmacist Talent Shortage | -0.5% | United States, UK, India | Long term (≥ 4 years) |
| Health Data Privacy Compliance Burden | -0.4% | European Union, India, United States | Medium term (2–4 years) |
Opportunities
Integrating image-based artificial intelligence skin diagnostics with asynchronous teledermatology and automated prescription fulfillment represents a major commercial white space. Most digital platforms currently limit artificial intelligence to basic product recommendation carousels while consumers self-direct their purchases. Structural specialist shortages, including roughly 1 dermatologist per 1 Lakh people in India and multi-week wait times across Europe and North America, create substantial unmet demand for accessible clinical skincare guidance.
Closed-loop diagnostic bundles unlock consultation fees of USD 10 to 30 per session and regimen subscriptions with 60% to 70% projected retention at 6 months. Bundled diagnostic regimens can raise average order values by 35% to 50%, lower acquisition costs per retained customer by 25% to 40%, and expand gross margins by 300 to 500 basis points through private-label or compounded formulations. Early movers investing in Fitzpatrick I to VI diagnostic models will capture sticky recurring revenue.
| Opportunity | (~) % Potential CAGR Upside | Geographic Relevance | Execution Window |
|---|---|---|---|
| AI Skin Diagnostics with Teledermatology Bundles | +1.6% | North America, Europe, India, GCC | Medium term (2–4 years) |
| Retail Media Network Monetization | +1.2% | United States, India, Europe | Short term (≤ 2 years) |
| Men’s Grooming and Hair-Loss Therapeutics | +1.0% | Global, led by India and US | Short term (≤ 2 years) |
| Nutricosmetics and Ingestible Beauty | +0.8% | Asia-Pacific, Europe | Medium term (2–4 years) |
| Roll-Up of Regional Pharmacy Chains | +0.6% | India, Southeast Asia, Latin America | Long term (≥ 4 years) |
Key Company Insights
CVS Health Corporation / CVS Pharmacy
CVS Health Corporation operates an integrated healthcare, pharmacy benefit management, and omnichannel retail pharmacy network across the United States. Based on CVS Health Form 10-K data , consolidated total revenues reached USD 402,067 Million in 2025, up 7.8% from USD 372,809 Million in 2024, while Pharmacy and Consumer Wellness revenue rose 11.9% to USD 139,367 Million, including USD 115,510 Million in pharmacy and USD 21,459 Million in front-store retail across 1.8 Billion filled prescriptions representing 28.5% U.S. share. This retail scale supports nationwide same-day beauty and prescription delivery.
European digital pharmacy competitors are simultaneously raising capital to scale electronic prescription and over-the-counter dermo-cosmetic fulfillment. In May 2025, DocMorris AG indicates that shareholders approved and completed an ordinary capital increase via a 1-for-1 rights issue on the SIX Swiss Exchange generating CHF 200 Million in gross proceeds, recorded at CHF 212.4 Million in first-half financial statements, to fund German e-prescription growth and repay its CHF 95 Million convertible bond. Consequently, major pharmacy platforms are strengthening balance sheets to fund digital patient acquisition.
Walgreens Boots Alliance, Inc.
Walgreens Boots Alliance, Inc. manages an international retail pharmacy and health and beauty omnichannel platform across the United States, the United Kingdom, and Europe. Figures from Walgreens Boots Alliance Form 10-K show that fiscal 2024 consolidated sales reached USD 147.7 Billion, comprising USD 88,867 Million in U.S. pharmacy sales and USD 26,911 Million in U.S. front-store retail, while Boots UK online sales grew 18.7% in Q3 fiscal 2025 to represent 17% of total retail sales. Strong digital beauty demand stabilizes front-store retail margins.
Walgreens continues to expand its prescription and patient base through strategic pharmacy network agreements with major health services organizations. According to Evernorth Health Services Official Release, Cigna Healthcare and Express Scripts division Evernorth reached a definitive agreement in November 2025 to transfer prescription files from 9 Evernorth Care Group retail pharmacies to Walgreens by December 2025 while launching a rebate-free cost-plus pharmacy reimbursement model for 2026. Therefore, retail pharmacy consolidators gain recurring patient traffic to cross-sell over-the-counter personal care regimens.
Key Players
- Amazon.com, Inc. / Amazon Pharmacy
- CVS Health Corporation
- Walgreens Boots Alliance, Inc.
- Walmart Inc. / Walmart Pharmacy
- DocMorris AG / Zur Rose Group
- Redcare Pharmacy N.V. / Shop Apotheke Europe
- Cigna Healthcare / Express Scripts
- Optum Rx / UnitedHealth Group Incorporated
- LloydsPharmacy Limited
- The Kroger Co.
- Giant Eagle, Inc.
- Nykaa E-Retail Pvt. Ltd.
- Flipkart Private Limited
- Reliance Retail Ltd. / Netmeds
- Apollo HealthCo Ltd. / Apollo 24
Recent Developments
2026
- September 2026: DocMorris AG completed a funding placement of CHF 96.8 Million in 1.50% convertible bonds due 2031 after an initial launch of CHF 100 Million to repurchase CHF 49.6 Million of 2028 convertible bonds and reduce underlying shares from 7.6 Million to 7.0 Million, according to Deutsche Borse .
- September 2026: Nykaa E-Retail Pvt. Ltd. completed the acquisition of the remaining 24.17% equity stake representing 20,864 shares in clean beauty brand Earth Rhythm for INR 9.4 Crore to reach 100% ownership following prior investments of INR 41.65 Crore in 2022 and INR 44.5 Crore in 2024, as reported by NSE Stock Exchange Filing .
- February 2026: Amazon.com, Inc. announced a capacity expansion of Amazon Pharmacy Same-Day delivery to 4,500 U.S. cities and towns by the end of 2026, adding 2,000 new communities and 20 new micro-pharmacies inside distribution centers, based on Amazon Official Release data .
2025
- October 2025: CVS Health Corporation finalized the acquisition and takeover of 63 former Rite Aid and Bartell Drugs retail stores across 3 states and prescription files from 626 pharmacies across 15 states, adding 9 Million patients and 3,500 employees, according to CVS Health Official Release .
- August 2025: Walgreens Boots Alliance, Inc. completed its acquisition by Sycamore Partners in a transaction valued at up to USD 23.7 Billion, comprising USD 11.45 per share in cash or USD 10 Billion equity value plus USD 3.00 per share in contingent rights, splitting into 5 standalone companies, as reported by Sycamore Partners Press Release .
- June 2025: Apollo HealthCo Ltd. completed an investment of INR 2,475 Crore or USD 300 Million from Advent International for a 12.1% stake and approved a merger with Keimed Private Limited valued at INR 8,003 Crore and Apollo HealthCo at INR 14,478 Crore for a combined enterprise value of INR 22,481 Crore or USD 2.7 Billion while adding 663 pharmacy stores in fiscal 2026, data from Apollo Hospitals Corporate Filing shows .
- April 2025: Redcare Pharmacy N.V. issued EUR 300 Million in convertible bonds due 2032 in EUR 100,000 denominations at a 1.75% to 2.25% coupon and repurchased EUR 157.9 Million of its EUR 225 Million 2028 bonds to fund Sevenum warehouse automation that doubles capacity and cuts labor cost per order by 70% by end-2026, Redcare Pharmacy Ad Hoc Release found.
2024
- October 2024: Walmart Inc. launched nationwide Same-Day and 30-minute Express Pharmacy Delivery combining prescriptions, over-the-counter items, and general merchandise in a single order priced free for Walmart+ members or USD 9.95 standard fee across 4,600 stores in 49 U.S. states by January 2025, Walmart Corporate Release indicates .
Geopolitical Impact Analysis
Maritime chokepoint disruptions in the Red Sea and Suez Canal directly elevate freight costs for imported cosmetic active ingredients and packaging components. Data from UNCTAD shows that global maritime trade reached 12,720 Million tons in 2024, up 2.2%, while Cape of Good Hope rerouting increased ton-miles by 6% and pushed the Shanghai Containerized Freight Index up 149% to an average of 2,496 points in 2024, with Shanghai to Jebel Ali spot rates rising 55% between May and June 2025. World Shipping Council found that global liner shipping transported 280 Million containers in 2025, up from 250 Million in 2024, losing 1,478 containers or 0.0005%, while carriers transport over USD 4 Trillion in annual trade and invested over USD 200 Billion in 1,352 dual-fuel vessels. Extended container transit times delay shipments of Asian niacinamide, hyaluronic acid, and airless pump dispensers, forcing e-pharmacies to hold 30 to 45 days of buffer inventory.
Shifting tariff regimes and energy price volatility also alter cross-border procurement economics for digital pharmacy distributors. Based on World Trade Organization data , global merchandise trade volume grew 3.5% in the first half of 2026 and is forecast to expand 3.9% in full-year 2026 and 4.1% in 2027, while South-South trade between developing economies reached USD 7.2 Trillion in 2025, or 27.8% of global exports. International Monetary Fund indicates that global gross domestic product growth will slow from 3.4% in 2025 to 3.1% in 2026 before reaching 3.4% in 2027, while global headline inflation will rise from 4.1% in 2025 to 4.7% in 2026. Higher petrochemical and energy inflation raises production costs for polyethylene glycol bases, titanium dioxide UV filters, and polypropylene jars, prompting e-pharmacies to expand regional contract manufacturing.
Report Scope
| Report Features | Description |
|---|---|
| Market Value (2025) | USD 27.1 Billion |
| Forecast Revenue (2035) | USD 98.0 Billion |
| CAGR (2026-2035) | 13.7% |
| Base Year for Estimation | 2025 |
| Historic Period | 2021-2025 |
| Forecast Period | 2026-2035 |
| Report Coverage | Revenue Forecast, Market Dynamics, Market Opportunity Analysis, Technology and Innovation Landscape, Competitive Landscape, Recent Developments |
| Segments Covered | By Product Type (Skincare Products, Hair Care Products, Makeup and Color Cosmetics, Bath and Body Care Products, Oral Care Products, Feminine Hygiene Products, Baby Care Products, Other Beauty and Personal Care Products), By Product Category (Over-the-Counter (OTC) Beauty and Personal Care Products, Prescription-Based Dermatology Products, Natural and Organic Beauty Products, Dermatologically Tested / Cosmeceutical Products, Premium and Luxury Beauty Products, Mass-Market Beauty Products), By Delivery Model (Standard Delivery, Same-Day Delivery, Express Delivery, Subscription-Based Delivery, Click-and-Collect / Store Pickup), By Platform Type (Online Marketplaces, Pure-Play E-Pharmacy Platforms, Omnichannel Pharmacy Platforms, Brand-Owned Direct-to-Consumer Websites, Health and Wellness Platforms) |
| Regional Analysis | North America (US and Canada), Europe (Germany, France, The UK, Spain, Italy, and Rest of Europe), Asia Pacific (China, Japan, South Korea, India, Australia, and Rest of APAC), Latin America (Brazil, Mexico, and Rest of Latin America), Middle East and Africa (GCC, South Africa, and Rest of MEA) |
| Competitive Landscape | Amazon.com, Inc. / Amazon Pharmacy, CVS Health Corporation / CVS Pharmacy, Walgreens Boots Alliance, Inc., Walmart Inc. / Walmart Pharmacy, DocMorris AG / Zur Rose Group, Redcare Pharmacy N.V. / Shop Apotheke Europe, Cigna Healthcare / Express Scripts, Optum Rx / UnitedHealth Group Incorporated, LloydsPharmacy Limited, The Kroger Co., Giant Eagle, Inc., Nykaa E-Retail Pvt. Ltd., Flipkart Private Limited, Reliance Retail Ltd. / Netmeds, Apollo HealthCo Ltd. / Apollo 24 |
| Customization Scope | Customization for segments, region / country-level will be provided. Additional customization can be done based on requirements. |
| Purchase Options | We have three licenses to opt for: Single User License | Multi-User License (Up to 5 Users) | Corporate Use License (Unlimited User and Printable PDF) |