
Quick Navigation
- Report Overview
- Top Market Takeaways
- Key Insights Summary
- Drivers Impact Analysis
- Risk Impact Analysis
- Restraint Impact Analysis
- By Component
- By Deployment Mode
- By Organization Size
- By Functionality
- By Application
- By Vertical
- By Region
- Investor Type Impact Matrix
- Technology Enablement Analysis
- Emerging Trends
- Growth Factors
- Opportunity
- Challenge
- Key Market Segments
- Competitive Analysis
- Recent Developments
- Report Scope
Report Overview
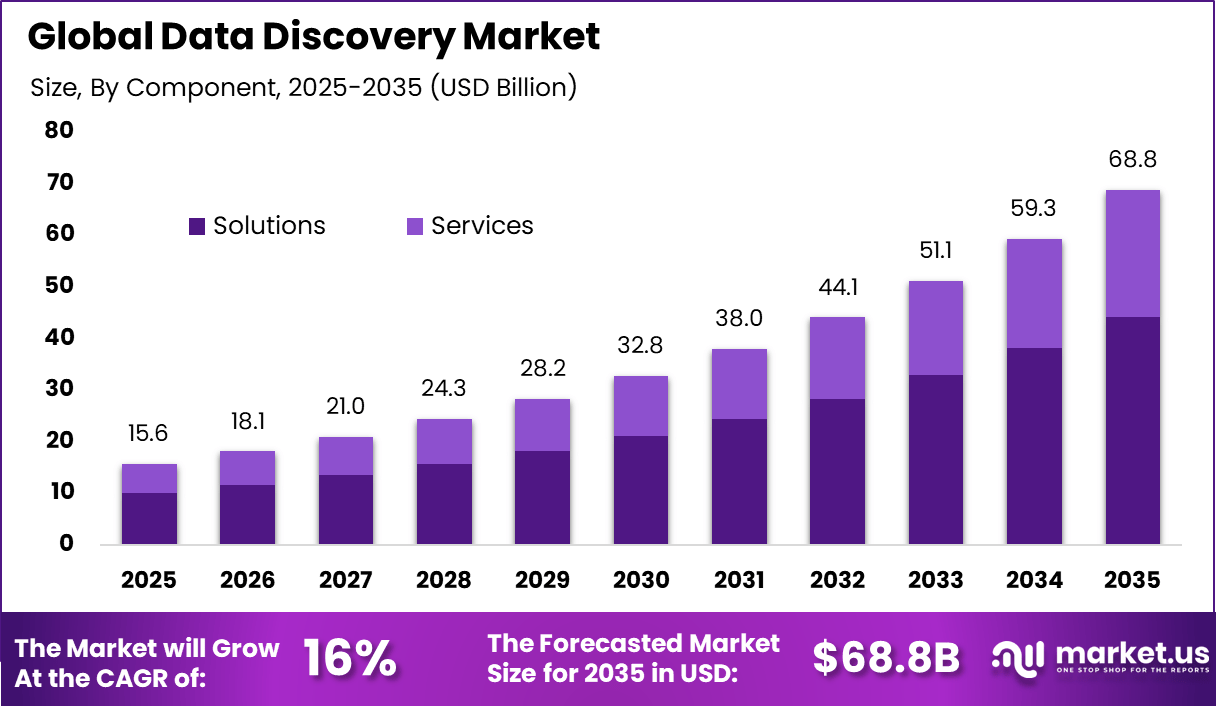
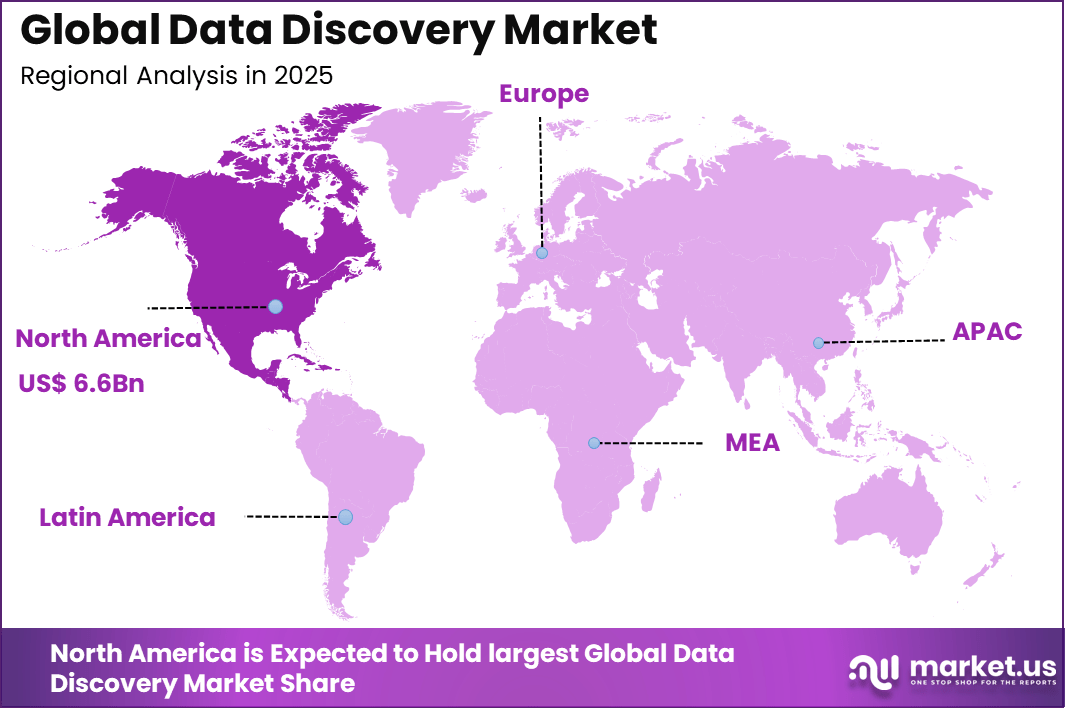
The Global Data Discovery Market size is expected to be worth around USD 68.8 Billion By 2035, from USD 15.6 billion in 2025, growing at a CAGR of 16% during the forecast period from 2026 to 2035. North America held a dominan Market position, capturing more than a 38.9% share, holding USD 6.6 Billion revenue.
The data discovery market refers to tools and platforms that help organizations identify, explore, and understand data across structured and unstructured sources. These solutions enable users to locate datasets, visualize patterns, and uncover relationships without deep technical expertise. Data discovery platforms are used by business users, analysts, and data teams to improve accessibility and insight generation.
The market supports faster decision making by reducing dependency on manual data preparation. One major driving factor of the data discovery market is the need for faster and more informed decision making. Business leaders require timely insights to respond to market changes and operational challenges. Data discovery tools enable quick exploration and visualization of data without long development cycles. This speed advantage strongly drives adoption.
Demand for data discovery solutions is influenced by digital transformation initiatives across industries. As organizations modernize operations, they generate more data that must be understood and leveraged. Data discovery helps translate raw data into actionable insights. This demand is strong in sectors such as finance, retail, healthcare, and manufacturing.
Artificial intelligence and machine learning technologies are increasingly embedded in data discovery platforms. These technologies automate data profiling, pattern detection, and insight recommendations. AI driven assistance reduces manual exploration effort and improves accuracy. Intelligent features make data discovery more accessible to a wider user base.
Investment opportunities in the data discovery market exist in platforms that combine discovery with governance and security features. Organizations seek solutions that balance accessibility with control over sensitive data. Tools that integrate discovery with role based access and data lineage offer strong value. These capabilities align with enterprise requirements.
Top Market Takeaways
- Solutions led the market with a 64.3% share, indicating strong enterprise preference for comprehensive data discovery platforms that combine data preparation, analysis, and insight generation within a single environment.
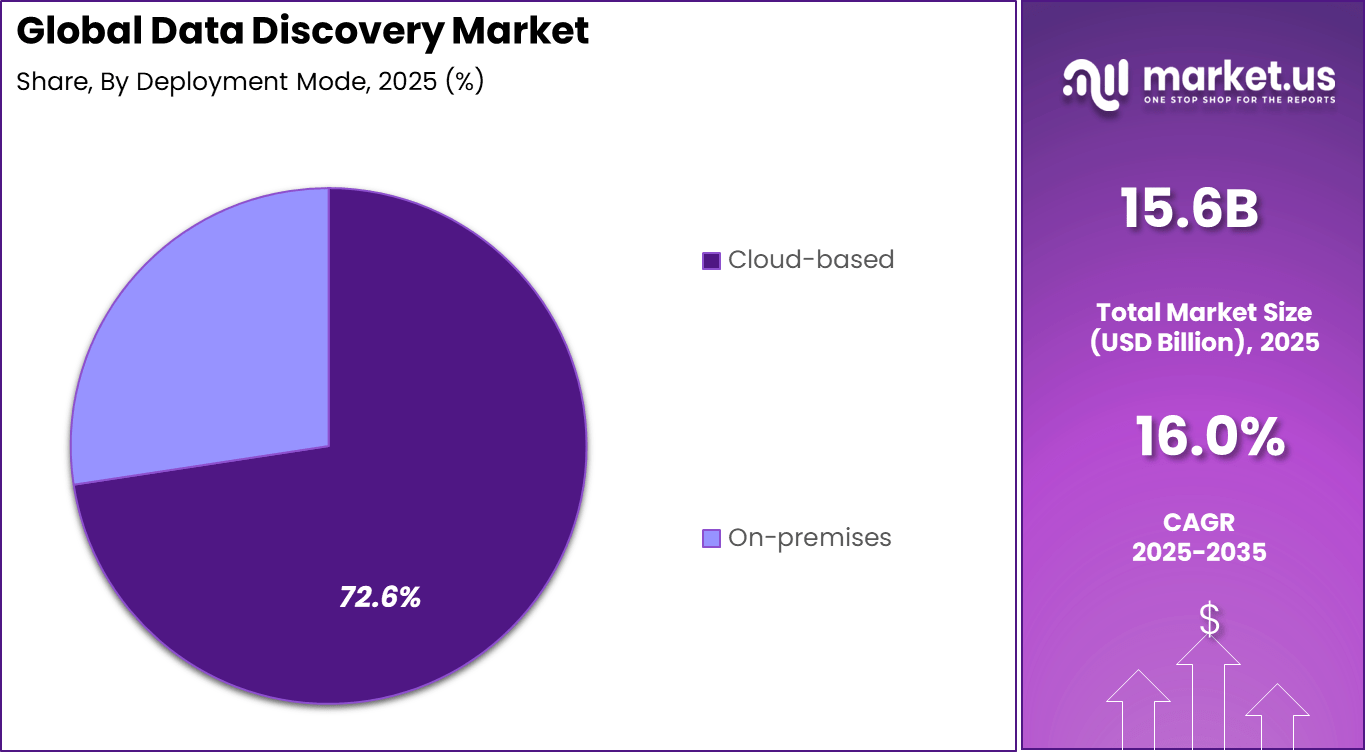
- Cloud based deployment dominated with a 72.6% share, reflecting demand for scalable access, lower infrastructure burden, and easier collaboration across distributed teams.
- Large enterprises accounted for 68.2% of adoption, driven by complex data landscapes, high data volumes, and the need for enterprise wide visibility and governance.
- Visual data discovery emerged as the leading functionality with a 35.4% share, highlighting the importance of intuitive dashboards and interactive analytics for faster decision making.
- Sales and marketing management represented the top application area at 31.7%, supported by rising use of data driven customer insights, campaign performance tracking, and revenue optimization.
- The BFSI sector held a 23.9% share, as financial institutions relied on data discovery tools to support risk analysis, compliance reporting, and customer intelligence.
- North America maintained regional leadership with a 38.9% share, supported by advanced analytics adoption, mature cloud ecosystems, and strong enterprise investment in data platforms.
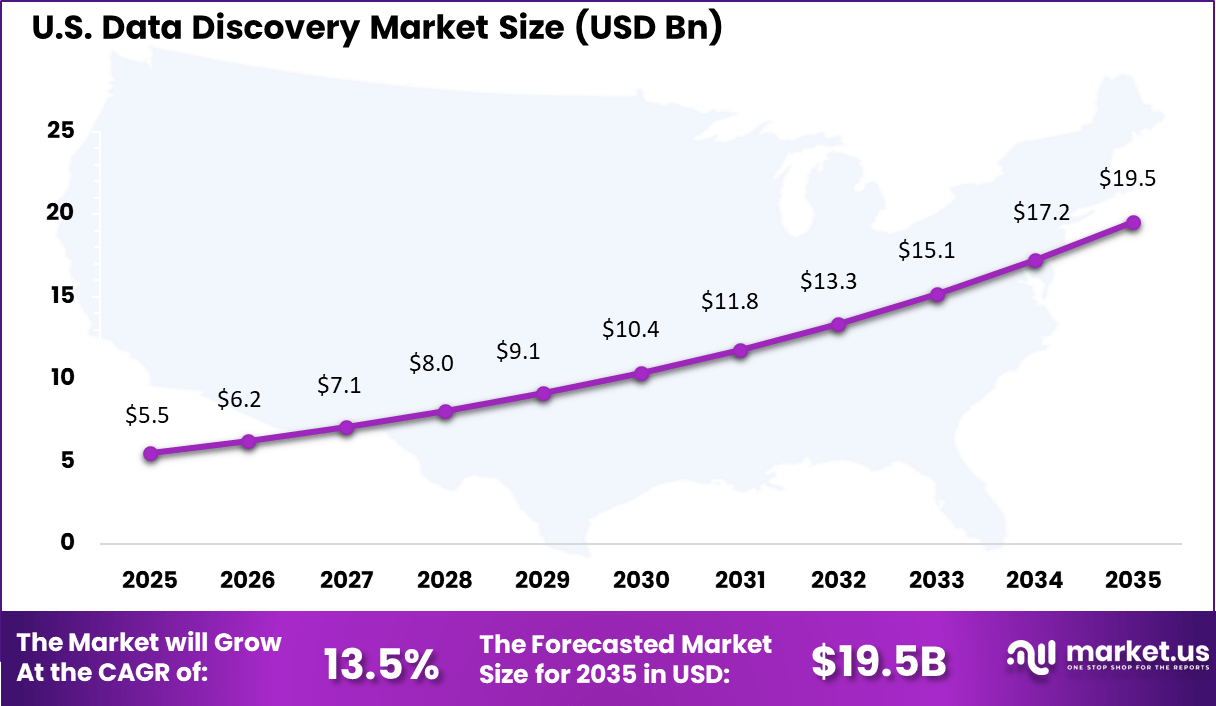
- The United States remained a major contributor, with market activity valued at USD 5.56 billion, reflecting high concentration of large enterprises and analytics driven business operations.
Key Insights Summary
Market Adoption and Usage Trends
- Adoption of data discovery tools expanded rapidly, rising from 18% in 2012 to 58% by 2016. By 2026, close to 80% of organizations were expected to rely on business intelligence platforms for data discovery activities.
- Data driven decision making became a core enterprise priority, with around 77% of organizations embedding analytics into strategic and operational processes.
- Growth in self service analytics was notable, as modern data discovery platforms increased adoption among non technical users by nearly 70% within a year. This shift reduced dependency on centralized data teams.
Data Landscape Insights
- Global data volumes continued to surge, with total data expected to reach 175 zettabytes by 2025. On a daily basis, about 463 exabytes of new data were generated, increasing the need for scalable discovery solutions.
- Unstructured data represented roughly 80% of global information assets, including text, images, and audio. This complexity required advanced discovery methods beyond traditional relational databases.
- A large share of enterprise information remained unused, as up to 80% of collected data was classified as dark data. This limited the value extracted from existing data investments.
- Data silos persisted as a major barrier, with 81% of business leaders reporting difficulty accessing data locked across disconnected systems.
Operational and Security Impact
- Efficiency gains were significant, as data discovery platforms reduced data processing time by up to 90%. This enabled rapid analysis of very large datasets within seconds.
- Predictive outcomes improved, with automated discovery delivering up to 50% higher accuracy compared with manual analytical approaches.
- Security risks increased around unmanaged information, as shadow data accounted for nearly one third of all data breach incidents. These breaches carried an average cost of USD 5.27 million, around 16% higher than the overall breach average.
- Productivity challenges remained, with data scientists spending nearly 80% of their time preparing and cleaning data. Data discovery tools aimed to automate these tasks, allowing greater focus on insight generation and advanced analysis.
Drivers Impact Analysis
| Driver Category | Key Driver Description | Estimated Impact on CAGR (%) | Geographic Relevance | Impact Timeline |
|---|---|---|---|---|
| Growth of enterprise data volumes | Increasing structured and unstructured data generation | ~4.3% | Global | Short Term |
| Demand for self service analytics | Business users seeking faster insights | ~3.7% | North America, Europe | Short to Mid Term |
| Cloud adoption acceleration | Centralized and scalable data access | ~3.2% | Global | Mid Term |
| Regulatory data transparency needs | Requirement to locate and classify data assets | ~2.6% | Europe, North America | Mid Term |
| Integration of AI driven search | Smarter pattern detection and discovery | ~2.2% | Global | Long Term |
Risk Impact Analysis
| Risk Category | Risk Description | Estimated Negative Impact on CAGR (%) | Geographic Exposure | Risk Timeline |
|---|---|---|---|---|
| Data security risks | Exposure of sensitive enterprise information | ~3.4% | Global | Short Term |
| Integration complexity | Difficulty connecting multiple data sources | ~2.8% | Global | Mid Term |
| Skills gap | Lack of data literacy among users | ~2.3% | Global | Mid Term |
| Performance limitations | Slow response on large datasets | ~1.9% | Global | Short Term |
| Vendor lock in | Dependence on proprietary discovery tools | ~1.5% | Global | Long Term |
Restraint Impact Analysis
| Restraint Factor | Restraint Description | Impact on Market Expansion (%) | Most Affected Regions | Duration of Impact |
|---|---|---|---|---|
| High implementation cost | Enterprise wide deployment expense | ~3.6% | Emerging Markets | Short to Mid Term |
| Data quality issues | Incomplete or inconsistent datasets | ~3.0% | Global | Mid Term |
| Change management resistance | User adoption challenges | ~2.4% | Global | Mid Term |
| Tool overlap | Redundancy with BI and analytics platforms | ~2.0% | Global | Long Term |
| Customization limitations | One size solutions not fitting all use cases | ~1.6% | Global | Long Term |
By Component
Solutions account for 64.3%, showing that software platforms are the core of data discovery activities. These solutions help users identify, prepare, and analyze data from multiple sources. Organizations rely on solutions to improve data visibility and understanding. Centralized tools reduce time spent on manual data handling. Ease of use supports broader adoption.
The dominance of solutions is driven by growing data complexity. Enterprises manage large volumes of structured and unstructured data. Data discovery solutions simplify exploration and insight generation. Integration with analytics systems improves effectiveness. This sustains strong demand for solution-based offerings.
By Deployment Mode
Cloud-based deployment holds 72.6%, reflecting strong preference for flexible and scalable environments. Cloud platforms allow users to access data discovery tools from anywhere. They reduce the need for on-site infrastructure. Automatic updates improve system performance and security. Accessibility remains a key benefit.
Adoption of cloud-based deployment is driven by remote and distributed work models. Organizations prefer faster deployment and lower maintenance effort. Cloud systems support collaboration across teams. Improved data security features increase trust. This keeps cloud deployment dominant.
By Organization Size
Large enterprises represent 68.2%, highlighting their leading role in data discovery adoption. These organizations manage complex and diverse data environments. Data discovery tools help improve decision-making across departments. Large enterprises require scalable and reliable platforms. Centralized data access supports governance.
Adoption among large enterprises is driven by digital transformation initiatives. These organizations invest heavily in data-driven strategies. Data discovery supports operational efficiency and planning. Integration with enterprise systems improves value. This sustains strong enterprise demand.
By Functionality
Visual data discovery accounts for 35.4%, making it the most used functionality. Visualization tools help users understand patterns and trends quickly. Charts and dashboards improve data interpretation. Visual insights support faster decisions. Ease of comprehension increases usage.
Growth in visual data discovery is driven by demand for user-friendly analytics. Non-technical users benefit from visual exploration tools. Interactive visuals improve engagement with data. Organizations prefer tools that reduce training needs. This functionality remains central to adoption.
By Application
Sales and marketing management represent 31.7%, making it a key application area. Data discovery tools help analyze customer behavior and campaign performance. Teams use insights to improve targeting and forecasting. Real-time data access supports faster strategy adjustments. Performance tracking becomes more accurate.
Growth in this application is driven by competitive market conditions. Sales and marketing teams rely on data for planning. Data discovery improves lead analysis and revenue insights. Visualization supports reporting needs. This keeps adoption strong in this function.
By Vertical
The BFSI sector accounts for 23.9%, highlighting its significant use of data discovery tools. Financial institutions manage large volumes of transactional and customer data. Data discovery supports risk assessment and customer insights. Accuracy and compliance are important considerations. Data visibility improves operational control.
Adoption in BFSI is driven by regulatory and analytical needs. Institutions require tools to analyze complex datasets. Data discovery improves transparency and reporting. Secure access supports sensitive data handling. This sustains steady adoption in the BFSI sector.
By Region
North America accounts for 38.9%, supported by strong enterprise analytics adoption. Organizations in the region invest heavily in data platforms. Advanced digital infrastructure supports cloud-based tools. Data-driven decision-making is widely practiced. The region remains a major contributor.
Regional Driver Comparison
| Region | Primary Growth Driver | Regional Share (%) | Regional Value (USD Bn) | Adoption Maturity |
|---|---|---|---|---|
| North America | Advanced analytics adoption | 37.8% | USD 5.93 Bn | Advanced |
| Europe | Data governance and compliance focus | 28.4% | USD 4.45 Bn | Advanced |
| Asia Pacific | Rapid enterprise digitization | 25.1% | USD 3.93 Bn | Developing to Advanced |
| Latin America | Business intelligence modernization | 5.2% | USD 0.82 Bn | Developing |
| Middle East and Africa | Early stage data platforms | 3.5% | USD 0.55 Bn | Early |
The United States reached USD 5.56 Billion with a CAGR of 13.5%, reflecting steady market growth. Expansion is driven by enterprise analytics demand. Businesses prioritize data visibility and insights. Investment in cloud analytics continues. Market momentum remains positive.
Investor Type Impact Matrix
| Investor Type | Adoption Level | Contribution to Market Growth (%) | Key Motivation | Investment Behavior |
|---|---|---|---|---|
| Large enterprises | Very High | ~41.6% | Faster insights and decision making | Platform wide deployment |
| Cloud service providers | High | ~24% | Value added analytics services | Infrastructure linked |
| Mid sized enterprises | Moderate | ~18% | Competitive intelligence | Phased rollout |
| Data platform vendors | Moderate | ~11% | Ecosystem expansion | Product investment |
| Startups | Low to Moderate | ~5% | Agile analytics needs | Selective adoption |
Technology Enablement Analysis
| Technology Layer | Enablement Role | Impact on Market Growth (%) | Adoption Status |
|---|---|---|---|
| Metadata management | Data cataloging and indexing | ~4.1% | Growing |
| AI and machine learning | Pattern detection and recommendations | ~3.6% | Growing |
| Natural language query | Business user accessibility | ~3.0% | Developing |
| Cloud data platforms | Scalable discovery environments | ~2.7% | Mature |
| Visualization engines | Interactive data exploration | ~2.1% | Mature |
Emerging Trends
In the data discovery market, one clear trend is the wider use of assisted analytics features that help users identify patterns and relationships within data. These tools guide users through exploration steps and highlight meaningful connections without requiring advanced technical skills. This approach supports faster insight generation across business teams.
Another trend is the growing emphasis on self service data access. Organisations are enabling employees from finance, marketing, operations, and other functions to explore data independently. This reduces dependency on technical teams and allows decisions to be made closer to the business context.
Growth Factors
A major growth factor in the data discovery market is the continuous increase in data generated from digital operations. Transaction systems, online platforms, and connected devices produce large volumes of data that require effective exploration tools. Data discovery solutions help organisations turn this data into usable insights.
Another factor supporting growth is the demand for faster decision making. Businesses operate in environments where timely insights are critical. Data discovery tools allow users to interact with data visually and iteratively, which shortens the time needed to reach conclusions.
Opportunity
A strong opportunity exists in improving contextual guidance within data discovery tools. Features that explain trends, compare results, or highlight potential causes can help users interpret findings more clearly. This guidance increases confidence in decision making.
Another opportunity lies in strengthening access control and governance features. As more users explore sensitive data, clear permission management and audit tracking become essential. Enhanced governance can support broader adoption in regulated environments.
Challenge
One challenge for the data discovery market is balancing simplicity with analytical capability. Tools must be easy to use while still supporting deeper analysis when needed. Achieving this balance is important for adoption across different user groups.
Another challenge involves encouraging consistent use across departments. Different teams may rely on separate tools or definitions. Aligning discovery practices and shared data standards requires organisational coordination and change management.
Key Market Segments
By Component
- Solutions
- Services
- Professional Services
- Managed Services
By Deployment Mode
- On-Premises
- Cloud-based
By Organization Size
- Large Enterprises
- Small & Medium Enterprises
By Functionality
- Visual Data Discovery
- Augmented Data Discovery
- Search-based Data Discovery
- Self-Service Data Discovery
By Application
- Security & Risk Management
- Sales & Marketing Management
- Asset Management
- Supply Chain Management
- Others
By Vertical
- BFSI
- Government
- Healthcare & Life Sciences
- Retail
- Manufacturing
- Media & Entertainment
- IT & Telecom
- Others
Regional Analysis and Coverage
- North America
- US
- Canada
- Europe
- Germany
- France
- The UK
- Spain
- Italy
- Russia
- Netherlands
- Rest of Europe
- Asia Pacific
- China
- Japan
- South Korea
- India
- Australia
- Singapore
- Thailand
- Vietnam
- Rest of Latin America
- Latin America
- Brazil
- Mexico
- Rest of Latin America
- Middle East & Africa
- South Africa
- Saudi Arabia
- UAE
- Rest of MEA
Competitive Analysis
Microsoft Corporation, SAP SE, IBM Corporation, and Oracle Corporation lead the data discovery market by offering enterprise grade analytics, metadata management, and integrated data platforms. Their solutions help organizations identify, classify, and understand data across complex IT environments. These companies focus on scalability, governance, and security. Rising enterprise data volumes continue to reinforce their leadership.
Tableau Software LLC, QlikTech International AB, Google LLC, Amazon Web Services Inc., and MicroStrategy Inc. strengthen the market with self service data discovery and visualization tools. Their platforms enable business users to explore data, uncover patterns, and generate insights without heavy IT involvement. These providers emphasize usability, real time analytics, and cloud deployment. Growing demand for faster decision making supports wider adoption.
Alteryx Inc., Informatica Inc., Collibra NV, Alation Inc., and Snowflake Inc. expand the landscape with advanced data cataloging, preparation, and governance focused discovery solutions. Their offerings support data quality, lineage, and compliance needs. These companies focus on automation and interoperability. Increasing focus on data driven operations continues to drive steady growth in the data discovery market.
Top Key Players in the Market
- Microsoft Corp.
- Tableau Software LLC (Salesforce)
- SAP SE
- QlikTech International AB
- IBM Corp.
- Oracle Corp.
- Amazon Web Services Inc.
- Google LLC (Looker)
- Altair Engineering Inc.
- SAS Institute Inc.
- MicroStrategy Inc.
- Alteryx Inc.
- Datameer Inc.
- Cloudera Inc.
- Talend SA
- Informatica Inc.
- Collibra NV
- Alation Inc.
- Snowflake Inc.
- Tibco Software Inc.
- Others
Recent Developments
- In November 2025, Tableau rolled out new features like MCP Server support and Tableau Semantics for Data Lake Objects, making it simpler to build semantic models directly on files for faster data discovery and analysis. These moves show Tableau pushing hard to blend AI with everyday data work.
- SAP SE launched Business Data Cloud in May 2025, partnering with Databricks to unify structured and unstructured data for better AI agents like Joule in areas such as finance and supply chain.
- QlikTech introduced the Qlik Analytics Migration Tool in June 2025, easing shifts to Qlik Cloud while adding knowledge mart tasks in Talend Cloud for semantic search and RAG AI apps. In October 2025, Qlik Cloud enhanced data products with OData APIs and GenAI field descriptions, plus semantic search for quicker dataset discovery.
Report Scope
| Report Features | Description |
|---|---|
| Market Value (2025) | USD 15.6 Bn |
| Forecast Revenue (2035) | USD 68.8 Bn |
| CAGR(2026-2035) | 16.0% |
| Base Year for Estimation | 2025 |
| Historic Period | 2020-2024 |
| Forecast Period | 2026-2035 |
| Report Coverage | Revenue forecast, AI impact on Market trends, Share Insights, Company ranking, competitive landscape, Recent Developments, Market Dynamics and Emerging Trends |
| Segments Covered | By Component (Solutions, Services), By Deployment Mode (On-Premises, Cloud-based), By Organization Size (Large Enterprises, Small & Medium Enterprises), By Functionality (Visual Data Discovery, Augmented Data Discovery, Search-based Data Discovery, Self-Service Data Discovery), By Application (Security & Risk Management, Sales & Marketing Management, Asset Management, Supply Chain Management, Others), By Vertical (BFSI, Government, Healthcare & Life Sciences, Retail, Manufacturing, Media & Entertainment, IT & Telecom, Others) |
| Regional Analysis | North America – US, Canada; Europe – Germany, France, The UK, Spain, Italy, Russia, Netherlands, Rest of Europe; Asia Pacific – China, Japan, South Korea, India, New Zealand, Singapore, Thailand, Vietnam, Rest of Latin America; Latin America – Brazil, Mexico, Rest of Latin America; Middle East & Africa – South Africa, Saudi Arabia, UAE, Rest of MEA |
| Competitive Landscape | Microsoft Corp., Tableau Software LLC (Salesforce), SAP SE, QlikTech International AB, IBM Corp., Oracle Corp., Amazon Web Services Inc., Google LLC (Looker), Altair Engineering Inc., SAS Institute Inc., MicroStrategy Inc., Alteryx Inc., Datameer Inc., Cloudera Inc., Talend SA, Informatica Inc., Collibra NV, Alation Inc., Snowflake Inc., Tibco Software Inc., Others |
| Customization Scope | Customization for segments, region/country-level will be provided. Moreover, additional customization can be done based on the requirements. |
| Purchase Options | We have three license to opt for: Single User License, Multi-User License (Up to 5 Users), Corporate Use License (Unlimited User and Printable PDF) |


