
Global Carbon Credit Market Size, Share and Report Analysis By Type (Compliance Market, Voluntary Market), By Project Type (Avoidance Projects, Removal Projects, Renewable Energy, Community Projects, Waste to Energy project, Energy Efficiency, Others), By End-use (Energy, Aviation, Transportation, Agricultural, Waste Management, Others) , By Region and Companies - Industry Segment Outlook, Market Assessment, Competition Scenario, Trends and Forecast 2025-2034
- Published date: Feb 2026
- Report ID: 176364
- Number of Pages: 303
- Format:
-
keyboard_arrow_up
Quick Navigation
Report Overview
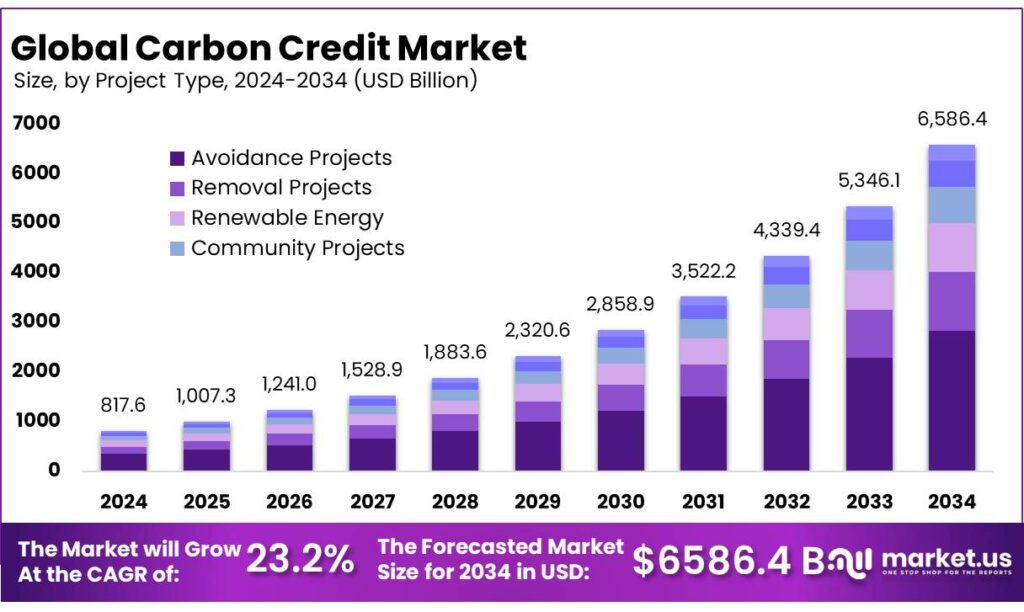
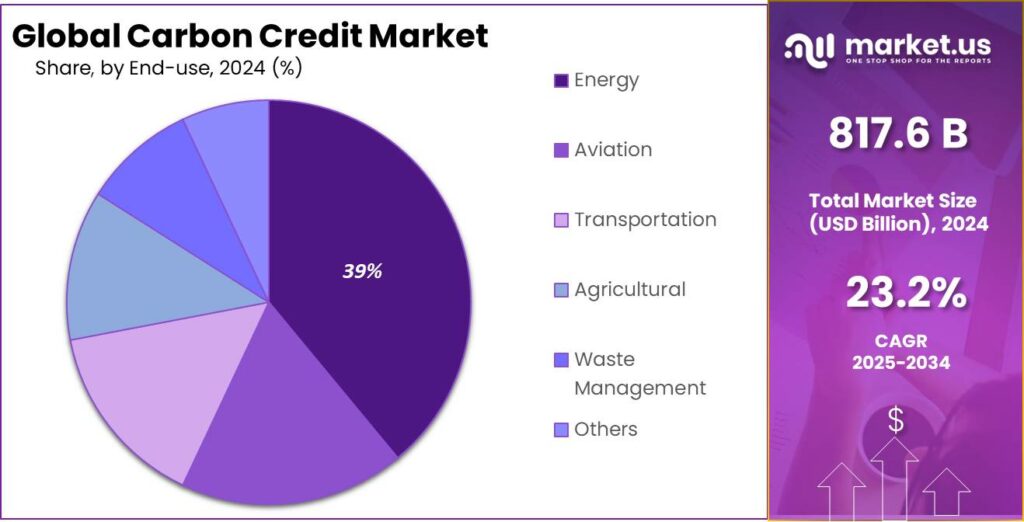
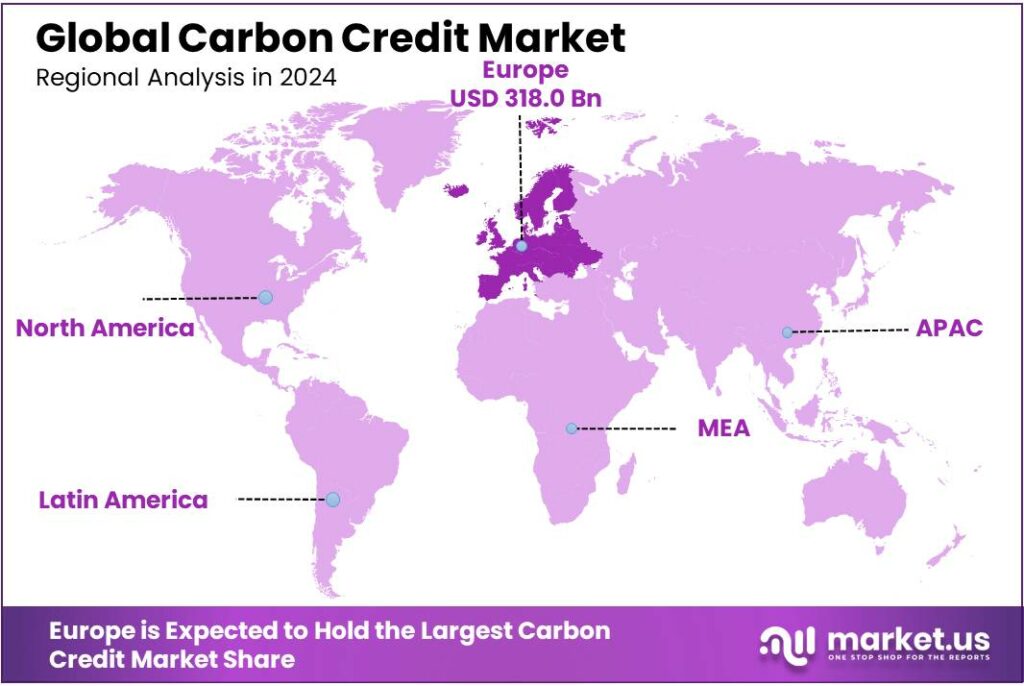
Global Carbon Credit Market size is expected to be worth around USD 6586.4 Billion by 2034, from USD 817.6 Billion in 2024, growing at a CAGR of 23.2% during the forecast period from 2025 to 2034. In 2024 Europe held a dominant market position, capturing more than a 38.9% share, holding USD 318.0 Bn in revenue.
Carbon credits are tradable instruments that represent verified reductions or removals of greenhouse gases, typically measured as 1 tonne of CO₂-equivalent per credit. They sit at the intersection of climate policy, corporate net-zero strategy, and project finance, helping channel capital into activities such as clean energy, methane reduction, nature-based sequestration, and engineered carbon removal. In practice, credits are used in two main arenas: compliance markets and voluntary markets.
- In 2023, global carbon pricing revenues hit a record USD 104 billion, with 75 carbon pricing instruments operating worldwide—showing how quickly governments are scaling price signals that make emission reductions financially material.
Alongside this, carbon pricing coverage has continued to widen; the World Bank notes carbon pricing now covers around 28% of global emissions and that the pool of unretired carbon credits approached ~1 billion tons in 2024, underscoring both growing supply and the need for stronger demand and quality filters. On the voluntary side, market value has been more cyclical: the total reported transaction value was USD 723 million in 2023, reflecting a pullback in activity as buyers waited for clearer integrity guidance.
Key demand drivers are regulatory tightening, expanding sector coverage, and investor pressure for credible decarbonization. For example, the EU ETS regulates roughly 45% of the EU’s greenhouse-gas output, and ETS-covered emissions fell by 5% in 2024, reinforcing that allowance demand is directly tied to compliance trajectories and sector activity.
Food and agrifood dynamics are becoming a distinct growth engine because the sector is emissions-intensive and has large, scalable mitigation options. Estimates global agrifood systems emissions at 16.5 billion tonnes CO₂e in 2023, representing 32% of total emissions, with 8.1 billion tonnes CO₂e occurring at the farm gate—exactly where carbon projects like soil-carbon, rice methane reduction, manure management, and agroforestry can generate credits or “insets.”
Corporate ambition in food is also increasingly quantified: PepsiCo reports 3.3 million metric tons of Scope 1 GHG emissions in 2024, illustrating why many food companies blend operational cuts with supply-chain programs that can later underpin credit generation.
Key Takeaways
- Carbon Credit Market size is expected to be worth around USD 6586.4 Billion by 2034, from USD 817.6 Billion in 2024, growing at a CAGR of 23.2%.
- Compliance Market held a dominant market position, capturing more than a 78.5% share.
- Avoidance Projects held a dominant market position, capturing more than a 43.6% share.
- Energy held a dominant market position, capturing more than a 39.7% share.
- Europe dominates the Carbon Credit Market with 38.9% share, valued at 318.0 Bn.
By Type Analysis
Compliance Market dominates with 78.5% share due to strict emission-control rules.
In 2024, Compliance Market held a dominant market position, capturing more than a 78.5% share, reflecting how government-mandated emission rules continue to drive the strongest demand for regulated carbon units. Compliance carbon markets operate under legally binding caps that require industries such as power generation, cement, metals, aviation, and large manufacturing facilities to surrender eligible credits each year.
These obligations are enforced through penalties and annual reporting, companies actively purchase allowances to maintain compliance, which naturally pushes demand higher than in voluntary markets. During 2024, several regions strengthened their carbon-pricing rules, raising the need for more allowances and reinforcing compliance markets as the backbone of global carbon trading.
By Project Type Analysis
Avoidance Projects lead the market with a strong 43.6% share in 2024.
In 2024, Avoidance Projects held a dominant market position, capturing more than a 43.6% share, highlighting their continued importance in carbon credit generation. These projects focus on preventing emissions before they occur, often through efforts such as protecting forests, improving cookstoves, reducing methane leakage, and enhancing energy efficiency in industrial or community settings.
They stop emissions at the source, avoidance projects remain cost-effective and easier to scale, making them a preferred choice for many organizations looking to compensate for unavoidable emissions. Their appeal also grows from the fact that they provide immediate climate benefits without requiring large-scale technological deployment.
By End-use Analysis
Energy sector leads the market with a solid 39.7% share in 2024.
In 2024, Energy held a dominant market position, capturing more than a 39.7% share, underscoring how this sector remains the largest contributor to carbon-credit demand. Power generation companies, utilities, and industrial energy users continue to rely on carbon credits to balance unavoidable emissions while gradually transitioning toward cleaner technologies.
Energy production is still dependent on fossil fuels in many regions, credits offer an immediate way to meet regulatory and corporate emission targets without disrupting supply. This strong demand kept the energy segment firmly at the top, as companies sought reliable pathways to offset operational emissions while investing in renewable capacity and efficiency upgrades.
Key Market Segments
By Type
- Compliance Market
- Voluntary Market
By Project Type
- Avoidance Projects
- Removal Projects
- Renewable Energy
- Community Projects
- Waste to Energy project
- Energy Efficiency
- Others
By End-use
- Energy
- Aviation
- Transportation
- Agricultural
- Waste Management
- Others
Emerging Trends
Integrity-led buying is the latest trend shaping carbon credits in food supply chains
A major latest trend in the carbon credit market is the shift from “cheap volume” to high-integrity credits that can stand up to tougher scrutiny—especially for food and agriculture, where supply-chain emissions are large but hard to measure. Buyers in 2024–2025 increasingly want credits backed by stronger monitoring, clearer baselines, and transparent claims. This is happening because boards, auditors, and regulators are asking simple questions: Did the project really cut emissions, and can that result be verified over time? When the answer is uncertain, buyers delay purchases or move toward credits with stricter quality screens.
This quality-first trend is tightly linked to the food system’s climate footprint. The Food and Agriculture Organization (FAO) reports that agrifood systems emitted 16.5 billion tonnes CO₂e in 2023, representing 32% of total global emissions. Within that total, 8.1 billion tonnes CO₂e came from farm-gate crop and livestock activities—where carbon projects such as improved fertilizer use, rice methane reduction, manure management, and agroforestry are typically developed. The sheer size of these numbers keeps food companies interested in credits, but it also raises expectations: if agrifood credits are going to play a meaningful role, they must be trusted, consistent, and measurable across many farms and regions.
In response, standard setters and integrity bodies have been tightening what qualifies as a “good” credit. In 2025, the Integrity Council for the Voluntary Carbon Market (ICVCM) moved forward on approvals that expand the menu of higher-integrity options, including approvals for six carbon dioxide removal methodologies (engineered removals) and two forest-related protocols, which supports buyers building more robust portfolios.
Another visible piece of this trend is stronger methodology design in projects that touch households and food-related communities, such as clean cooking. In March 2025, Reuters reported that ICVCM approved three new clean cookstove methods (plus a household biodigester method), with tighter requirements intended to avoid over-crediting and improve monitoring. Reuters also noted the voluntary carbon market value was about $723 million in 2023, giving context for why credibility upgrades are seen as essential to market resilience.
Drivers
Rising Agrifood Emissions Push Strong Demand for Carbon Credits
One of the most influential driving factors for the Carbon Credit market today is the rapid rise of emissions from the global agrifood sector and the parallel pressure on companies and governments to curb this growth through credible mitigation pathways. The agrifood industry—spanning farming, livestock, food processing, and global supply chains—has become a central focus of climate policy because its emissions continue to expand at a pace that outstrips reductions in many industrial sectors.
- According to the Food and Agriculture Organization (FAO), global agrifood systems generated 16.5 billion tonnes of CO₂e in 2023, accounting for 32% of total global emissions—a scale that places the sector close to energy-related emissions in its climate impact. The FAO further highlights that 8.1 billion tonnes CO₂e arise directly at the farm gate, meaning emissions tied to livestock, crop production, soil management, and agricultural energy use. These emissions remain difficult to abate without substantial changes in technology and farming practices.
This heavy climate footprint has pushed governments to launch strong mitigation initiatives linked directly to agriculture. For example, the United States Department of Agriculture (USDA) launched large-scale climate-smart programs supporting farmers to adopt practices that reduce emissions and improve soil carbon. In 2022–2024, the USDA committed USD 3.1 billion toward climate-smart agriculture partnerships, enabling millions of acres of farmland to participate in emissions-reducing projects, many of which qualify for carbon-credit generation under established methodologies.
This trend is visible in corporate sustainability disclosures. PepsiCo, for example, reported 3.3 million metric tons of Scope 1 greenhouse-gas emissions in 2024, while noting ongoing reductions through regenerative agriculture and low-carbon farming partnerships. Though these programs focus on internal improvements, companies of this scale also examine high-quality carbon credits to balance portions of their footprints that cannot be eliminated quickly.
Restraints
Data Gaps and Verification Challenges Limit Carbon Credit Confidence
One of the major restraining factors for the Carbon Credit market is the persistent challenge of verifying real, measurable, and long-term emission reductions—particularly within agriculture and food systems where data collection remains fragmented and often unreliable. Although agriculture offers some of the largest decarbonization opportunities, it also presents some of the most complex measurement problems. These verification gaps reduce market confidence, delay credit issuance, and create hesitation among corporate buyers who increasingly demand high-integrity climate actions.
Agriculture is central to this challenge because its emissions are dispersed across millions of farms, influenced by soil type, rainfall, crop cycles, livestock conditions, and farming practices that change regularly. The Food and Agriculture Organization (FAO) reports that global agrifood systems emitted 16.5 billion tonnes of CO₂e in 2023, representing 32% of global greenhouse gases. Yet these emissions are often estimated through broad models rather than direct measurement, which makes it harder to verify reductions with high precision.
The FAO notes that 8.1 billion tonnes CO₂e come directly from farm-level activities. These emissions fluctuate significantly with weather conditions, soil quality, input use, and crop yields. Because of this variability, proving exactly how much carbon a specific project has reduced or stored can be difficult without long-term monitoring systems. This uncertainty makes some buyers wary of purchasing agricultural credits, fearing the risk of over-crediting or temporary carbon storage.
Government programs also highlight the difficulty. The United States Department of Agriculture (USDA), through its Climate-Smart Commodities initiative, committed USD 3.1 billion to improve climate reporting and monitoring across U.S. farms. A major portion of this funding specifically targets better measurement tools because existing farm-level emissions data is insufficient for precise carbon-credit quantification.
Opportunity
Scaling agrifood insetting credits is a major growth opportunity
A major growth opportunity for the carbon credit market is the rapid expansion of agrifood “insetting”—credits generated inside a food company’s own supply chain and then used to meet internal climate targets. The logic is simple: most food brands cannot decarbonize fast enough using only factory efficiency or renewable electricity, because the biggest emissions sit upstream on farms and in land use. That gap is turning carbon credits—especially high-integrity agriculture and nature-based units—into a practical financing tool that can pay growers to change practices, reduce methane, and improve soil carbon while brands lock in traceable climate outcomes.
The scale of the agrifood emissions base makes this opportunity unusually large. The Food and Agriculture Organization of the United Nations reports global agrifood systems emissions of 16.5 billion tonnes CO₂e in 2023, equal to 32% of total global emissions. It also highlights that 8.1 billion tonnes CO₂e come from “farm-gate” crop and livestock activities—exactly where scalable credit projects can be built (fertilizer optimization, rice methane reduction, manure management, agroforestry, and soil practices).
Corporate disclosures show why agrifood-linked credits are becoming a bigger buying focus in 2024–2025. PepsiCo states that in 2024 its in-scope Scope 3 emissions were 26 million metric tons and 12 million metric tons CO₂e (FLAG), reflecting how large upstream agriculture and land-related footprints can be for a branded food company. Nestlé reports gross Scope 3 emissions of 71.35 million tonnes CO₂e in its 2024 non-financial reporting, again pointing to the same pattern: Scope 3 dominates, and farm-linked solutions are where meaningful cuts must happen.
Government initiatives are also building the pipeline of investable farm projects, which supports future credit supply. The United States Department of Agriculture states it is investing more than $3.1 billion across 141 projects under Partnerships for Climate-Smart Commodities—programs designed to expand market opportunities for climate-smart production and improve measurement and reporting. Even when policy design evolves, the direction of travel is clear: better farm-level data, better MRV tools, and stronger buyer requirements make it easier to produce credits that large food companies will actually purchase at scale.
Regional Insights
Europe dominates the Carbon Credit Market with 38.9% share, valued at 318.0 Bn
Europe leads carbon-credit activity largely because regulation turns carbon into a routine cost of doing business, not a discretionary purchase. The region’s backbone is the European Union Emissions Trading System, launched in 2005 and described by the European Commission as one of the world’s largest carbon markets, covering emissions from electricity and heat generation, industrial manufacturing, and aviation—together roughly 40% of total EU greenhouse-gas emissions.
This structural coverage keeps demand resilient even when voluntary buying slows, because regulated installations must surrender allowances annually to stay compliant. In 2024, Europe reinforced this leadership by expanding ETS coverage to maritime transport, bringing shipping into the compliance ecosystem and widening the buyer base; the Commission also sets out a phased surrender approach for shipping obligations, which supports gradual but sticky demand during 2024–2025.
Key Regions and Countries Insights
- North America
- US
- Canada
- Europe
- Germany
- France
- The UK
- Spain
- Italy
- Rest of Europe
- Asia Pacific
- China
- Japan
- South Korea
- India
- Australia
- Rest of APAC
- Latin America
- Brazil
- Mexico
- Rest of Latin America
- Middle East & Africa
- GCC
- South Africa
- Rest of MEA
Key Players Analysis
EKI Energy Services has supplied more than 200+ million carbon credits and operates in 16+ countries. The company manages carbon asset development across renewable energy, energy efficiency, and nature-based solutions. With over 250 experts, EKI supports voluntary and compliance market participation for industries transitioning toward net-zero goals.
CarbonBetter supports corporate decarbonization across 40+ sustainability programs, helping reduce or manage multiple million tonnes of CO₂e annually across client operations. The firm combines carbon accounting, clean energy procurement, and project development. Its climate portfolio includes nature-based projects and energy-transition initiatives backed by verifiable environmental performance metrics.
NativeEnergy has enabled over 80+ high-impact climate projects, helping organizations reduce or offset more than 60 million tCO₂e. The company specializes in regenerative agriculture, clean water, and renewable energy projects. Its long-running “Help Build™” model finances community-first climate solutions across 20+ states and several international regions.
Top Key Players Outlook
- South Pole Group
- 3Degrees
- EKI Energy Services Ltd.
- NativeEnergy
- CarbonBetter
- Carbon Care Asia Limited
- Terrapass
- Carbon Credit Capital
- Climate Trade
- ForestCarbon
- Climate Impact Partners
- Carbonfund
- Climeco LLC
Recent Industry Developments
South Pole Group is a Switzerland-based leader in carbon credits and climate solutions, helping organisations decarbonise through project development, advisory services, and environmental certificates. By 2024, it had mobilised finance for over 850+ climate action projects across 50+ countries, which together reduced or removed more than 220 million metric tonnes of CO₂e to date, showing real impact in forestry, renewables, and agriculture.
EKI Energy Services Ltd. is a leading Indian carbon credit developer and supplier that has grown into a global player in climate change solutions. Founded in 2008 and listed on the Bombay Stock Exchange, the company works in 16+ countries and serves more than 3,500 clients in over 40 countries worldwide, supplying over 200+ million carbon offsets through project development, generation, and trading.
Report Scope
Report Features Description Market Value (2024) USD 817.6 Bn Forecast Revenue (2034) USD 6586.4 Bn CAGR (2025-2034) 23.2% Base Year for Estimation 2024 Historic Period 2020-2023 Forecast Period 2025-2034 Report Coverage Revenue Forecast, Market Dynamics, Competitive Landscape, Recent Developments Segments Covered By Type (Compliance Market, Voluntary Market), By Project Type (Avoidance Projects, Removal Projects, Renewable Energy, Community Projects, Waste to Energy project, Energy Efficiency, Others), By End-use (Energy, Aviation, Transportation, Agricultural, Waste Management, Others) Regional Analysis North America – US, Canada; Europe – Germany, France, The UK, Spain, Italy, Rest of Europe; Asia Pacific – China, Japan, South Korea, India, Australia, Singapore, Rest of APAC; Latin America – Brazil, Mexico, Rest of Latin America; Middle East & Africa – GCC, South Africa, Rest of MEA Competitive Landscape South Pole Group, 3Degrees, EKI Energy Services Ltd., NativeEnergy, CarbonBetter, Carbon Care Asia Limited, Terrapass, Carbon Credit Capital, Climate Trade, ForestCarbon, Climate Impact Partners, Carbonfund, Climeco LLC Customization Scope Customization for segments, region/country-level will be provided. Moreover, additional customization can be done based on the requirements. Purchase Options We have three licenses to opt for: Single User License, Multi-User License (Up to 5 Users), Corporate Use License (Unlimited User and Printable PDF) 
-
-
- South Pole Group
- 3Degrees
- EKI Energy Services Ltd.
- NativeEnergy
- CarbonBetter
- Carbon Care Asia Limited
- Terrapass
- Carbon Credit Capital
- Climate Trade
- ForestCarbon
- Climate Impact Partners
- Carbonfund
- Climeco LLC
Our Clients
- 176364
- Feb 2026


