
Quick Navigation
Report Overview
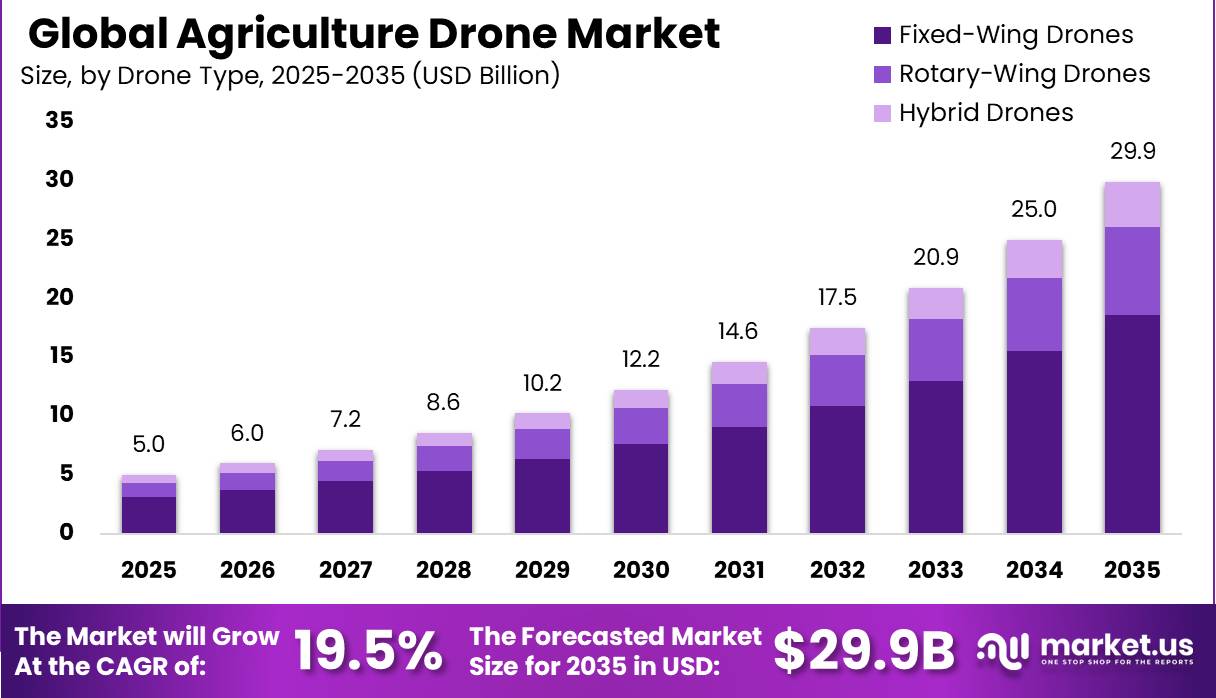
Global Agriculture Drone Market size is expected to be worth around USD 29.9 Billion by 2035 from USD 5.0 Billion in 2025, growing at a CAGR of 19.5% during the forecast period 2026 to 2035. This trajectory reflects commercial-scale adoption across crop spraying, precision farming, and aerial monitoring operations worldwide.
The agriculture drone market covers unmanned aerial vehicles designed for field-level agricultural applications. These systems span fixed-wing, rotary-wing, and hybrid drone types, supported by hardware components such as cameras, sensors, airframes, batteries, and propulsion systems, as well as software and services including cloud-based analytics and drone-as-a-service platforms.
Key Takeaways
- Market size in 2025: USD 5.0 Billion
- Market size forecast for 2035: USD 29.9 Billion
- CAGR (2026 to 2035): 19.5%
- Dominant component segment: Hardware with 69.8% share
- Dominant drone type: Fixed-Wing Drones with 62.4% share
- Dominant payload segment: Lightweight (less than 10 kg) with 44.3% share
- Dominant application: Precision Farming/Crop Management with 38.6% share
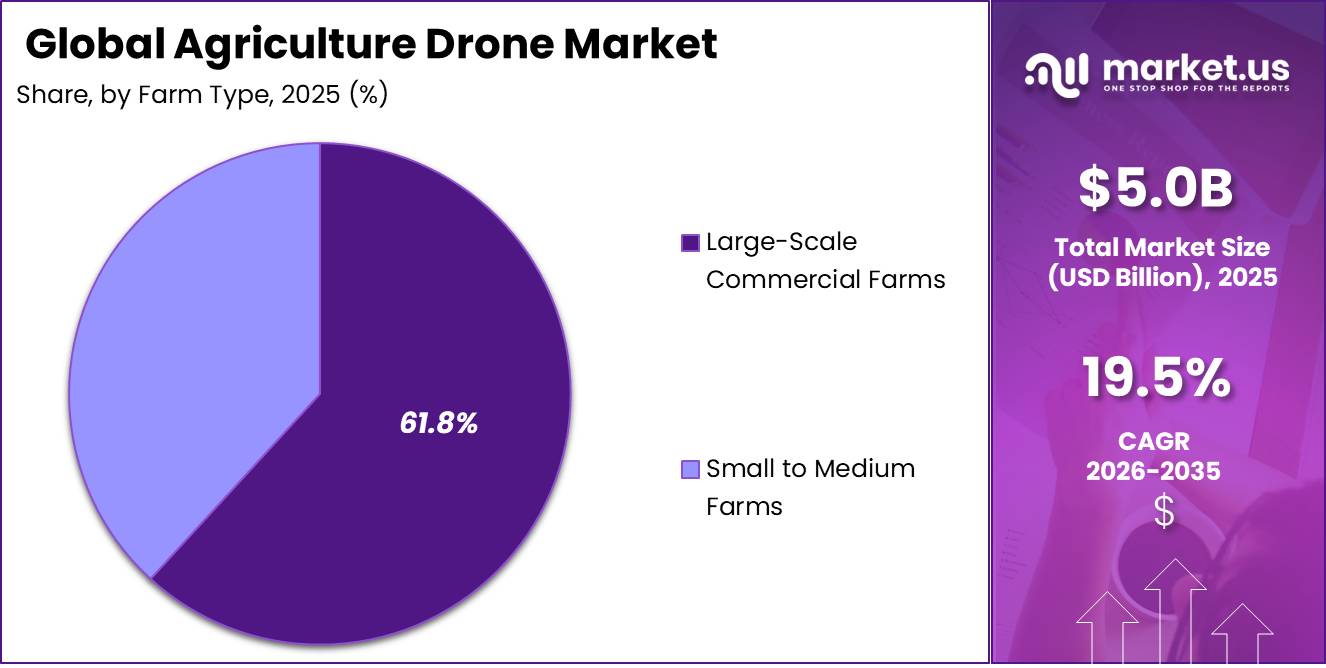
- Dominant farm size segment: Large-Scale Commercial Farms with 61.8% share
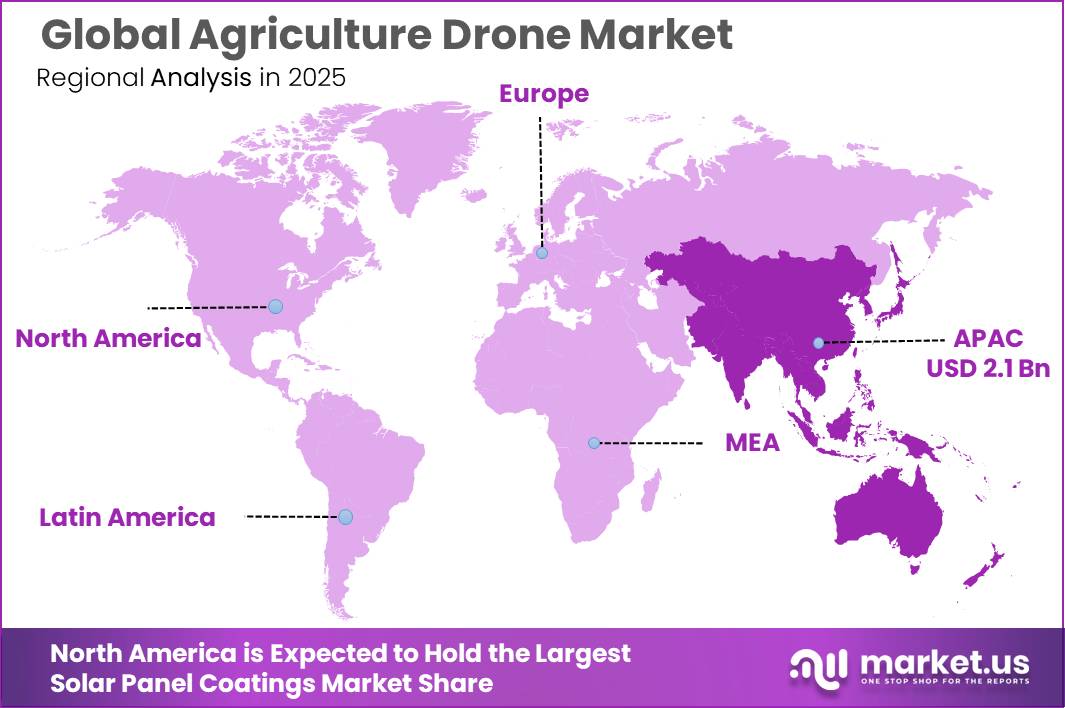
- Dominant region: Asia Pacific with 42.3% share, valued at USD 2.1 Billion in 2025
Asia Pacific commands 42.3% of the global market, with the region’s farm-density, government subsidy frameworks, and high-volume rice and cereal cultivation driving disproportionate fleet deployments. India’s state-linked distribution programs and China’s large-scale commercial operations both reinforce this regional lead. This concentration creates supplier advantage for brands with established APAC distribution infrastructure.
According to DJI’s agricultural annual report, approximately 400,000 active agricultural drones operated globally by end of 2024, a 90% increase from 2020 levels, covering operations across more than 100 countries and over 300 crop types. This rate of expansion confirms that commercial acceptance has moved beyond pilot programs. Investors can now evaluate real deployment yield and fleet utilization data rather than forecasts alone.
Data from DJI’s media center shows that agricultural drone deployment has saved approximately 222 million tons of water and reduced carbon emissions by approximately 30.87 million tons globally by 2025. These sustainability metrics matter commercially because they give operators measurable environmental credentials that support ESG mandates from agribusiness buyers and institutional investors. This shifts drone adoption from productivity argument to compliance advantage.
Components Analysis
Hardware dominates with 69.8% due to high unit volume and diverse component demand.
In 2025, Hardware held a dominant market position in the By Components segment of the Agriculture Drone Market, with a 69.8% share. Cameras and sensors account for 22.4% of the components segment, reflecting the centrality of imaging and data capture in field-level drone operations. High sensor demand means that component vendors supplying multispectral and thermal imaging modules hold strong recurring revenue positions as fleets scale.
Airframes contribute 18.6% of the components segment, representing the structural foundation for all drone platform categories. Airframe demand tracks fleet expansion directly, meaning any acceleration in drone purchases creates proportional aftermarket demand for replacements and upgrades. Batteries follow at 12.3%, and propulsion systems at 10.8%, forming the operational core of every deployed unit.
Navigating Gear accounts for 5.7% of the components segment. This relatively lower share reflects that navigation systems are typically integrated rather than replaced as standalone components. However, the shift toward RTK guidance and autonomous flight modes is pushing navigation hardware up the specification ladder, which signals future average selling price expansion within this sub-segment.
Software and Services holds a 30.2% share in the By Components segment. Drone-as-a-Service models represent 18.6% of this group, while cloud-based analytics accounts for the remaining 11.6%. The software layer generates recurring revenue absent from hardware sales, making it strategically valuable for vendors seeking to stabilize margins against hardware commoditization pressure.
Drone Type Analysis
Fixed-Wing Drones dominate with 62.4% due to superior coverage range and endurance.
In 2025, Fixed-Wing Drones held a dominant market position in the By Drone Type segment of the Agriculture Drone Market, with a 62.4% share. Their aerodynamic efficiency allows longer flight durations over large contiguous farmland without frequent battery changes. This operational profile makes them the preferred platform for broad-area mapping, crop scouting, and variable-rate application planning on large commercial holdings.
Rotary-Wing Drones hold a 24.8% share of the drone type segment. Their ability to hover, maneuver in confined spaces, and carry heavier spray payloads makes them commercially dominant for precision crop spraying applications, particularly in orchards, vineyards, and terraced fields. As AI-enabled variable-rate spraying capabilities expand on rotary-wing platforms, this sub-segment is positioned to capture a growing share of high-value crop protection spend.
Hybrid Drones account for 12.8% of the drone type segment. These platforms combine fixed-wing endurance with rotary-wing vertical take-off capability, reducing the infrastructure dependency that limits fixed-wing deployment in field-edge environments. Their higher unit cost currently constrains volume, but their operational versatility positions them as a premium tier that will attract large commercial operators as price-per-hour economics improve.
Payload Capacity Analysis
Lightweight drones dominate with 44.3% due to lower cost and regulatory accessibility.
In 2025, Lightweight (less than 10 kg) drones held a dominant market position in the By Payload Capacity segment of the Agriculture Drone Market, with a 44.3% share. Their lower acquisition cost and simplified certification pathways make them the accessible entry point for small operators, service providers, and subsidy-funded smallholder programs. This cost-accessibility combination sustains volume demand at the base of the market.
Medium-Weight (10 to 25 kg) and Heavy-Weight (greater than 25 kg) platforms collectively hold the remaining share of the payload segment. Heavy platforms capable of carrying 40 kg spray loads or 50 kg spreading payloads are displacing multi-flight lightweight operations on large commercial farms, which compresses lightweight unit economics at the high-throughput end of the market.
Application Analysis
Precision Farming/Crop Management dominates with 38.6% due to broad applicability and data integration.
In 2025, Precision Farming/Crop Management held a dominant market position in the By Application segment of the Agriculture Drone Market, with a 38.6% share. Multispectral imaging, soil variability mapping, and yield forecasting applications drive this segment by converting drone flight time into agronomic decision inputs. Vendors that integrate drone data output with farm management software platforms hold a stickiness advantage over pure hardware competitors.
Crop Spraying and Livestock and Soil Analysis collectively hold the remaining application segment share. Crop Spraying is the most operationally intensive application and generates recurring chemical-application revenue for service operators, but regulatory permit barriers in the EU and parts of North America constrain its commercial ceiling in those geographies. Livestock and Soil Analysis remains an early-stage commercial application in most markets outside of the most advanced precision farming economies.
Farm Size Analysis
Large-Scale Commercial Farms dominate with 61.8% due to capital availability and scale economics.
In 2025, Large-Scale Commercial Farms held a dominant market position in the By Farm Size segment of the Agriculture Drone Market, with a 61.8% share. Large operators justify the capital expenditure required for multi-drone fleets by spreading fixed costs across extensive acreage, producing per-hectare economics that are clearly favorable against manual alternatives. This scale advantage concentrates drone adoption among the buyers with the highest return certainty.
Small to Medium Farms hold the remaining farm size segment share. Their inability to justify direct drone ownership is the structural gap that Drone-as-a-Service models are designed to address. As DaaS infrastructure expands through custom hiring centers and rural service networks, this segment represents the largest untapped addressable market for fleet operators and platform providers targeting volume-over-margin growth strategies.
Key Market Segments
By Components
- Hardware
- Cameras and Sensors
- Airframes
- Batteries
- Propulsion Systems
- Navigating Gear
- Software and Services
- Drone-as-a-Service (DaaS) models
- Cloud-Based Analytics
By Drone Type
- Fixed-Wing Drones
- Rotary-Wing Drones
- Hybrid Drones
By Payload Capacity
- Lightweight (less than 10 kg)
- Medium-Weight (10 to 25 kg)
- Heavy-Weight (greater than 25 kg)
By Application
- Precision Farming/Crop Management
- Crop Spraying
- Livestock and Soil Analysis
By Farm Size
- Large-Scale Commercial Farms
- Small to Medium Farms
Market Dynamics
Market Opportunity Analysis - DaaS, smallholder access, and high-value crop segments offer the clearest near-term entry points
The Small to Medium Farms segment, which holds the minority share of the farm size category below 61.8% held by large commercial operators, represents the largest untapped volume opportunity in this market. These farms cannot absorb direct drone ownership costs, making DaaS the only commercially viable access model. Operators who establish rural service center networks first will own the customer relationship in this segment before it scales.
Drone-as-a-Service models targeting smallholder farmers carry a +2.8% potential CAGR upside according to market opportunity analysis, making it the highest-upside single opportunity in the market. India, Southeast Asia, Latin America, and Africa are the primary geographies where the farm-size structure and DaaS economics align most directly. This creates a first-mover advantage window that closes as rural service infrastructure matures.
Orchard and high-value crop applications carry a +2.4% potential CAGR upside, concentrated in Brazil, Southern Europe, Japan, California, and China. These environments require rotary-wing or hybrid drone platforms capable of maneuvering in confined canopy spaces. By contrast, the Large-Scale Commercial Farms segment at 61.8% share is already heavily penetrated by fixed-wing platforms, making incremental share gains harder to achieve for new entrants without differentiated payload or autonomy capabilities.
Indoor and protected farming represents the longest execution horizon among identified opportunities, with a +1.3% CAGR upside potential across Japan, South Korea, the EU, Gulf states, and North America. Greenhouse and controlled-environment agriculture is scaling fastest in regions where land constraints and climate variability are strongest. This creates a distinct sub-market where miniaturized, sensor-intensive platforms will compete on inspection and crop health monitoring rather than spraying throughput.
Technology and Innovation Landscape - High-capacity platforms, AI flight optimization, and autonomous application systems define the current competitive frontier
Agricultural drone platforms are scaling toward high-capacity operational profiles. Modern platforms now support spray payloads of 40 kg and spreading payloads of 50 kg, with throughput reaching 21 hectares per hour for spraying and 1,500 kg of granules per hour for spreading. This capacity shift replaces multiple small-payload flight cycles with fewer high-capacity passes, which reduces total operating hours per hectare and lowers per-unit service cost on large commercial farms.
AI-based flight optimization is redefining mission efficiency at the route planning level. According to arXiv, reinforcement-learning navigation has reduced agricultural flight-path distances by 72% in real-world operations and 78% in simulation environments compared with conventional coverage planning. This improvement directly extends effective battery range per charge, which partially offsets the endurance constraint that has historically limited heavy-payload drone missions on large farmland holdings.
According to data from ag.dji.com, modern agricultural drone systems now support fully automatic flight modes, RTK guidance, and terrain-following functionality on slopes up to 50 degrees. These capabilities remove the need for manual pilot input during standard field operations, enabling a single operator to manage multiple drones simultaneously. This operational leverage directly improves the economics of DaaS businesses by reducing the labor cost per hectare served.
Agricultural drone systems are increasingly incorporating real-time pesticide mixing, UAV-based disease detection, and adaptive spraying technologies for precision crop protection, as noted by Nature. Variable-rate application and AI-powered disease identification allow operators to tailor treatment intensity to actual field conditions rather than applying uniform rates across entire fields. This precision reduces input waste and strengthens the financial case for drone-based crop protection against conventional ground-equipment alternatives.
Drivers
According to data from ResearchGate, agricultural drones reduce pesticide usage by 30 to 50% and cut labor costs by 40 to 60% through precision spraying and autonomous field operations. These cost reductions convert drone adoption from a capital expenditure decision into a margin defense strategy for commercial operators. Farms facing rising input costs and labor shortages have a direct financial incentive to accelerate fleet deployment now rather than later.
As reported by DJI’s agricultural annual report, approximately 400,000 active drones operated globally by end of 2024, a 90% increase from 2020 levels, supporting operations across more than 100 countries and over 300 crop types. This adoption scale signals that the market has passed the early commercial phase. Vendors entering now compete against an established base, meaning differentiation on service, data integration, and after-sales support matters more than hardware specification alone.
DJI’s media announcements indicate that agricultural drone deployment has saved approximately 222 million tons of water and reduced carbon emissions by about 30.87 million tons globally by 2025. These quantified sustainability outcomes give drone operators a verifiable ESG narrative for procurement teams and government buyers with environmental commitments. This shifts the competitive conversation beyond unit cost and into long-term supplier qualification criteria.
India’s government subsidy mechanisms have created a replicable demand multiplier at the smallholder level. Under SMAM, small and marginal farmers qualify for a 50% subsidy up to Rs. 5 lakh for drone purchases, while Custom Hiring Centres extend drone access to growers who cannot justify ownership. By 30 November 2025, 2,122 drones had been approved for distribution and 1,094 distributed to women SHGs under NAMO DRONE DIDI, covering 41,010 hectares and benefiting 452,291 farmers.
| Driver | (~) % Impact on CAGR Forecast | Geographic Relevance | Impact Timeline |
|---|---|---|---|
| Labor shortage and mechanized spraying substitution | +2.4% | North America core, Japan, Australia, Brazil large-farm belts | Short term (≤ 2 years) |
| India subsidy-led service model expansion | +2.1% | India core, South Asia spill-over | Short term (≤ 2 years) |
| Precision input savings and drift-control economics | +1.8% | North America, China, Japan, Brazil, selective EU | Medium term (2-4 years) |
| Regulatory normalization for commercial ag operations | +1.6% | U.S. core, EU selective, Brazil, APAC corridors | Medium term (2-4 years) |
| Farm digitization and variable-rate agronomy integration | +1.5% | U.S., Canada, China, Japan, Australia, India service corridors | Medium term (2-4 years) |
| Smallholder access via drone-as-a-service networks | +1.3% | India, Southeast Asia, parts of Africa, Latin America spill-over | Long term (≥ 4 years) |
Restraints
Agricultural drone operations in the United States generally remain restricted to Visual Line of Sight (VLOS), and routine Beyond Visual Line of Sight (BVLOS) operations still require specific approvals or waivers as of May 2026. As reported by DLA Piper, the FAA’s proposed Part 108 BVLOS framework received more than 3,000 public comments during the 2025 consultation process. This volume of public comment reflects the depth of stakeholder disagreement, which typically signals a longer timeline to final rulemaking and delayed commercial clarity for operators planning fleet expansion.
Crop-spraying drone operations face an additional regulatory layer that separates this application from imaging and mapping. In the U.S., spraying requires both Part 107 and Part 137 compliance, while European frameworks treat aerial drone spraying as in principle prohibited, with derogations limited and conditional. Operators targeting high-value spray contracts in regulated markets absorb approval costs, chemical-use restrictions, and customer onboarding cycles that can extend sales conversion by 6 to 12 months and lower revenue realization per deployed platform by an estimated 15 to 25% in tightly regulated jurisdictions.
According to data from arXiv, agricultural drones face battery endurance constraints that restrict operational efficiency across large farmland holdings. Manufacturers are responding by developing AI flight optimization systems that prioritize shorter flight-path distances to maximize per-charge coverage. This engineering workaround reduces the gap but does not eliminate the structural limitation that heavy-payload spray missions place on current battery technology, keeping multi-trip refueling a cost and logistics reality for large commercial operators.
| Restraint | (~) % Impact on CAGR Forecast | Geographic Relevance | Impact Timeline |
|---|---|---|---|
| BVLOS and airspace limits | -2.8% | North America core, EU, Japan, Korea | Short term (≤ 2 years) |
| Aerial spraying permit barriers | -2.4% | EU core, India, parts of LatAm | Medium term (2-4 years) |
| China-linked component tariffs | -1.9% | U.S. core, North America spillover | Short term (≤ 2 years) |
| High upfront ownership cost | -1.7% | APAC emerging, LatAm, Africa | Medium term (2-4 years) |
| Pilot training and compliance load | -1.5% | Global, strongest in fragmented farm markets | Short term (≤ 2 years) |
| Insurance and liability drag | -1.1% | U.S., EU, Australia | Medium term (2-4 years) |
Challenges
Agricultural drone operations face a documentation-to-flight-time imbalance that does not scale as fleets grow. Overlapping pilot licensing, aircraft registration, Remote ID conformity, and dual Part 107 and Part 137 permissions for spraying create pre-season authorization lags of 2 to 8 weeks when operators enter new service territories. This lag directly erodes seasonal revenue windows that cannot be recovered within a single crop cycle.
Fleet scaling compounds the compliance burden further. Operators transitioning from single-drone to multi-drone deployment models face an 8% to 12% underutilization penalty, while usable fleet hours during peak operational windows fall 10% to 20% below capacity. This creates a structural drag on scalable utilization. A compliance-by-design operating model built around standardized mission templates and pre-cleared geographies is the required response for operators targeting commercial-scale deployment.
| Challenge | (~) % CAGR Friction Drag | Geographic Relevance | Mitigation Horizon |
|---|---|---|---|
| Airspace approval bottlenecks | -1.8% | North America core, EU regulatory hubs | Medium term (2-4 years) |
| Spray-use compliance fragmentation | -1.6% | EU member states, specialty-crop corridors | Long term (≥ 4 years) |
| Battery logistics volatility | -1.2% | APAC export routes, North America import chains, remote farm regions | Medium term (2-4 years) |
| Skilled operator scarcity | -1.4% | U.S. row-crop belts, Latin America plantations, APAC service markets | Medium term (2-4 years) |
| Data interoperability gaps | -1.0% | North America precision farms, EU digital farms, large APAC enterprises | Short term (≤ 2 years) |
| Farm-structure deployment mismatch | -1.3% | EU smallholder zones, South Asia small farms, Japan aging-farm clusters | Long term (≥ 4 years) |
Opportunities
As per our research, more than 600,000 agricultural drones and over 600,000 trained operators were active globally by end of 2025. This installed base creates direct demand for drone services, operator training programs, maintenance contracts, and software platforms. Companies that position now as service aggregators around this operator ecosystem will capture recurring revenue that hardware-only vendors cannot access.
Figures from PR Newswire show DJI expanded its agricultural ecosystem to 3,500 service and repair centers worldwide by 2026. This infrastructure density creates a commercial template for aftermarket service networks that generate revenue independent of new unit sales. Competitors and new entrants that build or acquire dense local service coverage in high-fleet-density regions will reduce customer churn and increase lifetime platform value.
Based on arXiv data, reinforcement-learning drone navigation reduced agricultural flight-path lengths by 72% in real-world operations and 78% in simulation environments compared with conventional coverage planning. This efficiency gain directly lowers operational cost per hectare, which strengthens the economic case for DaaS pricing models built on per-acre fees. Operators deploying AI-optimized navigation can offer lower service prices while expanding gross margin simultaneously.
Input-linked outcome contracts represent an underexploited commercial structure for drone operators and OEMs. Shifting from per-acre service fees to performance-linked contracts tied to documented input savings could expand gross margin per customer by 500 to 900 basis points and increase revenue per farm by 1.4x to 1.8x. North America, Brazil, and parts of Europe offer the strongest early fit, where established agri-retail channels make savings measurement tractable.
| Opportunity | (~) % Potential CAGR Upside | Geographic Relevance | Execution Window |
|---|---|---|---|
| Drone-as-a-Service roll-up | +2.8% | India, SE Asia, LatAm, Africa | Short term |
| Input-linked outcome contracts | +2.1% | North America core, Brazil, EU | Medium term |
| BVLOS field automation | +1.9% | U.S., Canada, EU, Australia | Medium term |
| Orchard and high-value crops | +2.4% | Brazil, EU South, Japan, California, China | Short term |
| Indoor and protected farming | +1.3% | Japan, South Korea, EU, Gulf, North America | Medium term |
| Agronomy data platforms and insurance | +1.7% | U.S., EU, Brazil, India | Long term |
Regional Analysis
Asia Pacific Dominates the Agriculture Drone Market with a Market Share of 42.3%, Valued at USD 2.1 Billion
Asia Pacific leads the global agriculture drone market at 42.3% share, valued at USD 2.1 Billion in 2025. China’s large-scale commercial farm deployments and India’s government-subsidized distribution programs through SMAM and NAMO DRONE DIDI frameworks together anchor this dominance. By November 2025, ICAR-linked demonstrations alone had covered 41,010 hectares across India, benefiting 452,291 farmers.
North America occupies the second position in the global agriculture drone market. The region’s large-acreage row-crop farms and advanced farm management technology ecosystems support strong commercial drone adoption. However, VLOS restrictions and the pending FAA Part 108 BVLOS framework create regulatory friction that limits full fleet throughput, particularly for operators targeting multi-drone coordinated spraying missions across large contiguous crop areas.
Europe holds a structurally constrained position in this market relative to its farm economy size. Aerial drone spraying operates under a de facto prohibition in several member states, with derogations limited and conditional. This regulatory architecture pushes European operators toward imaging and mapping applications rather than higher-value crop protection services, compressing per-platform revenue and slowing fleet replacement cycles compared to less restricted markets.
Latin America represents a commercially active growth zone, led by Brazil’s large-scale sugarcane, soy, and corn operations. The region’s plantation-scale farm structures are operationally aligned with drone efficiency economics, and its regulatory environment is comparatively accessible. In August 2025, AgEagle Aerial Systems deployed drone and sensor technologies with Brazilian biofuel producer Atvos to improve sugarcane efficiency and sustainability, reflecting growing commercial engagement in the region.
Key Regions and Countries
North America
- US
- Canada
Europe
- Germany
- France
- The UK
- Spain
- Italy
- Rest of Europe
Asia Pacific
- China
- Japan
- South Korea
- India
- Australia
- Rest of APAC
Latin America
- Brazil
- Mexico
- Rest of Latin America
Middle East and Africa
- GCC
- South Africa
- Rest of MEA
Key Company Insights
DJI (Da-Jiang Innovations) has built the most extensive agricultural drone service infrastructure globally, operating 3,500 service and repair centers worldwide by 2026. This aftermarket network creates a structural moat that pure hardware competitors cannot replicate quickly. By April 2026, DJI Agriculture reported its drone fleet had saved approximately 410 million tons of water and cut carbon emissions by 51 million tons, providing measurable ESG credentials that strengthen enterprise and government sales cycles.
In November 2025, XAG Co. Ltd. unveiled the R Series Agricultural Rover alongside the P150 Max Agricultural Drone at Agritechnica, extending its smart farming portfolio into autonomous ground-based crop protection for orchards and greenhouses. This dual-platform approach positions XAG to address terrain-restricted environments where aerial drones face operational limits. Combining aerial and ground-based autonomous systems gives XAG a competitive differentiation that no single-platform competitor can match in complex specialty crop environments.
Key Players
- DJI (Da-Jiang Innovations)
- XAG Co. Ltd.
- Trimble Inc.
- AgEagle Aerial Systems Inc.
- Yamaha Motor Co. Ltd.
- Parrot Drone SAS
- John Deere
- PrecisionHawk Inc.
- AeroVironment Inc.
- Delair (DELAIR SAS)
- Sentera LLC
- ideaForge Technology Ltd.
- Garuda Aerospace
- American Robotics (Ondas Networks)
- 3DR (3D Robotics Inc.)
Recent Developments
- January 2026 – EagleNXT (formerly AgEagle) announced relocation of its global headquarters to Texas and established its first U.S. production line for the eBee VISION drone platform, strengthening domestic manufacturing and drone technology development capabilities.
- April 2026 – DJI Agriculture reported that global adoption of its agricultural drones has saved approximately 410 million tons of water and cut carbon emissions by 51 million tons by end of 2025, reinforcing its global network investment to improve precision farming efficiency.
- November 2025 – XAG unveiled its R Series Agricultural Rover alongside the P150 Max Agricultural Drone at Agritechnica, expanding its smart farming portfolio with autonomous ground-based crop protection solutions for orchards and greenhouses.
Report Scope
| Report Features | Description |
|---|---|
| Market Value (2025) | USD 5.0 Billion |
| Forecast Revenue (2035) | USD 29.9 Billion |
| CAGR (2026-2035) | 19.5% |
| Base Year for Estimation | 2025 |
| Historic Period | 2020-2024 |
| Forecast Period | 2026-2035 |
| Report Coverage | Revenue Forecast, Market Dynamics, Market Opportunity Analysis, Technology and Innovation Landscape, Competitive Landscape, Recent Developments |
| Segments Covered | By Components (Hardware: Cameras and Sensors, Airframes, Batteries, Propulsion Systems, Navigating Gear; Software and Services: Drone-as-a-Service models, Cloud-Based Analytics), By Drone Type (Fixed-Wing Drones, Rotary-Wing Drones, Hybrid Drones), By Payload Capacity (Lightweight less than 10 kg, Medium-Weight 10 to 25 kg, Heavy-Weight greater than 25 kg), By Application (Precision Farming/Crop Management, Crop Spraying, Livestock and Soil Analysis), By Farm Size (Large-Scale Commercial Farms, Small to Medium Farms) |
| Regional Analysis | North America (US and Canada), Europe (Germany, France, The UK, Spain, Italy, and Rest of Europe), Asia Pacific (China, Japan, South Korea, India, Australia, and Rest of APAC), Latin America (Brazil, Mexico, and Rest of Latin America), Middle East and Africa (GCC, South Africa, and Rest of MEA) |
| Competitive Landscape | DJI (Da-Jiang Innovations), XAG Co. Ltd., Trimble Inc., AgEagle Aerial Systems Inc., Yamaha Motor Co. Ltd., Parrot Drone SAS, John Deere, PrecisionHawk Inc., AeroVironment Inc., Delair (DELAIR SAS), Sentera LLC, ideaForge Technology Ltd., Garuda Aerospace, American Robotics (Ondas Networks), 3DR (3D Robotics Inc.) |
| Customization Scope | Customization for segments, region/country-level will be provided. Additional customization can be done based on requirements. |
| Purchase Options | We have three licenses to opt for: Single User License, Multi-User License (Up to 5 Users), Corporate Use License (Unlimited User and Printable PDF) |


