


Quick Navigation
Report Overview
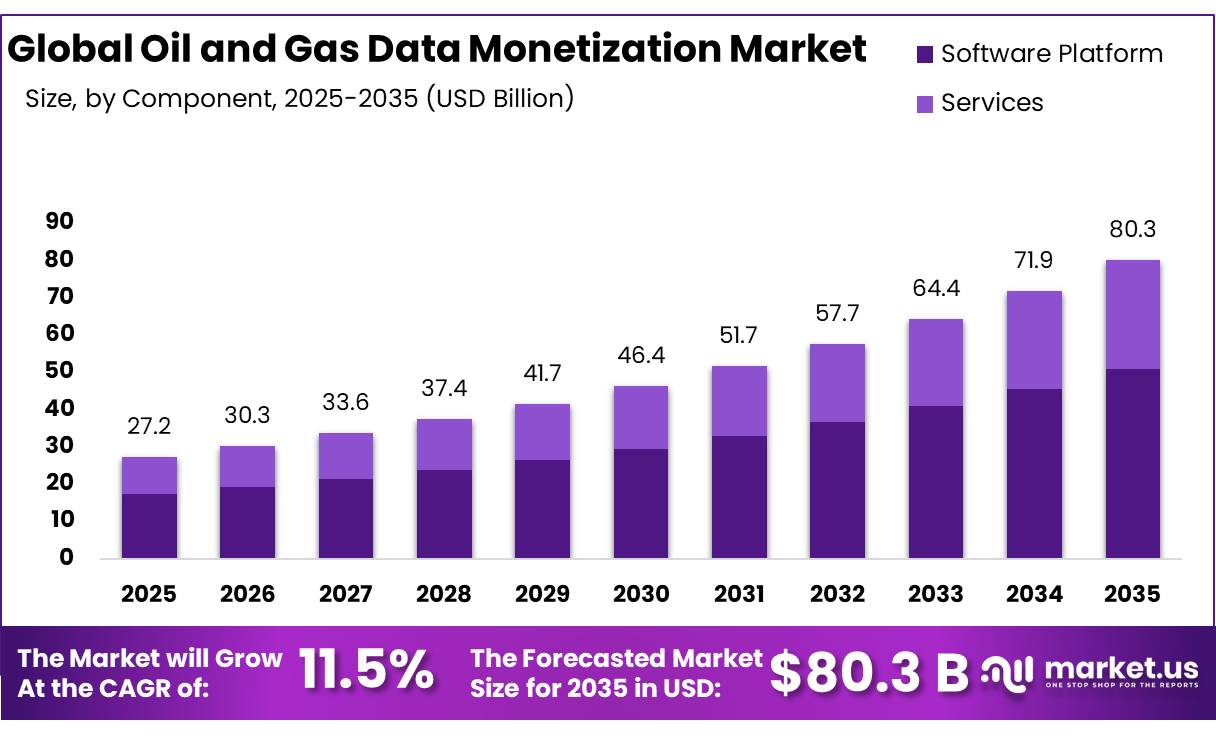
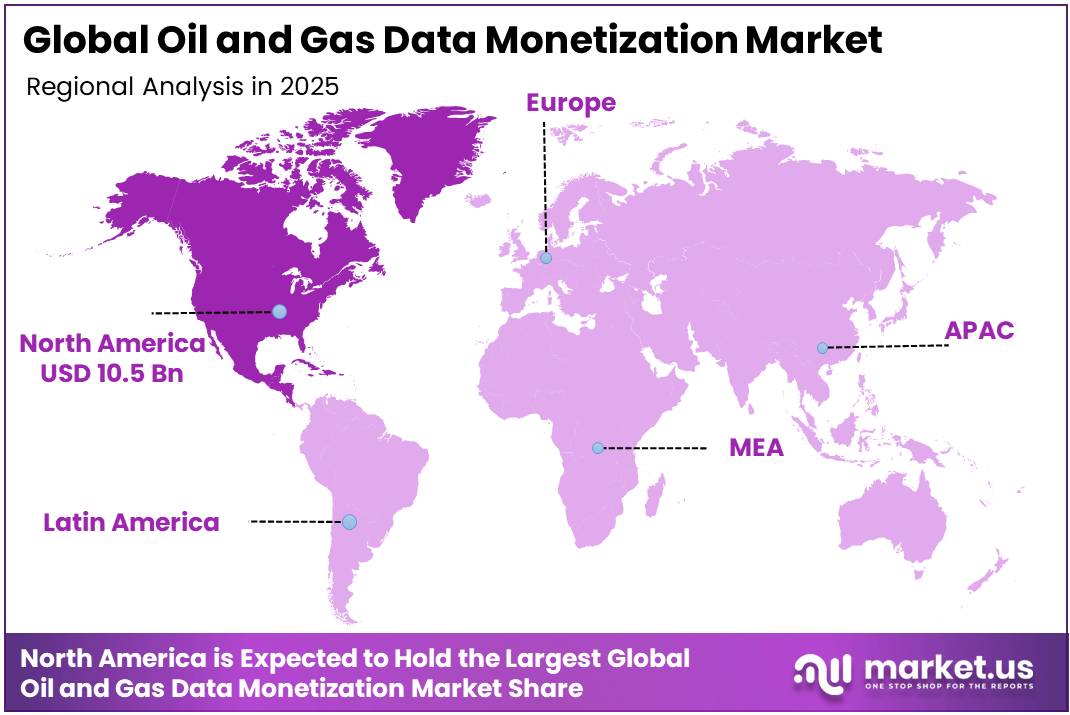
In 2025, the Global Oil and Gas Data Monetization Market was valued at US$27.2 billion, and between 2026 and 2035, this market is estimated to register a CAGR of 11.5%, reaching about US$80.3 billion by 2035. In 2025, North America led the market, achieving over 38.6% share with a revenue of US$10.5 Billion.
Key Takeaways
- The Global Oil and Gas Data Monetization Market was valued at US$27.2 billion in 2025.
- The market is projected to grow at a CAGR of 11.5% and is estimated to reach US$80.3 billion by 2035.
- On the basis of component, Software Platform dominated the market, constituting 63.5% of the total market share.
- Based on the method, Indirect Data Monetization dominated the market, with a substantial market share of around 64.67%.
- Based on the application, Upstream led the market, comprising 47.3% of the total market.
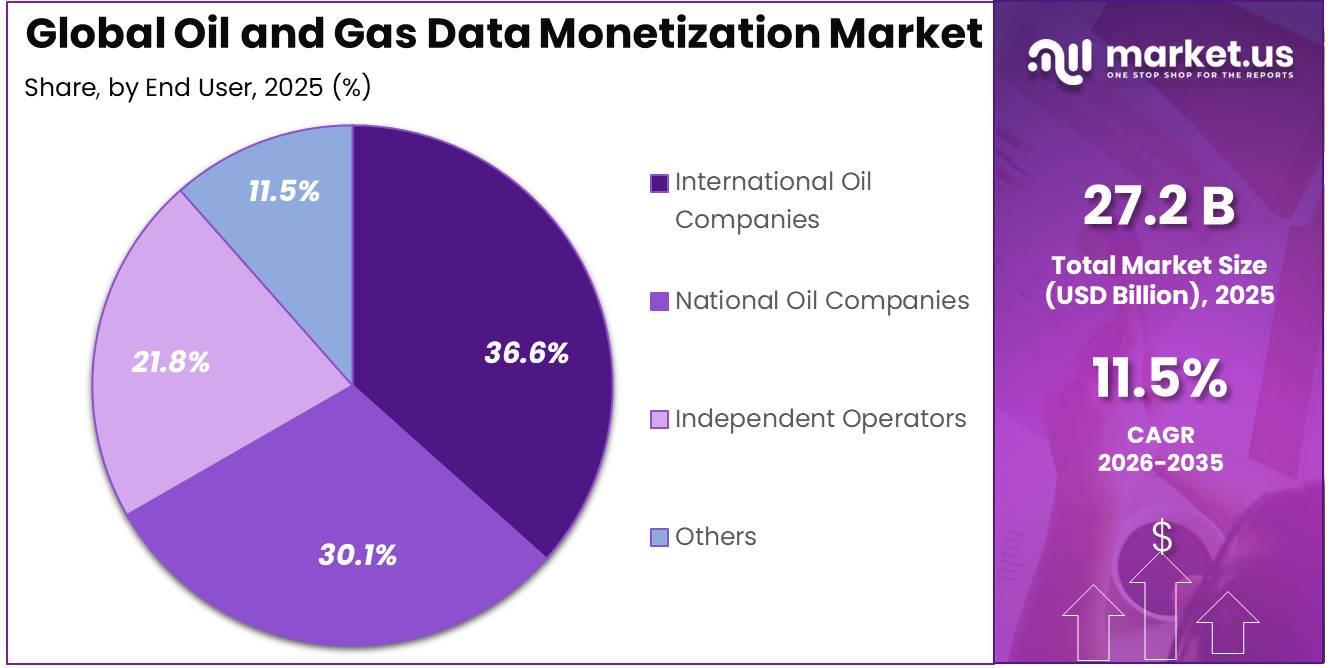
- On the basis of end user, International Oil Companies dominated the market, constituting 36.6% of the total market share.
- In 2025, North America was the most dominant region in the market, accounting for 38.6% of the total global consumption.
Oil and gas data monetization is becoming an important part of the industry’s digital transformation as operators use geological, seismic, drilling, production, equipment and commercial data to improve asset economics. The scale of the underlying industry creates a large base for data-driven services. According to the International Energy Agency, global upstream oil and gas investment was expected to remain just under USD 570 billion in 2025, down around 4%, while about 40% of upstream spending was directed toward slowing production declines at existing fields. These pressures encourage operators to extract more value from existing assets through analytics, predictive models and integrated data platforms.
The industrial scenario is increasingly centered on improving productivity without proportionally increasing physical activity. According to the U.S. Energy Information Administration, U.S. crude oil production reached a record 13.6 million barrels per day in 2025, increasing 3%, even though the average number of active Lower-48 rigs was 5% lower than in the previous year. This operating environment strengthens the business case for reservoir analytics, drilling optimization, automated workflows, digital twins and machine-learning systems that help companies obtain higher production from existing infrastructure and generate measurable financial returns from operational data.
Commercial results from oilfield technology companies indicate that digital information is already generating direct revenue. SLB reported fourth-quarter 2025 Digital revenue of USD 825 million, representing 17% year-over-year growth, while annual recurring revenue for its Digital Division reached USD 1.0 billion at the end of 2025. These figures demonstrate how cloud platforms, exploration software, AI-enabled operations and digital applications are moving beyond internal efficiency tools and becoming stand-alone commercial offerings for energy producers.
Public investment is expected to accelerate this trend. In July 2026, the U.S. Department of Energy announced up to USD 65.5 million for oil and natural gas research, development and deployment, while referencing another USD 150 million funding opportunity supporting unconventional resource recovery and related technologies. The program specifically includes continuous monitoring, AI-supported digital twins and infrastructure optimization designed to increase saleable hydrocarbons and lower operating costs, directly supporting wider adoption of data monetization technologies.
Future growth opportunities are therefore expected to expand beyond traditional upstream optimization. Shared subsurface databases, AI-based production forecasting, predictive maintenance, emissions monitoring, equipment-performance analytics and data-as-a-service platforms can create additional value from information already collected during exploration and production. Norway’s Diskos system now contains data from 25 members, around 22 associated members, and 39 universities and research institutions, illustrating how petroleum information can support a broader ecosystem of operators, service companies and researchers. As datasets become more standardized and cloud-accessible, monetization opportunities are likely to expand across carbon storage, geothermal development, asset trading and energy-transition planning.
Component Analysis
Software Platform dominates with a 63.5% share as oil and gas operators rely on digital tools to manage growing production data.
In 2025, Software Platform held a dominant market position, capturing more than a 63.5% share in the Oil and Gas Data Monetization Market by component. Software platforms remain central to the industry because operators use them to collect, integrate, visualize, and analyse large volumes of well, reservoir, production, equipment, and operational data. The growing scale of oil production further increases the need for reliable data-management and analytics platforms. According to the U.S. Energy Information Administration (EIA), U.S. crude oil production reached a record 13.6 million barrels per day in 2025. New wells produced around 2.9 million barrels per day, while wells drilled before 2025 contributed about 8.3 million barrels per day. Managing production across new and existing wells requires continuous data processing, performance tracking, forecasting, and operational analysis, supporting strong adoption of software platforms for oil and gas data monetization.
Services is the fastest growing segment in the Oil and Gas Data Monetization Market. During 2025, demand continued to strengthen as operators required outside expertise to connect older operational systems with newer cloud, analytics, and digital platforms. Service providers support data migration, platform implementation, system integration, cybersecurity, consulting, and ongoing technical management. Growth is also being supported by the need to improve data quality and make information available across exploration, production, maintenance, and decommissioning activities.
Method Analysis
Indirect Data Monetization dominates with a 64.7% share as oil and gas companies gain more value from data-driven operational decisions
In 2025, Indirect Data Monetization held a dominant market position, capturing more than a 64.7% share. The segment leads because oil and gas companies mainly use operational, seismic, well, production, and asset data internally to improve field planning, maintenance, reservoir management, cost control, and investment decisions rather than selling the data itself. Supporting this trend, the UK government’s North Sea Transition Authority reported that 374 TB of reportable data was loaded into the National Data Repository during 2025, including 73 TB made publicly available for download. The growing availability of structured industry data allows operators to combine historical and real-time information with analytics, helping generate indirect financial value through better decisions and improved asset performance.
Direct Data Monetization is the fastest growing segment. In 2025, the segment gained importance as oil and gas companies increasingly explored ways to generate revenue directly from specialized datasets, analytics services, technical information, digital platforms, and data-access solutions. Geological, seismic, drilling, production, and asset-performance information can be packaged for technology providers, engineering firms, investors, researchers, and other energy businesses. The expansion of cloud platforms and standardized data-sharing systems is making commercial data distribution easier while improving access for external users.
Application Analysis
Upstream dominates with 47.3% as high production activity increases the value of operational data
In 2025, Upstream held a dominant market position, capturing more than a 47.3% share. The segment remained important as exploration, drilling, reservoir management, and production activities continuously generated large volumes of operational data. According to the U.S. Energy Information Administration (EIA), in data published on May 11, 2026, U.S. dry natural gas production increased by more than 4% in 2025 and reached a record 39 trillion cubic feet, with strong production growth across major producing regions such as Appalachia, Permian, and Haynesville. The high level of upstream production creates substantial well, reservoir, equipment, and production data, encouraging oil and gas companies to use analytics platforms for production optimization, predictive maintenance, asset monitoring, and operational planning.
Midstream is the fastest-growing segment in the Oil and Gas Data Monetization Market. In 2025, demand continued to strengthen as pipeline, terminal, transportation, and storage operators placed greater focus on real-time asset visibility. Midstream companies generate continuous information from pipeline sensors, compressor stations, storage facilities, metering systems, terminals, and transportation networks. As oil and gas transportation networks become more digitally connected, midstream operators are expected to increase the use of data monetization tools to improve reliability, reduce downtime, and strengthen infrastructure management.
End User Analysis
International Oil Companies dominate with a 36.6% share, backed by data-intensive offshore operations
In 2025, International Oil Companies held a dominant market position, capturing more than a 36.6% share. Their leadership is supported by large upstream portfolios where continuous information is generated from seismic surveys, drilling systems, subsea equipment, production facilities, and asset monitoring. International operators increasingly use this operational data for reservoir optimization, predictive maintenance, production planning, and equipment performance analysis. According to the U.S. Bureau of Safety and Environmental Enforcement, oil production from the U.S. Outer Continental Shelf reached a record 714 million barrels in 2025. The agency stated that major deepwater projects contributed to the higher output.
National Oil Companies are the fastest growing segment in the Oil and Gas Data Monetization Market. In 2025 and 2026, state-owned producers continued moving toward centralized data platforms, cloud-based asset management, artificial intelligence, reservoir modelling, and real-time production monitoring. These companies manage strategically important national oil and gas resources, making better use of operational data increasingly important for improving recovery rates, controlling production costs, planning infrastructure, and managing long-life assets.
Key Market Segments
By Component:
- Software Platform
- Services
By Method:
- Indirect Data Monetization
- Direct Data Monetization
By Application:
- Upstream
- Midstream
- Downstream
By End User:
- International Oil Companies
- National Oil Companies
- Independent Operators
- Others
Driver Analysis
India offshore seismic-data push
India’s state-backed offshore exploration programme is a direct stimulus to geoscience-data creation, reprocessing, interpretation, hosting, and licensing because it funds both acquisition and downstream AI-enabled use of national subsurface information. The approved ₹84,084 crore Samudra Manthan programme runs through 31 March 2031 and allocates ₹28,534 crore to offshore data acquisition and processing, including ₹12,000 crore for basin-wide 2D seismic, ₹12,534 crore for 3D and related techniques, and ₹4,000 crore for National Data Repository reprocessing and AI tools; it also provides for 60 deepwater exploration wells, with government support up to 50% of eligible drilling cost or ₹675 crore per well, whichever is lower.
This changes the monetisation opportunity from selling isolated seismic vintages to delivering persistent data environments that combine raw and processed seismic, well logs, velocity models, prospectivity models, drilling outcomes, and AI-assisted interpretation; vendors can therefore earn through storage, compute, model subscriptions, quality control, secure collaboration rooms, and application programming interfaces for licence holders. Common infrastructure and larger public data inventories lower the unit cost of prospect screening, while successful well results continually improve model-training labels supporting a medium-term compounding effect rather than a single acquisition-cycle revenue spike.
Driver Impact Analysis
| Driver | (~) % Impact on CAGR Forecast | Geographic Relevance | Impact Timeline |
|---|---|---|---|
| Methane MRV & leak-data mandates | +2.1 pp | North America core, EU, LNG exporters | Short term (≤ 2 years) |
| EU import traceability rules | +1.7 pp | EU, US, Middle East, Africa, APAC LNG | Medium term (2-4 years) |
| India offshore seismic-data push | +1.6 pp | India core, Indian Ocean spill-over | Medium term (2-4 years) |
| Record upstream data volumes | +1.5 pp | North America core, Brazil, Middle East | Short term (≤ 2 years) |
| Public subsurface-data repositories | +1.2 pp | UK North Sea, US offshore, Europe | Medium term (2-4 years) |
| OT cybersecurity & trusted exchange | +1.0 pp | EU, UK, North America, GCC | Short term (≤ 2 years) |
Restraint Analysis
Legacy-data remediation
The monetizable asset is rarely a clean, standardized dataset: decades of scanned logs, inconsistent well identifiers, proprietary seismic formats, sparse metadata, disconnected historians, and uneven sensor calibration force the vendor and operator to spend before an analytics product can be trusted, priced, or transferred. Although India’s National Data Repository was established specifically to preserve, maintain, and disseminate E&P information systematically, the need for a centrally managed repository itself illustrates the strategic importance and historic fragmentation of exploration data estates.
Our 2026 project model assigns 35–50% of first-year program effort to extraction, quality profiling, master-data reconciliation, entitlement mapping, and contextual metadata rather than revenue-generating analytics; a 1,000-well portfolio therefore can require 12–24 months to reach an externally sellable reliability threshold, versus a 4–6-month target for a digitally native asset. The -1.6-point CAGR deduction reflects deferred subscription starts, lower willingness to pay for data with uncertain lineage, and 10–20% scope creep that converts supposedly scalable SaaS deployments into bespoke integration engagements across North America, Europe, and APAC.
Restraint Impact Analysis
| Restraint | (~) % Impact on CAGR Forecast | Geographic Relevance | Impact Timeline |
|---|---|---|---|
| OT cyber-risk premium | -2.2 pp | North America, EU, GCC | Medium term (2–4 years) |
| Data sovereignty & access rules | -1.8 pp | EU, India, China, MEA | Medium term (2–4 years) |
| Legacy-data remediation | -1.6 pp | North America core, EU, APAC | Medium term (2–4 years) |
| Unclear data ownership | -1.3 pp | GCC, Latin America, India, Africa | Long term (≥ 4 years) |
| Compliance-data CapEx diversion | -1.1 pp | U.S., EU, Canada, Australia | Short term (≤ 2 years) |
| Specialist-talent scarcity | -0.9 pp | Global, acute in mature basins | Medium term (2–4 years) |
Opportunity Analysis
Methane-Intensity Data Passports
The most immediate white space is a transaction-grade methane-intensity “passport” that links facility-level measurement, satellite-event alerts, repair evidence, custody transfer, LNG liquefaction data, and delivered-cargo certificates into an auditable API product rather than merely selling operational emissions software a distinction that makes this an export-market access and premium-pricing monetization model, not a current digitalization driver. The EU’s methane regulation already requires importers to provide origin, route, measurement, reporting, verification, and leak-detection information; it introduces equivalent monitoring, reporting, and verification requirements from January 2027, methane-intensity reporting from August 2028, and an intensity threshold from August 2030.
A provider securing 15–25% of a 1,000-cargo annual LNG portfolio could price a base compliance subscription at $0.15–0.35 million per importer annually, plus $4,000–12,000 per verified cargo and $25,000–75,000 per producing asset, creating $8–20 million annual recurring revenue (ARR) per large exporter ecosystem at 65–75% gross margin; more importantly, a verified passport can reduce buyer due-diligence cycles from an estimated 8–12 weeks to 2–4 weeks and establish data ownership before compliance becomes commoditized.
The opportunity exists because current monetization remains predominantly inside the asset boundary, whereas the monetizable unit becomes the export molecule and its compliance evidence; the United States’ Super Emitter Program further demonstrates the shift toward externally observable, location-specific event data, defining a super-emitter event at 100 kilograms of methane per hour or more.
Opportunity Impact Analysis
| Opportunity | (~) % Potential CAGR Upside | Geographic Relevance | Execution Window |
|---|---|---|---|
| Methane-intensity data passports | +3.0% | EU imports, US, Middle East, LNG Asia | Short term (≤ 2 years) |
| CCUS and geothermal subsurface twins | +2.6% | North America, North Sea, GCC, APAC | Medium term (2-4 years) |
| Federated NOC data exchanges | +2.3% | GCC, India, Latin America, Africa | Medium term (2-4 years) |
| LNG cargo traceability APIs | +1.9% | EU, US Gulf, Qatar, Australia, Japan | Short term (≤ 2 years) |
| Decommissioning intelligence marketplace | +1.6% | North Sea, Gulf of Mexico, APAC | Medium term (2-4 years) |
| Energy-infrastructure risk data products | +1.4% | North America, EU, Middle East | Long term (≥ 4 years) |
Challenges Analysis
Hybrid Talent Pipeline Deficit
Data monetization requires a scarce combined capability: personnel must understand reservoir and production physics, field operations, information architecture, commercial licensing and AI assurance simultaneously; hiring a generic data-science team or a conventional petroleum-engineering team alone does not close that interface. U.S. Bureau of Labor Statistics projections illustrate the imbalance: data-scientist employment is projected to rise 33.5% from 245,900 in 2024 to 328,300 in 2034, whereas petroleum-engineer employment rises only 1.3%, from 19,600 to 19,800, with about 1,200 annual petroleum-engineer openings.
An analyst staffing model therefore assumes a large operator needs 1 hybrid domain-data product lead per 15–25 data engineers and scientists, but can sustain only 55–70% of that target during the first two years; this causes 8–16-week backlog extensions for data-product validation, weaker pricing narratives and 15–30% greater dependence on external integrators. The associated -0.9-point drag will persist beyond four years unless companies establish rotational programs between assets and digital teams, fund 12–18-month domain-data academies, codify expert interpretation into reusable decision libraries and retain senior field specialists through flexible, part-time model-review roles rather than allowing critical context to exit with retirement.
Challenges Impact Analysis
| Challenge | (~) % CAGR Friction Drag | Geographic Relevance | Mitigation Horizon |
|---|---|---|---|
| Brownfield Data Interoperability | -1.4% | North America, Middle East, APAC mature fields | Long term (≥ 4 years) |
| OT Cybersecurity Trust Gap | -1.2% | North America core, EU regulatory hubs, GCC | Medium term (2-4 years) |
| Data Rights Fragmentation | -1.0% | North Sea, Gulf of Mexico, India, Africa | Long term (≥ 4 years) |
| Hybrid Talent Pipeline Deficit | -0.9% | Global, especially mature basins | Long term (≥ 4 years) |
| Sparse Labels And Model Drift | -0.8% | Offshore, LNG, unconventional basins | Medium term (2-4 years) |
| Edge Connectivity Cost Burden | -0.6% | Offshore, remote deserts, Arctic, deepwater | Medium term (2-4 years) |
Geopolitical Impact Analysis
War-Driven Energy Disruptions Increase Demand for Real-Time Oil and Gas Data
The continuing Russia-Ukraine war and recent Middle East conflict have increased the value of real-time data across the oil and gas industry. Producers, traders, refiners, and pipeline operators are relying more heavily on analytics to track supply disruptions, shipping routes, sanctions, storage levels, price movements, and infrastructure risks. This is strengthening demand for platforms that can combine operational, geospatial, commercial, and market data and convert it into faster business decisions.
The impact became clear during the 2026 Middle East disruption. The U.S. Energy Information Administration estimated that crude oil production shut-ins across Iraq, Saudi Arabia, Kuwait, the UAE, Qatar, and Bahrain reached 10.5 million barrels per day in April 2026. Such large disruptions increase the commercial importance of tanker tracking, production monitoring, predictive analytics, and scenario modelling. For the Oil and Gas Data Monetization market, war-related uncertainty is therefore creating stronger demand for high-frequency datasets and decision-support tools.
At the same time, companies face greater cybersecurity, data-quality, and compliance risks as sanctions and trade routes change quickly. The market is likely to benefit from investments in AI-based forecasting, secure cloud platforms, digital twins, and real-time asset intelligence as energy companies seek faster visibility during geopolitical disruptions across global energy operations.
Regional Analysis
North America Leads Oil and Gas Data Monetization, While Asia Pacific Accelerates Digital Adoption
In 2025, North America held a dominant position in the Oil and Gas Data Monetization Market, accounting for 38.6% and USD 10.5 billion. The region benefits from large shale operations, mature digital infrastructure, extensive cloud deployment, and strong adoption of AI-based production analytics. The U.S. Energy Information Administration reported that U.S. crude oil production reached a record 13.6 million barrels per day in 2025, while dry natural gas production reached 39 trillion cubic feet. These large production volumes generate continuous drilling, reservoir, pipeline, equipment, and trading data, strengthening demand for platforms that convert operational information into commercial and strategic value.
Asia Pacific is expected to be the fastest-growing regional market as major energy producers expand digital oilfield systems, automation, cloud platforms, and real-time operational analytics. China provides a strong example of the region’s expanding data base. The National Bureau of Statistics reported that China produced 216.05 million tonnes of crude oil in 2025, an increase of 1.5%, while natural gas production reached 261.9 billion cubic metres, rising 6.2%. Growing production activity increases the volume of geological, drilling, processing, equipment, and supply-chain information available for monetization, supporting wider use of predictive analytics, AI, digital twins, and integrated data-management platforms regionally.
Key Regions and Countries Covered
- North America
- The US
- Canada
- Europe
- Germany
- France
- The UK
- Spain
- Italy
- Russia & CIS
- Rest of Europe
- APAC
- China
- Japan
- South Korea
- India
- ASEAN
- Rest of APAC
- Latin America
- Brazil
- Mexico
- Rest of Latin America
- Middle East & Africa
- GCC
- South Africa
- Rest of MEA
Key Players Analysis
NETSCOUT Systems supports oil and gas data monetization through network visibility, service assurance, observability, and cybersecurity capabilities that help protect and analyze operational data flows. In fiscal 2026, the company generated USD 859.5 million in revenue, including USD 370.1 million from products and USD 489.3 million from services. GAAP operating income reached USD 109.8 million, with a 12.8% operating margin.
Comviva contributes to data monetization through AI-driven customer value management, digital platforms, analytics, and real-time monetization technologies. In 2026, its mobiquity Pay platform served more than 500 million users through over 70 deployments across more than 50 countries and processed around USD 0.5 trillion annually. Across the wider business, Comviva serves 200+ communication service providers and enterprises in 100+ countries.
Paxata, Inc. developed self-service data preparation and data-fabric technology designed to transform raw information into analysis-ready datasets. DataRobot agreed to acquire Paxata in December 2019, making it DataRobot’s third and largest acquisition that year and fifth acquisition since 2017. Paxata had raised USD 86 million in venture funding and was used by thousands of users before the transaction.
The Major Players in the Industry
- Adastra
- CellOS Software Ltd
- Connectiva Analytics and Insights Ltd.
- Dawex Systems
- Infosys Limited
- Comviva
- MNUBO
- NETSCOUT Systems, Inc.
- Paxata, Inc.
- Optiva Inc.
- SQLstream, Inc.
- Other Key Players
Key Development
- In November 2025, Infosys introduced an energy-sector AI Agent using Infosys Topaz, Infosys Cobalt and Microsoft technologies; the solution can process well logs, images, plots and tables and convert real-time operational data into predictive insights and automated reports, making it directly relevant to upstream oil and gas data monetization.
- In June 2025, Comviva strengthened its data monetization capabilities through an expanded partnership with Amazon Web Services (AWS), using AI, machine learning and generative AI across platforms such as MobiLytix, BlueMarble and its API Marketplace, while moving more products toward a scalable SaaS model; this type of cloud-based analytics architecture can also support data-heavy oil and gas operations.
Report Scope
| Report Features | Description |
|---|---|
| Market Value (2025) | US$27.2 Bn |
| Forecast Revenue (2035) | US$80.3 Bn |
| CAGR (2026-2035) | 11.5% |
| Base Year for Estimation | 2025 |
| Historic Period | 2020-2024 |
| Forecast Period | 2026-2035 |
| Report Coverage | Revenue Forecast, Market Dynamics, Competitive Landscape, Recent Developments |
| Segments Covered | By component (Software Platform, Services), By method (Indirect Data Monetization, Direct Data Monetization), By application (Upstream, Midstream, Downstream), and By end user (International Oil Companies, National Oil Companies, Independent Operators, Others) |
| Regional Analysis | North America – The US & Canada; Europe – Germany, France, The UK, Spain, Italy, Russia & CIS, Rest of Europe; APAC– China, Japan, South Korea, India, ASEAN & Rest of APAC; Latin America– Brazil, Mexico & Rest of Latin America; Middle East & Africa– GCC, South Africa, & Rest of MEA |
| Competitive Landscape | Adastra, CellOS Software Ltd, Connectiva Analytics and Insights Ltd., Dawex Systems, Infosys Limited, Comviva, MNUBO, NETSCOUT Systems, Inc., Paxata, Inc., Optiva Inc., SQLstream, Inc., Other Key Players |
| Customization Scope | Customization for segments, region/country-level will be provided. Moreover, additional customization can be done based on the requirements. |
| Purchase Options | We have three licenses to opt for: Single User License, Multi-User License (Up to 5 Users), Corporate Use License (Unlimited Users and Printable PDF) |





































