Quick Navigation
- Report Overview
- Key Takeaways
- Product Type Analysis
- Modality Analysis
- Technology Analysis
- Application Analysis
- End-user Analysis
- Key Market Segments
- Regional Analysis
- Key Regions and Countries
- Market Dynamics
- Drivers
- Restraints
- Challenges
- Opportunities
- Key Company Insights
- Recent Developments
- Geopolitical Impact Analysis
- Report Scope
Report Overview
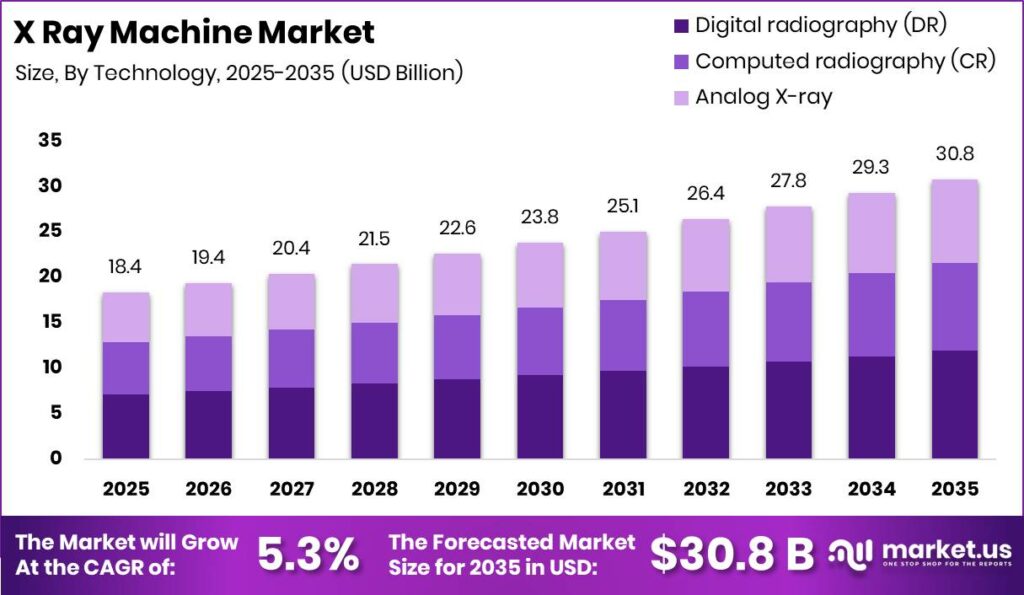
Global X Ray Machine Market size is expected to be worth around USD 30.80 Billion by 2035 from USD 18.40 Billion in 2025, growing at a CAGR of 5.3% during the forecast period 2026 to 2035. This expansion reflects sustained capital spending on diagnostic hardware across hospitals and outpatient sites. Investors who track replacement cycles can time capacity additions before peak order windows close.
Therefore, the X Ray Machine Market covers systems that generate diagnostic or inspection images using controlled X-ray beams. The structure spans medical devices, security scanners, diffraction units, and fluorescence systems. Buyers select modality, technology, and application fit before locking multi-year service contracts.
Key Takeaways
- The market reaches USD 18.40 Billion in 2025 and USD 30.80 Billion by 2035 at a 5.3% CAGR.
- Medical X-ray devices lead product type with a 71.9% share.
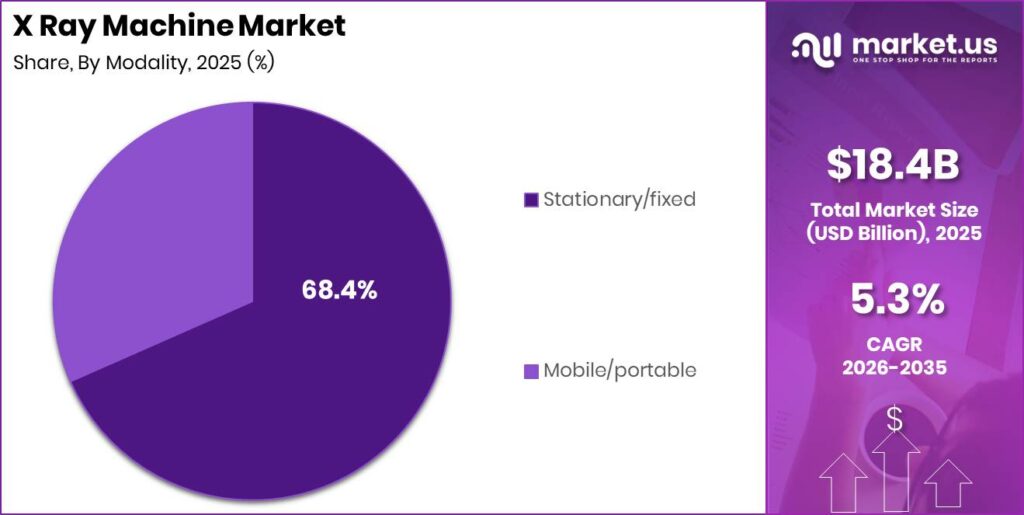
- Stationary/fixed systems lead modality with a 68.4% share.
- Digital radiography leads technology with a 38.7% share.
- Orthopedic imaging leads application with a 30.0% share.
- Hospitals lead end-user demand with a 55.3% share.
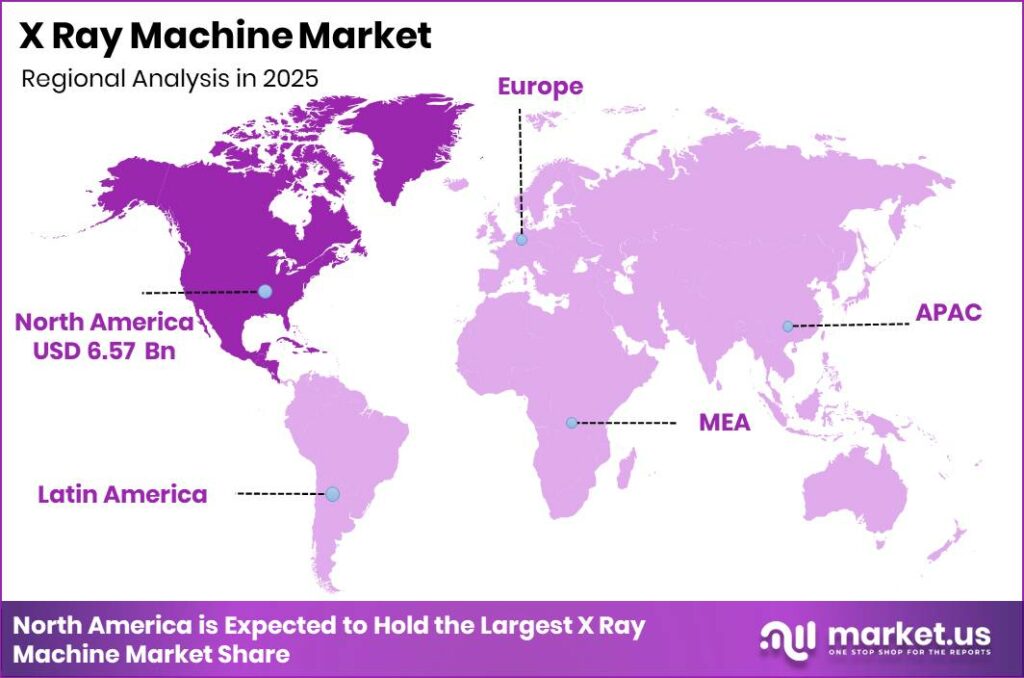
- North America anchors early digital conversion and portable unit uptake among major regions.
Government capital programs and radiation-safety rules shape replacement timing for analog fleets in large hospital networks. Public tenders that set detector matrix and dose floors force vendors to meet minimum digital performance before bid award. This means OEMs that pre-certify detectors against tender baselines win multi-site framework deals faster than late certifiers.
As per our research, a 2025 Amadeo P-90 portable generator supports up to 300 exposures on one full battery charge. That off-grid capacity cuts generator swaps during ward rounds. Facilities that specify high-exposure batteries reduce downtime risk in surge wards and mobile outreach fleets.
Consequently, the same 2025 portable generator lists a maximum charging time of 180 minutes to restore full capacity. Shorter recharge windows raise daily patient throughput on shared mobile units. Buyers who score vendors on charge-to-exposure ratios protect shift productivity when fleets stay small.
Product Type Analysis
Medical X-ray devices dominates with 71.9% due to hospital diagnostic volume concentration.
In 2025, Medical X-ray devices held a dominant market position in the By Product Type segment of X Ray Machine Market, with a 71.9% share. WHO guidance frames roughly one X-ray unit per 50,000 people as a planning benchmark for basic imaging access. This density target keeps hospital and clinic procurement centered on medical units. Suppliers who align catalogs to clinical workflows capture the largest installed-base refresh budgets.
Security X-ray devices serve checkpoints, cargo lanes, and facility screening where threat detection speed sets purchase criteria. Customs and aviation operators prioritize tunnel size, dual-energy discrimination, and continuous duty cycles over clinical image aesthetics. Vendors who certify systems for high-throughput lanes lock multi-year security framework contracts. This creates stable aftermarket revenue outside hospital capital cycles.
X-ray diffraction systems support materials science, pharmaceuticals, and quality labs that need crystal and phase data. A 2025 portable handheld clinical-style unit spans 50–80 kV, 1–5 mA, and 0.03–2.00 second exposures with a 0.8 mm focal spot and 8,000 J heat storage. Lab buyers who need portable verification tools favor compact generators with documented heat limits. Diffraction and fluorescence niches reward specialists who pair sources with application software.
X-ray fluorescence systems measure elemental composition for metals, mining, and compliance testing. Industrial buyers value calibration stability and alloy libraries more than radiographic contrast. Suppliers who bundle standards and field service win repeat consumable and recalibration spend. Security X-ray devices, diffraction systems, and fluorescence systems together hold the remaining product share collectively.
Modality Analysis
Stationary/fixed dominates with 68.4% due to high-volume room throughput needs.
In 2025, Stationary/fixed held a dominant market position in the By Modality segment of X Ray Machine Market, with a 68.4% share. Fixed rooms support continuous caseloads where ceiling suspensions and Bucky systems raise technologist speed. ASRT 2025 staffing data show radiography vacancy near 15.6%, so sites favor layouts that cut repositioning time. Hospitals that standardize fixed rooms protect volume when labor remains tight.
Mobile/portable systems extend imaging to bedsides, ICUs, and field sites where patient transport raises risk. A 2025 portable handheld specification reports more than 100 images per battery charge and roughly 1.5 to 2.0 hours recharge. That duty cycle supports ward rounds without constant dock returns. In November 2025, Canon Medical Systems launched the MOBIREX i9 Smart Edition with CXDI-Elite detectors and Built-in AEC Assistance for bedside exposure control. Fleets that adopt assisted mobile units reduce retakes and free scarce technologists.
Technology Analysis
Digital radiography (DR) dominates with 38.7% due to faster flat-panel workflow gains.
In 2025, Digital radiography (DR) held a dominant market position in the By Technology segment of X Ray Machine Market, with a 38.7% share. A December 2025 Indian Institute of Science tender required 2 flat-panel detectors of at least 17 × 17 inches and an image matrix of at least 3.0k × 3.0k pixels. Those floors push buyers toward modern DR panels rather than film or plate workflows. OEMs that stock dual large-format detectors win public and academic bids faster.
Computed radiography (CR) remains a bridge for sites that still run cassette-based readers while planning full DR rooms. CR keeps some capital outlay lower yet adds plate handling steps that slow peak hours. Facilities that stage CR-to-DR swaps protect budgets without freezing diagnostic capacity. Vendors who offer trade-in paths convert CR users before competitors do.
Analog X-ray systems persist in cost-sensitive or low-volume settings where film chemistry still meets basic needs. Analog lines face rising parts scarcity and tighter dose documentation rules. Buyers who delay digital conversion accept higher long-run service risk. Suppliers of retrofit DR kits monetize that pressure through stepwise upgrades.
Application Analysis
Orthopedic imaging dominates with 30.0% due to high musculoskeletal case frequency.
In 2025, Orthopedic imaging held a dominant market position in the By Application segment of X Ray Machine Market, with a 30.0% share. Trauma and elective bone work drive repeat views that favor reliable detectors and grid options. World Bank–cited analysis notes about USD 3 in hospital cost savings per USD 1 spent on timely medical imaging. Orthopedic pathways that confirm alignment quickly cut rework and length of stay. Vendors who optimize extremity and spine protocols win orthopedic service-line deals.
Chest and respiratory imaging is the fastest-growing application as infection, chronic lung disease, and triage protocols raise daily film counts. Portable chest work at the bedside multiplies detector wireless demand. Suppliers who tune noise and dose presets for lung fields gain share in emergency and ICU carts. Growth here rewards mobile-ready DR packages over room-only quotes.
Cardiovascular imaging needs higher temporal control and specialized projections for device and vessel work. Dental imaging concentrates on compact intraoral and panoramic geometries with tight focal-spot control. Mammography and other specialty lines require dedicated detectors and compression workflows. Cardiovascular, dental, and mammography with other uses together hold the remaining application share collectively.
End-user Analysis
Hospitals dominates with 55.3% due to multi-specialty imaging throughput scale.
In 2025, Hospitals held a dominant market position in the By End-user segment of X Ray Machine Market, with a 55.3% share. Hospitals bundle emergency, inpatient, and surgical imaging under single capital plans. ASRT 2025 data place radiography vacancies near 15.6%, so large campuses buy systems that automate positioning and exposure. Vendors who attach training and remote service raise win rates in hospital RFPs.
Diagnostic imaging centers compete on appointment speed and referral convenience for outpatient studies. These sites favor high-uptime DR rooms with lean staffing models. Chains that standardize detectors across locations cut training time and spare-parts variety. Suppliers who offer multi-site service SLAs lock center networks for full refresh cycles.
Ambulatory surgical centers need compact systems that clear preoperative and postoperative views without hospital transfer. Research settings and other users prioritize flexible protocols, open interfaces, and tender-grade detector specs. ASC and research buyers still influence niche SKUs even at lower volume. Diagnostic centers, ASCs, and research with others together hold the remaining end-user share collectively.
Key Market Segments
By Product Type
- Medical X-ray devices
- Security X-ray devices
- X-ray diffraction systems
- X-ray fluorescence systems
By Modality
- Stationary/fixed
- Mobile/portable
By Technology
- Digital radiography (DR)
- Computed radiography (CR)
- Analog X-ray
By Application
- Orthopedic imaging
- Chest / respiratory
- Cardiovascular
- Dental imaging
- Mammography & others
By End-user
- Hospitals
- Diagnostic imaging centers
- Ambulatory surgical centers
- Research & others
Regional Analysis
North America anchors digital conversion and portable adoption across the X Ray Machine Market
North America leads early replacement of analog and CR rooms with flat-panel digital systems. Driver analysis ties the strongest near-term pull to North America and Western Europe on digital conversion. Hospital groups there also scale point-of-care portable fleets for bedside work. Vendors who hold FDA-ready wireless detectors and service density defend premium ASPs in this region.
Asia Pacific shows the fastest structural expansion through outpatient center growth and portable unit uptake. Tender language in markets such as India now hard-codes dual large-format detectors and high matrix sizes. That standard lifts average selling content per room. Suppliers who localize service and financing gain share as tier-2 cities add capacity.
Europe balances strict radiation certification with steady installed-base upgrades in public systems. Latin America and Middle East and Africa lean toward cost-sensitive fixed rooms and selective mobile units. Regional financing costs and certification timelines still shape order timing. Global players who tier product lines by region protect volume without uniform discounting.
Key Regions and Countries
North America
- US
- Canada
Europe
- Germany
- France
- The UK
- Spain
- Italy
- Rest of Europe
Asia Pacific
- China
- Japan
- South Korea
- India
- Australia
- Rest of APAC
Latin America
- Brazil
- Mexico
- Rest of Latin America
Middle East and Africa
- GCC
- South Africa
- Rest of MEA
Market Dynamics
Market Opportunity Analysis - Mobile, AI retrofit, and tier-2 sites still leave open entry lanes.
Mobile and portable modality remains underexploited relative to stationary room dominance at 68.4%. Many hospitals still under-index bedside fleets despite ICU and isolation demand. New entrants that ship long-battery wireless detectors can win replacement carts without displacing fixed rooms. This path lowers capital friction versus full radiography suite bids.
Chest and respiratory applications grow fastest yet trail orthopedic share leadership at 30.0%. Protocol packages tuned for lung triage on portable DR can take share in emergency pathways. Investors who fund clinical validation in respiratory workflows gain a clearer wedge than broad general-radiography claims. Early movers lock group purchasing interest before incumbents retune defaults.
Asia Pacific outpatient and tier-2 expansion still lags mature digital penetration in North America. Tender-driven detector specs raise the floor for credible bidders but leave financing gaps. Leasing and refurbished channels can unlock buyers blocked by full DR list prices. Regional specialists who pair local service with tiered hardware capture volume incumbents discount late.
AI software attach on the installed digital fleet stays far below hardware saturation. Most sites still run detectors without licensed triage seats. Independent software vendors that certify across major detector brands can monetize retrofit seats faster than hardware-only OEMs. This creates a capital-light entry route beside traditional system sales.
Technology and Innovation Landscape - Detector physics, AEC automation, and portable power redefine specs.
Canon CXDI-Elite detectors deliver a 16% improvement in detective quantum efficiency at 0.5 lp/mm versus prior models. Higher DQE supports dose-efficient protocols without sacrificing read confidence. Hospitals under dose audits favor panels that prove efficiency gains in acceptance tests. Detector suppliers who publish DQE curves win technical scoring rounds.
The same Canon series posts a 29% improvement in modulation transfer function at 2 lp/mm. Stronger MTF improves fine-detail transfer for bone and device edges. Orthopedic and interventional users pay for visible sharpness in daily reads. OEMs that pair MTF gains with stable calibration reduce retake rates and film-critique disputes.
A December 2025 IISc tender set detector DQE of at least 68% at 0.05 lp/mm and spatial resolution of at least 3.5 lp/mm. Pixel size limits of 140 microns or less and 16-bit conversion further raise the bar. Public buyers now encode research-grade floors into standard RFPs. Vendors below those thresholds exit shortlists before price talks begin.
Automatic exposure control using 5 or 9 regions of interest links detectors to generators over wired or wireless links. Assisted exposure cuts technologist variance when vacancy rates stay elevated. Portable power designs that sustain high exposure counts per charge keep mobile programs viable. Manufacturers who integrate AEC, wireless, and battery metrics into one cart specification set the new competitive baseline.
Drivers
Analog-to-digital radiography conversion supplies the largest near-term lift to baseline growth. Digital systems already represent roughly 70% of new unit shipments by 2025 per industry shipment signals cited in manufacturer decks. Panel yield gains compress detector costs about 8% to 10% year over year. AI post-processing attach lifts gross margins by an estimated 3 to 5 percentage points per system.
This combination turns a technology swap into about 1.4 percentage points of the 5.3% CAGR. Rising chronic disease and trauma volumes add further unit demand worldwide. Portable point-of-care adoption and outpatient center expansion reinforce short- and medium-term orders. Buyers who budget software-ready DR rooms capture workflow gains before peers finish analog run-off.
| Driver | (~) % Impact on CAGR Forecast | Geographic Relevance | Impact Timeline |
|---|---|---|---|
| Analog to Digital Radiography Conversion | +1.4% | Global, led by North America and Western Europe | Short term (2 years or less) |
| Rising Chronic Disease and Trauma Case Volumes | +1.1% | Global | Short term (2 years or less) |
| Point-of-Care Portable Unit Adoption | +0.8% | North America, Asia Pacific | Short term (2 years or less) |
| Flat Panel Detector Cost Declines | +0.6% | Global | Medium term (2 to 4 years) |
| Outpatient Imaging Center Expansion | +0.5% | North America, Asia Pacific | Medium term (2 to 4 years) |
Restraints
US-China tariff escalation is the sharpest near-term brake on component-heavy X-ray builds. Duties moved from a blanket 10% on US imports toward a 145% tariff on Chinese-origin goods under published schedules. Landed costs for tubes and detector modules rise an estimated 15% to 25% per unit. OEMs absorb roughly 2 to 4 percentage points of margin or pass cost to hospitals.
As a result, large health systems defer replacement cycles by about 6 to 9 months in capital surveys. High system prices still limit uptake in emerging markets across South Asia and Africa. Elevated borrowing rates tighten hospital CapEx globally. Certification delays in the United States and European Union stretch launch calendars for new configurations.
| Restraint | (~) % Impact on CAGR Forecast | Geographic Relevance | Impact Timeline |
|---|---|---|---|
| US-China Tariff Escalation on Imaging Components | -1.2% | North America, China | Short term (2 years or less) |
| High Capital Cost of Advanced Systems | -0.7% | Emerging markets, South Asia, Africa | Short term (2 years or less) |
| Elevated Hospital Borrowing Rates | -0.5% | Global, acute in high-rate economies | Short term (2 years or less) |
| Stringent Radiation Safety Certification Delays | -0.4% | United States, European Union | Short term (2 years or less) |
Challenges
Radiology technician shortages create lasting friction even when hardware budgets remain open. ARRT-linked vacancy signals near 12% to 15% across diagnostic imaging in 2025 to 2026. Hospitals extend utilization queues by an estimated 20% to 30% in wait times. Throughput caps limit how fast new rooms convert into billed exams.
This challenge opens service revenue for OEMs that sell remote diagnostics and tele-radiography tools. Training academies and assisted-positioning software can add about 3 to 6 percentage points of recurring margin uplift over time. Detector supply fragility and fragmented regional approvals still slow global rollouts. Legacy IT gaps in emerging markets stretch integration timelines beyond four years for some buyers.
| Challenge | (~) % CAGR Friction Drag | Geographic Relevance | Mitigation Horizon |
|---|---|---|---|
| Radiology Technician Talent Shortage | -0.6% | North America, Western Europe | Medium term (2 to 4 years) |
| Detector Component Supply Chain Fragility | -0.5% | Global | Medium term (2 to 4 years) |
| Fragmented Regional Regulatory Approval Cycles | -0.4% | Global, acute in Latin America and Southeast Asia | Medium term (2 to 4 years) |
| Legacy IT Interoperability Gaps | -0.3% | Emerging markets | Long term (4 years or more) |
Opportunities
AI-diagnostics software sold as a retrofit subscription is the largest upside layer above hardware growth. Fewer than an estimated 15% to 20% of installed digital X-ray units run licensed AI triage software today. Hardware margins near 25% to 30% can blend toward 60% to 70% recurring software margins per seat. Early clinical deployments cite throughput gains of 20% to 40% per site.
Capturing this layer could add about 1.5 percentage points above the 5.3% baseline if retrofit architecture ships at scale. Rural and tier-2 penetration across India, Southeast Asia, and Sub-Saharan Africa adds further unit white space. Veterinary and industrial NDT adjacencies diversify demand beyond human diagnostics. Refurbished and leasing models unlock Latin America and Africa buyers blocked by full list prices.
| Opportunity | (~) % Potential CAGR Upside | Geographic Relevance | Execution Window |
|---|---|---|---|
| AI-Diagnostics Software Monetization Layer | +1.5% | Global | Medium term (2 to 4 years) |
| Rural and Tier-2 Market Penetration | +1.0% | India, Southeast Asia, Sub-Saharan Africa | Medium term (2 to 4 years) |
| Veterinary and Industrial NDT Adjacent Verticals | +0.6% | Global | Long term (4 years or more) |
| Refurbished and Leasing Model Roll-Ups | +0.5% | Latin America, Africa | Long term (4 years or more) |
Key Company Insights
Siemens Healthineers positions across premium fixed rooms and integrated radiology workflows that lock multi-department hospital accounts. Deep service density and software attach raise switching costs for large health systems. This approach defends margin when tariff pressure hits component-heavy builds. Competitors without equal service coverage struggle to displace installed Siemens fleets on uptime SLAs alone.
GE Healthcare strengthens enterprise imaging software after its November 2025 agreement to acquire Intelerad Medical Systems for USD 2.3 billion. That move ties X-ray hardware more tightly to reading and workflow platforms. Integrated software raises account stickiness beyond detector swaps. Rivals that sell hardware without comparable enterprise software risk longer sales cycles in consolidated hospital networks.
Key Players
- Siemens Healthineers
- GE Healthcare
- Koninklijke Philips
- Canon Inc.
- FUJIFILM Holdings Corporation
- Shimadzu Corporation
- Carestream Health Inc.
- Agfa-Gevaert Group
- Varex Imaging Corporation
- Hitachi, Ltd.
- Hologic, Inc.
- MinXray Inc.
- Konica Minolta
- Envista Holdings Corporation
- Vieworks Co., Ltd.
Recent Developments
- November 2025: Shimadzu Corporation launched the MobileDaRt Evolution MX9 Premium mobile X-ray system with upgraded camera-assisted positioning, enhanced wireless detector integration, and bedside workflow improvements.
- July 2025: Canon Medical Systems introduced the RADREX i5 Flex Edition digital radiography system with AI-assisted positioning, automated workflow functions, and enhanced imaging performance for general X-ray exams.
- December 2025: Philips announced the acquisition of SpectraWAVE, expanding image-guided therapy with intravascular imaging that complements its diagnostic imaging portfolio including X-ray systems.
Geopolitical Impact Analysis
Figures from US tariff schedules show duties escalating from a blanket 10% import levy toward a 145% rate on Chinese-origin goods in 2025. X-ray tube assemblies and flat-panel modules sourced from China face direct landed-cost shocks. Manufacturer commentary ties component cost inflation near 15% to 25% per unit. This means hospital CapEx committees delay detector refresh orders when quotes reprice mid-cycle.
Data from trade and policy trackers show medical device tariffs spanning about 10% to 50% by origin in 2025 reviews. WTO frameworks treat many medicines preferentially, yet devices remain exposed to broad industrial duties. Supply chains reroute tube and panel subassemblies toward higher-cost nodes, stretching lead times. Therefore, OEMs dual-source critical parts or absorb margin hits near 2 to 4 percentage points to keep list prices workable.
Report Scope
| Report Features | Description |
|---|---|
| Market Value (2025) | USD 18.40 Billion |
| Forecast Revenue (2035) | USD 30.80 Billion |
| CAGR (2026-2035) | 5.3% |
| Base Year for Estimation | 2025 |
| Historic Period | 2020-2024 |
| Forecast Period | 2026-2035 |
| Report Coverage | Revenue Forecast, Market Dynamics, Market Opportunity Analysis, Technology and Innovation Landscape, Competitive Landscape, Recent Developments |
| Segments Covered | By Product Type (Medical X-ray devices, Security X-ray devices, X-ray diffraction systems, X-ray fluorescence systems), By Modality (Stationary/fixed, Mobile/portable), By Technology (Digital radiography (DR), Computed radiography (CR), Analog X-ray), By Application (Orthopedic imaging, Chest / respiratory, Cardiovascular, Dental imaging, Mammography & others), By End-user (Hospitals, Diagnostic imaging centers, Ambulatory surgical centers, Research & others) |
| Regional Analysis | North America (US and Canada), Europe (Germany, France, The UK, Spain, Italy, and Rest of Europe), Asia Pacific (China, Japan, South Korea, India, Australia, and Rest of APAC), Latin America (Brazil, Mexico, and Rest of Latin America), Middle East and Africa (GCC, South Africa, and Rest of MEA) |
| Competitive Landscape | Siemens Healthineers, GE Healthcare, Koninklijke Philips, Canon Inc., FUJIFILM Holdings Corporation, Shimadzu Corporation, Carestream Health Inc., Agfa-Gevaert Group, Varex Imaging Corporation, Hitachi, Ltd., Hologic, Inc., MinXray Inc., Konica Minolta, Envista Holdings Corporation, Vieworks Co., Ltd. |
| Customization Scope | Customization for segments, region / country-level will be provided. Additional customization can be done based on requirements. |
| Purchase Options | We have three licenses to opt for: Single User License | Multi-User License (Up to 5 Users) | Corporate Use License (Unlimited User and Printable PDF) |