Quick Navigation
- Report Overview
- Key Takeaways
- LiDAR Type Analysis
- Method Analysis
- Laser Wavelength Analysis
- Vehicle Type Analysis
- Level of Autonomy Analysis
- Application Analysis
- Key Market Segments
- Regional Analysis
- Key Regions and Countries
- Market Dynamics
- Drivers
- Restraints
- Challenges
- Opportunities
- Key Company Insights
- Recent Developments
- Geopolitical Impact Analysis
- Report Scope
Report Overview
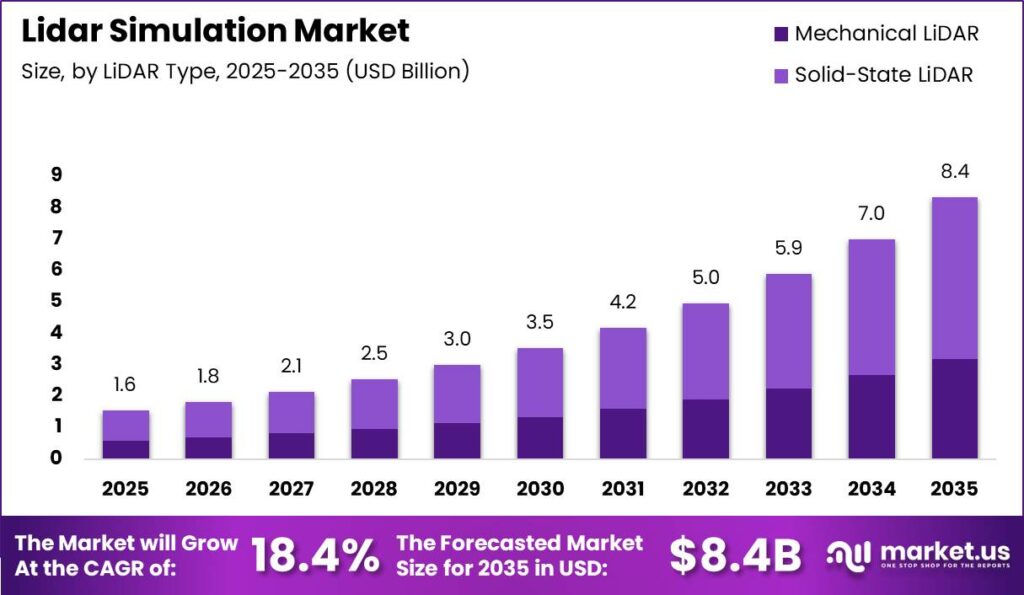
Global Lidar Simulation Market size is expected to be worth around USD 8.40 Billion by 2035 from USD 1.60 Billion in 2025, growing at a CAGR of 18.4% during the forecast period 2026 to 2035. Software platforms generate synthetic point clouds that stand in for physical laser returns. Buyers use these tools to validate perception stacks before track or road miles begin.
Therefore, the market covers sensor models, scenario libraries, and validation workflows for autonomy programs. Solid-state and mechanical sensor digital twins sit beside testing and pure simulation methods. Wavelength, vehicle class, autonomy level, and end use shape purchasing decisions across OEM and Tier-1 teams.
Key Takeaways
- The market reaches USD 1.60 Billion in 2025 and USD 8.40 Billion by 2035 at a CAGR of 18.4%.
- Solid-State LiDAR leads By LiDAR Type with a 62.00% share.
- Testing Method leads By Method with a 54.00% share.
- Short-Wave Infrared Spectrum leads By Laser Wavelength with a 76.00% share.
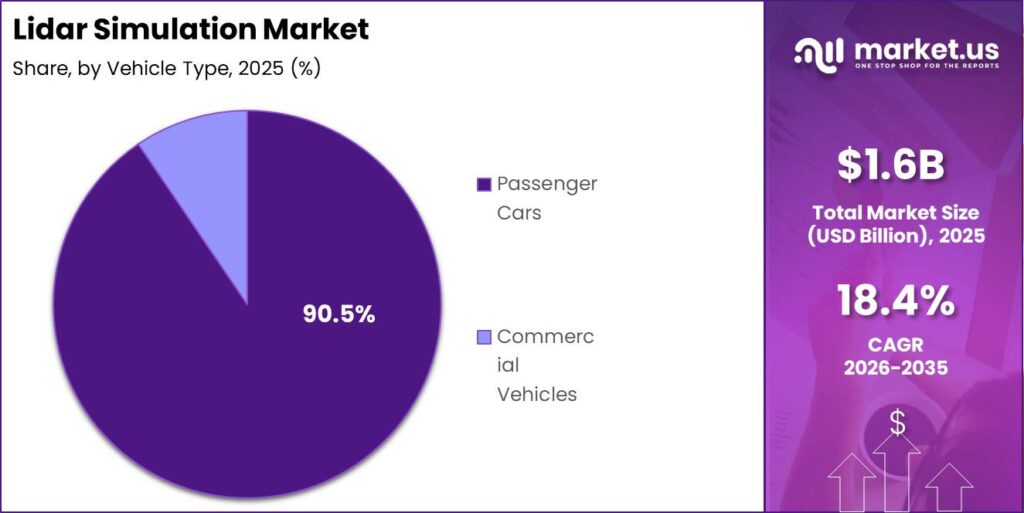
- Passenger Cars lead By Vehicle Type with a 90.50% share.
- Level 2 leads By Level of Autonomy with a 43.00% share.
- Advanced Driver-Assistance Systems lead By Application with a 49.10% share.
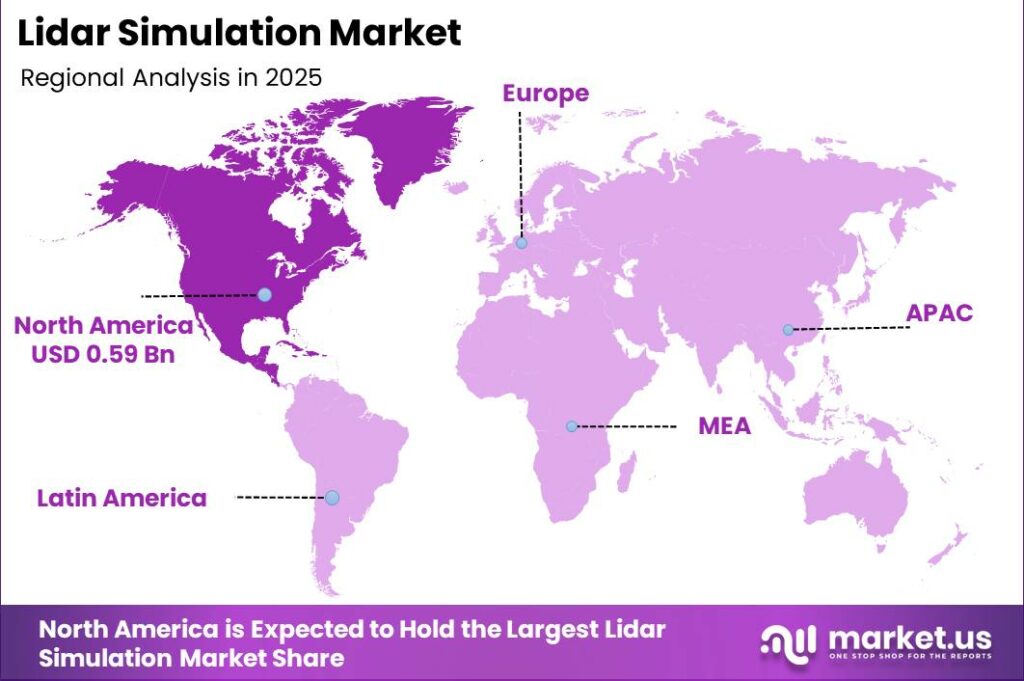
- North America leads with a 38.20% share valued at USD 0.59 Billion.
As per our research, high-fidelity platforms can generate millions of scenario variations before any public-road deployment. This scale cuts physical track spend and shortens homologation calendars. OEMs that lock multi-year scenario subscriptions protect validation throughput against proving-ground bottlenecks. In March 2025, NVIDIA launched Omniverse and Cosmos blueprints that generate controllable synthetic sensor data from LiDAR scans and depth maps for vehicle training.
Consequently, figures from Waymo show nearly 200 million fully autonomous miles alongside virtual environments covering billions of simulated miles. That mix proves regulators and insurers will accept synthetic evidence when fidelity is documented. Suppliers who pair certified scenario libraries with audit trails win preferred-vendor status on Level 3 and Level 4 programs through 2030.
LiDAR Type Analysis
Solid-State LiDAR dominates with 62.00% due to compact no-moving-part sensor designs.
In 2025, Solid-State LiDAR held a dominant market position in the By LiDAR Type segment of Lidar Simulation Market, with a 62.00% share. CARLA hybrid solid-state configurations support 128 channels, 10 Hz rotation frequency, and a 120° horizontal field of view. This fidelity lets suppliers validate dense near-field returns without spinning hardware. Vendors who ship calibrated solid-state digital twins first capture OEM design-win cycles.
Mechanical LiDAR remains essential for long-range highway coverage and full surround mapping. CARLA mechanical setups support 32 laser channels, 56,000 points per second, 10 Hz frequency, and a 360° horizontal field of view. This breadth still anchors robotaxi and mapping fleets that need complete azimuth coverage. Simulation vendors who maintain accurate multipath and beam-divergence models retain this high-value niche.
Method Analysis
Testing Method dominates with 54.00% due to closed-course and mixed validation demand.
In 2025, Testing Method held a dominant market position in the By Method segment of Lidar Simulation Market, with a 54.00% share. Automated pipelines now export synchronized LiDAR, image, and depth sets across 3 formats including PCD, PLY, and CSV. This structure speeds lab-to-track correlation for perception teams. Suppliers who certify format interoperability reduce customer integration cost and win multi-site contracts.
Simulation Method scales scenario volume far beyond physical tracks and weather constraints. Waymo-style programs pair hundreds of millions of real miles with billions of virtual miles for edge-case coverage. This means pure software miles become the economic backbone of Level 3 and Level 4 safety cases. Platform vendors that price by scenario pack rather than seat license expand addressable mid-market fleets.
In September 2025, RoboSense integrated E1, EMX, and EM4 automotive LiDAR models with the NVIDIA DRIVE AGX platform for development, testing, and simulation workflows. Hardware-in-the-loop links tighten the loop between sensor firmware and synthetic scenes. Buyers gain faster regression cycles when physical units and virtual twins share one toolchain.
Laser Wavelength Analysis
Short-Wave Infrared Spectrum dominates with 76.00% due to eye-safe automotive sensor prevalence.
In 2025, Short-Wave Infrared Spectrum held a dominant market position in the By Laser Wavelength segment of Lidar Simulation Market, with a 76.00% share. IEA data show electric car sales expected to exceed 20 million units in 2025, equal to roughly one-quarter of global car sales. SWIR-capable stacks ride that volume into mass ADAS programs. Simulation vendors who model 905 nm and 1550 nm atmospheric loss win default positions on OEM RFQs.
Long-Wave Infrared Spectrum supports specialized ranging and adverse-weather research programs. Physics-based studies now calibrate beam patterns at 0.01° measurement resolution for accurate replication. This precision matters when buyers compare competing sensor bills of materials. Tool providers who expose wavelength-specific noise and attenuation controls differentiate on engineering depth.
Vehicle Type Analysis
Passenger Cars dominate with 90.50% due to high-volume ADAS fitment rates.
In 2025, Passenger Cars held a dominant market position in the By Vehicle Type segment of Lidar Simulation Market, with a 90.50% share. Global electric car sales are set to top 20 million in 2025 with about 25% year-on-year growth. That production scale multiplies demand for virtual sensor sign-off before launch. Simulation suppliers aligned to passenger OEM program gates capture the largest recurring license pools.
Commercial Vehicles require longer-range models, heavier payload dynamics, and depot-to-highway scenario packs. Fleet operators still lag passenger OEMs on mandatory validation thresholds in many markets. This creates room for lighter cloud simulation tiers aimed at logistics and coach builders. Vendors who package duty-cycle libraries for trucks unlock a second growth lane without diluting car-focused products.
Level of Autonomy Analysis
Level 2 dominates with 43.00% due to widespread hands-on ADAS production volume.
In 2025, Level 2 held a dominant market position in the By Level of Autonomy segment of Lidar Simulation Market, with a 43.00% share. UNECE R157 type-approval paths for higher automation still require virtual scenario batteries plus track and road tests. Level 2 programs therefore absorb the bulk of current simulation seats. Tool vendors who map features to R157 annex tests shorten customer compliance work.
Level 1 systems use simpler single-function aids and lighter synthetic coverage. Level 3 Automated Lane Keeping under R157 can run up to 130 km/h on highways with redundancy and object-detection mandates. This raises scenario-library size into tens of thousands of permutations. Suppliers with pre-built R157 packs reduce OEM legal and engineering risk.
Level 4 and Level 5 programs push domain transfer and compute limits hardest. Open requisitions for senior simulation validation talent often run 3 to 4 months per labor statistics patterns cited in sector surveys. This signals sustained pricing power for platforms that embed guided workflows and reduce specialist headcount need. Remaining share sits across Level 1, Level 3, Level 4, and Level 5 collectively.
Application Analysis
Advanced Driver-Assistance Systems dominate with 49.10% due to series-production safety feature rollouts.
In 2025, Advanced Driver-Assistance Systems held a dominant market position in the By Application segment of Lidar Simulation Market, with a 49.10% share. The GOOSE 3D semantic segmentation challenge reported LiDAR point-cloud methods lifting mIoU by up to 22.59% versus baseline. Better labels raise trust in synthetic training sets for production ADAS. Vendors who ship labeled scenario packs with measured mIoU gains win perception-team budgets.
Autonomous Driving applications demand full-stack ODD coverage and regulatory evidence packs. Robotaxi operators already blend vast real miles with orders-of-magnitude more simulated miles. This reflects a permanent shift of safety-case economics toward software. Simulation firms that offer auditable scenario provenance become infrastructure, not optional tools.
Robotic Vehicles and Other Applications cover industrial, campus, and specialty platforms with unique sensor mounts. These niches accept lighter fidelity if integration is fast and cost is low. Cloud consumption pricing fits their smaller engineering teams. Remaining share rests with Robotic Vehicles and Other Applications as a combined long-tail opportunity.
Key Market Segments
By LiDAR Type
- Mechanical LiDAR
- Solid-State LiDAR
By Method
- Testing Method
- Simulation Method
By Laser Wavelength
- Short-Wave Infrared Spectrum
- Long-Wave Infrared Spectrum
By Vehicle Type
- Passenger Cars
- Commercial Vehicles
By Level of Autonomy
- Level 1
- Level 2
- Level 3
- Level 4
- Level 5
By Application
- Advanced Driver-Assistance Systems
- Autonomous Driving
- Robotic Vehicles
- Other Applications
Regional Analysis
North America Dominates the Lidar Simulation Market with a Market Share of 38.20%, Valued at USD 0.59 Billion
North America concentrates OEM software validation spend, robotaxi miles, and hyperscale GPU capacity for synthetic sensor generation. The 38.20% share and USD 0.59 Billion value in 2025 show deep enterprise licensing penetration. In October 2025, NVIDIA released an autonomous-vehicle simulation workflow combining Omniverse neural reconstruction and Cosmos models for synthetic camera, radar, and LiDAR data. Regional buyers gain faster reconstruction of real routes into trainable worlds.
Asia Pacific posts the fastest structural upside through China NCAP 2026 ADAS scoring and large domestic EV volumes. Electric car sales growth above 20 million global units in 2025 concentrates heavily in East Asia production hubs. This creates urgent demand for local-language scenario packs and export-compliant codebases. Vendors who localize sensor models for Chinese and Korean OEMs capture share faster than pure Western suites.
Europe follows with UNECE R157 type-approval pressure that forces virtual edge-case libraries into every Level 3 program. Simulated miles cost roughly 85% to 90% less than closed-course miles in transport ministry benchmarks. As a result, European Tier-1 budgets tilt toward recurring scenario subscriptions through at least 2028. Latin America and Middle East and Africa remain earlier in the adoption curve with selective fleet pilots.
Key Regions and Countries
North America
- US
- Canada
Europe
- Germany
- France
- The UK
- Spain
- Italy
- Rest of Europe
Asia Pacific
- China
- Japan
- South Korea
- India
- Australia
- Rest of APAC
Latin America
- Brazil
- Mexico
- Rest of Latin America
Middle East and Africa
- GCC
- South Africa
- Rest of MEA
Market Dynamics
Market Opportunity Analysis - Cloud tiers, commercial vehicles, and lower autonomy adjacent packs remain open entry points
Commercial Vehicles hold far less share than the 90.50% passenger-car lead, yet logistics fleets need longer-range synthetic ODDs. Most scenario libraries still optimize for car geometry and highway ADAS. New entrants who ship truck and coach packs with depot and highway mixes face lighter incumbent lock-in. Early movers can price on consumption and win regional fleet operators first.
Simulation Method sits behind Testing Method at 54.00%, leaving pure virtual scale under-monetized outside top OEMs. SME and Tier-2 buyers still face high seat costs. Cloud-native packs that bill per scenario open that white space without proving-ground CapEx. This creates a second product line that does not cannibalize enterprise on-premise deals.
Level 3 through Level 5 together trail Level 2 at 43.00%, but R157-style rules raise library size sharply. Vendors who pre-certify edge-case batteries for Automated Lane Keeping sell compliance, not only software. Investors gain clearer attach rates when regulation forces scenario count upward. By contrast, Level 1 remains a thin upsell for basic single-function aids.
Latin America and Middle East and Africa lack the North America 38.20% concentration and still run selective pilots. Localized weather, road-marking, and traffic-behavior packs are scarce. Regional specialists can partner with global engines rather than rebuild renderers. This means faster go-to-market with content differentiation instead of full-stack R&D.
Technology and Innovation Landscape - Faster rendering, tighter sensor physics, and generative 4D scenes redefine fidelity
SimULi, a 2025 real-time LiDAR and camera method, achieved rendering 10 to 20 times faster than ray tracing and 1.5 to 10 times faster than prior rasterization while holding fidelity. Speed lets teams iterate nightly instead of weekly. Platform owners who adopt similar pipelines cut GPU cost per scenario and expand cloud margins.
The same work cut mean camera and depth errors by up to 40% versus earlier LiDAR-camera simulation approaches. Lower error shrinks the sim-to-real gap that slows safety cases. Buyers will prefer vendors who publish error budgets beside feature lists. This signals a shift from visual demo quality to measurable perception metrics.
Physically based automotive studies now calibrate models with laboratory beam-pattern resolution of 0.01°. That precision anchors multipath and divergence behavior buyers trust in homologation files. Suppliers without lab-tied calibration lose RFQs on high-stakes Level 3 programs. Hardware LiDAR makers gain influence when their measured profiles ship inside digital twins.
LidarDM research generated 4D LiDAR point-cloud sequences with temporal consistency for driving simulation. Time-consistent clouds improve tracking and prediction training. Vendors who productize generative 4D feeds open synthetic data licensing beyond internal OEM use. Investors see a path to marketplace revenue on top of seat licenses.
Drivers
UNECE R157 since 2022, with 2024 and 2025 amendments, forces OEMs seeking Level 3 Automated Lane Keeping approval to prove edge-case coverage physical tracks cannot fund. Type-approval bodies expect scenario libraries in the tens of thousands of permutations. Simulated test miles cost roughly 85% to 90% less than closed-course miles per U.S. DOT Volpe Center referenced benchmarks. Software validation licenses carry gross margins 15 to 20 points above hardware-linked services, pulling OEM budgets into multi-year commitments through 2028.
| Driver | (~) % Impact on CAGR Forecast | Geographic Relevance | Impact Timeline |
|---|---|---|---|
| UNECE R157 Type-Approval Validation Mandates | +3.2% | Europe, East Asia | Short term (2 years or less) |
| Shift from Physical Track Testing to Virtual Validation | +2.6% | North America, Europe | Short term (2 years or less) |
| OEM SaaS-Based Simulation Licensing Adoption | +2.0% | Global | Medium term (2 to 4 years) |
| Rising Sensor Complexity Requiring Synthetic Point-Cloud Data | +1.5% | North America, East Asia | Medium term (2 to 4 years) |
| China NCAP 2026 ADAS Scoring Criteria | +1.3% | China | Short term (2 years or less) |
| Growth in Robotaxi Fleet Deployment Miles | +1.1% | North America, China | Medium term (2 to 4 years) |
Restraints
Physics-accurate LiDAR models that replicate beam divergence, multipath, and atmospheric loss require multi-year R&D amortization on vendor books. Full-fidelity per-seat suites can absorb 8% to 12% of a mid-sized Tier-1 validation software budget per ASAM-linked benchmarking. U.S. Federal Reserve and European Central Bank rate paths kept SME borrowing above 5.5% through 2026. This freezes discretionary software buys and stretches CapEx sign-off by 6 to 9 months among Tier-2 suppliers.
Smaller simulation vendors discount 10% to 15% to hold contracts, compressing margins while enterprise deals stall. Radar-camera fusion in budget vehicles and export controls on high-fidelity codebases add further drag in emerging and restricted markets. Fragmented homologation rules block single global scenario packs. Buyers delay purchases until interest rates ease or cloud consumption tiers cut upfront cost.
| Restraint | (~) % Impact on CAGR Forecast | Geographic Relevance | Impact Timeline |
|---|---|---|---|
| High Upfront Licensing Cost of Physics-Accurate Sensor Models | -2.4% | Global, acute in emerging markets | Short term (2 years or less) |
| Elevated Interest Rates Delaying OEM Software CapEx | -1.8% | North America, Europe | Short term (2 years or less) |
| Radar-Camera Fusion Substitution in Budget Vehicle Segments | -1.4% | North America, India, Southeast Asia | Short term (2 years or less) |
| Export Control Restrictions on High-Fidelity Simulation Codebases | -1.0% | China, Russia | Short term (2 years or less) |
| Fragmented Regional Homologation Halting Cross-Border Deployment | -0.8% | Global | Short term (2 years or less) |
Challenges
Engineers who master both photonics-level sensor physics and autonomy software remain scarce, as SAE workforce surveys repeatedly note. Open senior simulation validation roles backlog 3 to 4 months per national labor statistics patterns. Compensation for these roles inflates roughly 12% to 18% year over year on supplier earnings commentary. Tier-1 firms now steer an estimated 2% to 3% of engineering headcount budgets into training through 2029.
Sim-to-real gaps, real-time ray-tracing compute limits, training-set leakage, and legacy GIS friction add further drag. Each gap slows certification and raises dual-run costs on track and in software. Vendors who embed guided validation workflows and domain-randomization tools reduce specialist dependency. This creates a services and academy revenue stream beside core licenses for early movers.
| Challenge | (~) % CAGR Friction Drag | Geographic Relevance | Mitigation Horizon |
|---|---|---|---|
| Simulation Fidelity Validation Talent Shortage | -1.6% | North America, Europe | Medium term (2 to 4 years) |
| Sim-to-Real Domain Transfer Gap | -1.3% | Global | Medium term (2 to 4 years) |
| Compute Bottlenecks in Real-Time Ray-Tracing Rendering | -1.1% | North America, East Asia | Medium term (2 to 4 years) |
| Data Leakage Between Training and Validation Sets | -0.7% | Global | Long term (4 years or more) |
| Legacy GIS Incompatibility With Point-Cloud Pipelines | -0.5% | Global, acute in agriculture/infrastructure verticals | Long term (4 years or more) |
Opportunities
Enterprise on-premise licenses still dominate revenue, leaving SME fleets and regional Tier-2 suppliers underserved in logistics and agricultural autonomy. Moving rendering to consumption-based cloud GPUs can cut per-scenario compute cost by an estimated 30% to 40% on list-price benchmarks. Vendor gross margins can expand 8 to 10 points when subscriptions replace perpetual seats, consistent with OECD digital economy patterns. Smaller operators sit below many mandatory validation thresholds, so packaging must lead, not regulation.
Off-highway autonomy, scenario-library roll-ups, smart-infrastructure digital twins, and third-party synthetic data licensing open adjacent pools. Early movers who productize cloud tiers and labeled point-cloud feeds lock sticky recurring revenue. This signals a shift from CapEx tools to operating expenditure services. Investors gain clearer SaaS multiples when usage metrics replace seat counts.
| Opportunity | (~) % Potential CAGR Upside | Geographic Relevance | Execution Window |
|---|---|---|---|
| Cloud-Native Simulation-as-a-Service for SME Fleet Operators | +2.2% | Global, acute in India, Southeast Asia | Medium term (2 to 4 years) |
| Adjacent Expansion Into Off-Highway and Agricultural Autonomy | +1.7% | North America, Europe, India | Medium term (2 to 4 years) |
| M&A Roll-Up of Fragmented Regional Scenario-Library Vendors | +1.4% | Global | Long term (4 years or more) |
| Digital Twin Monetization for Smart Infrastructure Mapping | +1.2% | China, Europe, North America | Long term (4 years or more) |
| Synthetic Data Licensing for Third-Party AI Model Training | +0.9% | Global | Medium term (2 to 4 years) |
Key Company Insights
Applied Intuition, Inc. positions as an autonomy simulation specialist focused on full-stack virtual validation for OEM and mobility programs. Its scenario-centric approach reduces dependence on physical tracks for edge cases. This creates sticky multi-year software commitments when buyers need auditable safety evidence. Concentration on autonomy workflows raises switching costs once libraries embed in customer pipelines.
ANSYS, Inc. brings multiphysics depth into sensor and vehicle digital twins used across broader engineering organizations. That breadth lets automotive groups unify crash, thermal, and perception validation under one vendor relationship. The risk is slower niche feature velocity versus pure-play autonomy simulators. Buyers gain enterprise procurement ease but may still add specialist tools for LiDAR-specific fidelity.
Key Players
- Applied Intuition, Inc.
- ANSYS, Inc.
- NVIDIA Corporation
- Siemens Digital Industries Software
- Cognata Ltd.
- dSPACE GmbH
- IPG Automotive GmbH
- Vector Informatik GmbH
- AVL List GmbH
- DEKRA SE
- Valeo SA
- RoboSense Technology Co., Ltd.
- Luminar Technologies, Inc.
- rFpro
- Hexagon AB
Recent Developments
- January 2025: Hexagon launched Virtual Test Drive X, a cloud-native solution for testing, training and validating ADAS and autonomous-driving systems using simulated real-world environments and sensor scenarios.
- July 2025: Siemens Digital Industries Software and AnteMotion formed a strategic partnership to integrate Simcenter Prescan physics-based sensor models into AnteMotion Midgard real-time simulation platform for ADAS and autonomous-vehicle development.
- August 2025: Siemens Digital Industries Software released Simcenter Prescan 2507 with improved dynamic lighting, traffic simulation and virtual-environment capabilities for autonomous-system testing.
Geopolitical Impact Analysis
According to UNCTAD Review of Maritime Transport 2025, seaborne trade volumes were expected to rise only about 0.5% in 2025 after stronger prior growth. Shipping still moves over 80% of world merchandise trade, including automotive electronics and optical components used in LiDAR benches. Fragile freight and port disruption raise landed cost and lead time for GPU servers and calibration gear. Simulation vendors with multi-region cloud regions reduce exposure to single-corridor delays.
Therefore, data from the IEA show electric car sales on track above 20 million units in 2025, about one-quarter of global car sales, concentrating sensor demand in contested trade lanes. Export controls on high-fidelity simulation codebases already appear as a restraint in China and Russia corridors. Dual-use software reviews can add months to cross-border deployments. Firms that maintain jurisdiction-split code trees and local scenario hosting protect revenue when tariffs or controls tighten.
Report Scope
| Report Features | Description |
|---|---|
| Market Value (2025) | USD 1.60 Billion |
| Forecast Revenue (2035) | USD 8.40 Billion |
| CAGR (2026-2035) | 18.4% |
| Base Year for Estimation | 2025 |
| Historic Period | 2020-2024 |
| Forecast Period | 2026-2035 |
| Report Coverage | Revenue Forecast, Market Dynamics, Market Opportunity Analysis, Technology and Innovation Landscape, Competitive Landscape, Recent Developments |
| Segments Covered | By LiDAR Type (Mechanical LiDAR, Solid-State LiDAR), By Method (Testing Method, Simulation Method), By Laser Wavelength (Short-Wave Infrared Spectrum, Long-Wave Infrared Spectrum), By Vehicle Type (Passenger Cars, Commercial Vehicles), By Level of Autonomy (Level 1, Level 2, Level 3, Level 4, Level 5), By Application (Advanced Driver-Assistance Systems, Autonomous Driving, Robotic Vehicles, Other Applications) |
| Regional Analysis | North America (US and Canada), Europe (Germany, France, The UK, Spain, Italy, and Rest of Europe), Asia Pacific (China, Japan, South Korea, India, Australia, and Rest of APAC), Latin America (Brazil, Mexico, and Rest of Latin America), Middle East and Africa (GCC, South Africa, and Rest of MEA) |
| Competitive Landscape | Applied Intuition, Inc., ANSYS, Inc., NVIDIA Corporation, Siemens Digital Industries Software, Cognata Ltd., dSPACE GmbH, IPG Automotive GmbH, Vector Informatik GmbH, AVL List GmbH, DEKRA SE, Valeo SA, RoboSense Technology Co., Ltd., Luminar Technologies, Inc., rFpro, Hexagon AB |
| Customization Scope | Customization for segments, region / country-level will be provided. Additional customization can be done based on requirements. |
| Purchase Options | We have three licenses to opt for: Single User License | Multi-User License (Up to 5 Users) | Corporate Use License (Unlimited User and Printable PDF) |