Quick Navigation
- Report Overview
- Key Takeaways
- Drive Type Analysis
- Propulsion Type Analysis
- Tonnage Capacity Analysis
- Automation Analysis
- Application Analysis
- Key Market Segments
- Regional Analysis
- Key Regions and Countries
- Market Dynamics
- Drivers
- Restraints
- Challenges
- Opportunities
- Key Company Insights
- Recent Developments
- Geopolitical Impact Analysis
- Report Scope
Report Overview
Global Terminal Tractor Market size is expected to be worth around USD 3.60 Billion by 2035 from USD 2.20 Billion in 2025, growing at a CAGR of 5.10% during the forecast period 2026 to 2035. Terminal tractors move trailers and containers inside ports, yards, and distribution sites. Buyers treat them as core yard assets that set turnaround speed and labor cost per move.
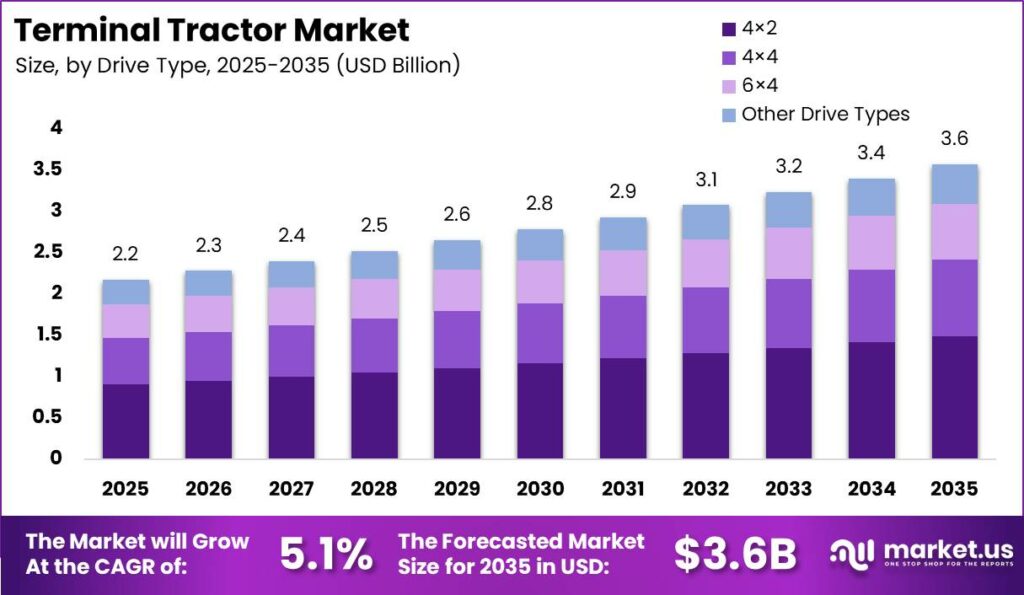
Therefore, the market structure splits across drive type, propulsion, tonnage, automation, and application. Each layer shapes capital budgets and fleet replacement timing. Operators match configurations to confined-yard duty cycles rather than highway range needs.
Key Takeaways
- The Terminal Tractor Market is valued at USD 2.20 Billion in 2025 and is projected to reach USD 3.60 Billion by 2035, expanding at a CAGR of 5.10%.
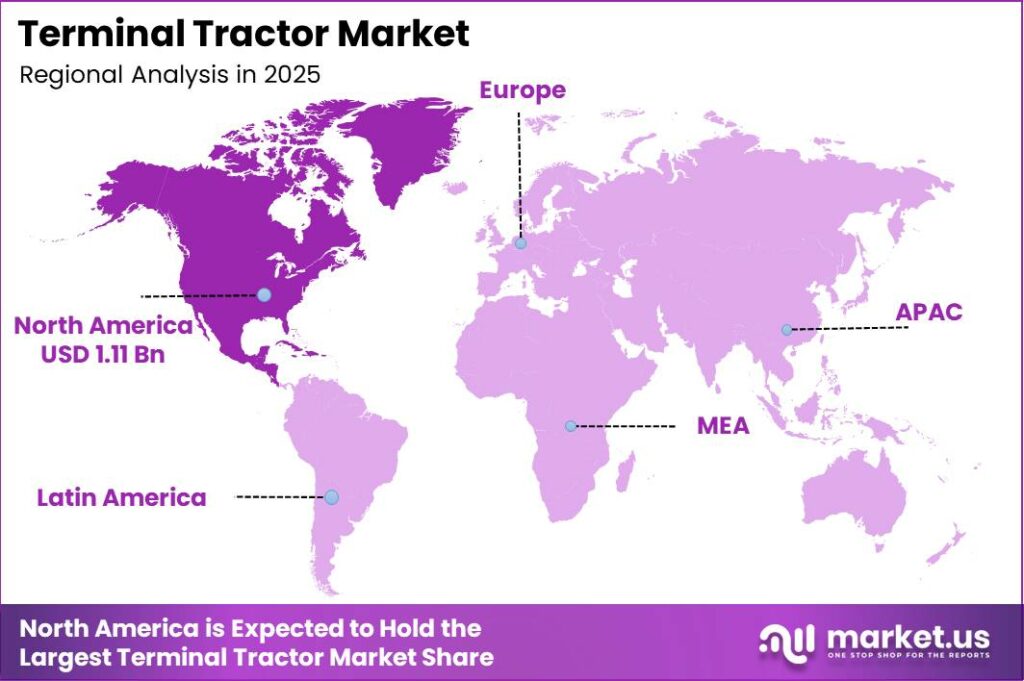
- North America leads with a 51.00% share, valued at USD 1.11 Billion.
- By Drive Type, 4×2 holds 41.60% share.
- By Propulsion Type, Diesel holds 72.00% share.
- By Tonnage Capacity, Below 50 Tons holds 53.00% share.
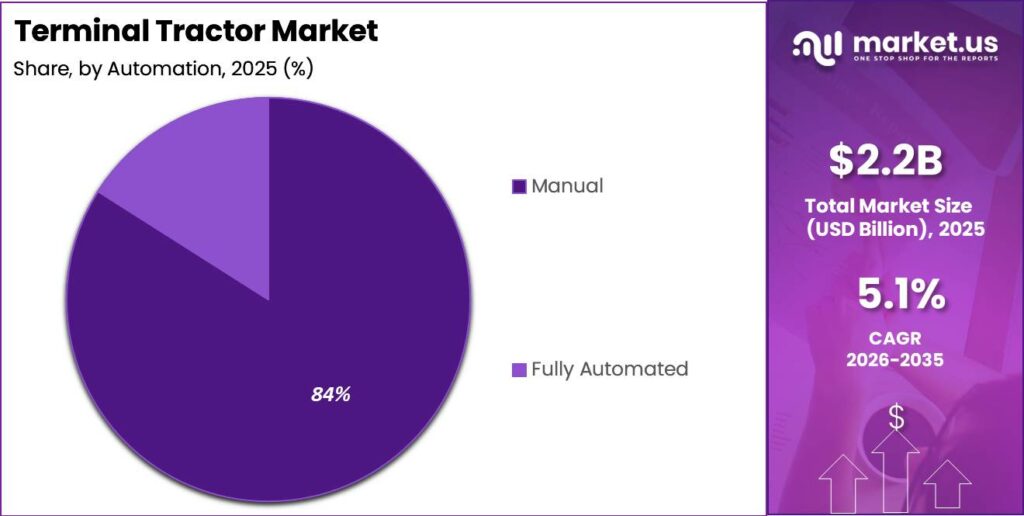
- By Automation, Manual holds 84.00% share.
- By Application, Marine Ports and Container Terminals hold 38.00% share.
Port authorities and near-port regulators tighten fleet disclosure and access rules for yard equipment. California Advanced Clean Fleets style mandates and EU port emissions zoning compress the window for new diesel spotter orders from 2026 onward. This pushes operators to disclose fleet mix and accelerate conversion plans. Sellers who bundle chargers with units win multi-year contracts earlier than pure hardware vendors.
As a result, end-use growth in container yards and e-commerce distribution centers lifts hostler demand in lockstep with handling volumes. As per our research, one DTI electric yard truck surpassed 30,000 operating hours in warehouse and distribution service. That intensive duty cycle proves electric units can anchor daily trailer moves when range fits the geofence.
Consequently, cost and compliance math now favor early electric adopters inside high-cycle yards. Figures from Orange EV show operators saved an estimated USD 100 million in combined fuel and maintenance across the deployed electric terminal-truck fleet by October 2025. In July 2025, BYD expanded its commercial electric vehicle portfolio with electric yard tractor and terminal mobility solutions for logistics and industrial sites. Fleets that delay replacement extend aging diesel life and absorb higher upkeep risk.
Drive Type Analysis
4×2 dominates with 41.60% due to lower cost for paved yard moves.
In 2025, 4×2 held a dominant market position in the By Drive Type segment of Terminal Tractor Market, with a 41.60% share. UNCTAD data shows ports handled 920 million TEUs of containers worldwide in 2024, up 6.9% year over year. Most of those moves occur on flat paved surfaces where two driven wheels deliver enough traction. Vendors who price 4×2 units aggressively capture volume before all-wheel options win niche bids.
4×4 configurations serve uneven ground, wet docks, and mixed surface terminals where slip risk is high. CALSTART estimates the total U.S. yard tractor stock near 62,000 units, with zero-emission models still a small share of that base. Buyers pay a premium for four-wheel drive when weather or grade would stall a 4×2. This creates a durable specialty channel for OEMs with heavy-duty driveline options.
6×4 layouts support heavier pulls and multi-trailer strings in large container stacks. World Bank and UNCTAD container traffic series track sustained TEU growth that keeps peak-pull demand alive at mega terminals. Operators specify three-axle drive when load charts exceed two-axle limits. Other drive types fill residual custom chassis orders and hold remaining share collectively for specialized yard layouts.
Propulsion Type Analysis
Diesel dominates with 72.00% due to proven duty cycle and fueling.
In 2025, Diesel held a dominant market position in the By Propulsion Type segment of Terminal Tractor Market, with a 72.00% share. CALSTART reported zero-emission yard tractor deployments rose roughly 30% between 2023 and 2024, yet diesel still fills most replacement slots. Refueling speed and residual value keep diesel the default for mixed fleets. OEMs that ignore diesel parts support lose aftermarket margin even as electric share climbs.
Electric terminal tractors fit geofenced yards with predictable routes and overnight charge windows. U.S. zero-emission yard tractors account for about 2.8% of the roughly 62,000 unit national stock per CALSTART. Lower energy and maintenance cost offsets higher sticker price over multi-year ownership. Fleets with depot power capacity shift first and pressure peers on total cost benchmarks.
Hybrid systems bridge sites that lack full charging capacity today. NACFE captive-fleet electrification work places total cost parity for suitable electric duty cycles in a 4 to 6 year horizon for many operators. Hybrids cut idle fuel burn without full grid upgrades. Alternative fuels cover remaining share where renewable diesel or gas infrastructure already exists on site.
Tonnage Capacity Analysis
Below 50 Tons dominates with 53.00% due to standard trailer hostling loads.
In 2025, Below 50 Tons held a dominant market position in the By Tonnage Capacity segment of Terminal Tractor Market, with a 53.00% share. Global ports moved 920 million TEUs in 2024 according to UNCTAD, and most single-trailer moves fall inside this tonnage band. Standard capacity units keep purchase price and tire wear in check. Volume leaders standardize on this class to simplify training and spare parts.
The 50 to 100 Tons band serves heavier containers, double moves, and industrial bulk yards. Lloyd’s List One Hundred Ports recorded combined throughput of 743.6 million TEU in 2024, up 8.1%, which sustains demand for higher-rated hostlers at large hubs. Buyers in this band accept higher capital cost for fewer stalled moves. Suppliers with proven frame strength win bids at steel and bulk terminals.
Above 100 Tons units address extreme industrial and specialty lifts where failure is not acceptable. Seaborne trade volumes reached 12,720 million tons in 2024, growing 2.2% per UNCTAD maritime figures, supporting heavy industrial hostling. These low-volume machines carry long sales cycles and high margins. Remaining niche capacity classes share residual demand among custom chassis programs.
Automation Analysis
Manual dominates with 84.00% due to flexible labor and lower systems cost.
In 2025, Manual held a dominant market position in the By Automation segment of Terminal Tractor Market, with a 84.00% share. UNCTAD has long noted that only about 1% of container terminals are fully automated, with the large majority still non-automated. Manual cabs keep capital light and handle exception moves without software limits. Most yards still hire drivers for peak shifts rather than full robot fleets.
Fully automated terminal tractors target controlled low-speed yards with mapped routes and safety fencing. At TOC Europe in June 2026, Westwell reported 100 battery-electric autonomous Q-Trucks contracted for the Port of Felixstowe, a structural signal of commercial-scale intent. Labor cost per move can fall when driver scarcity bites. Early movers pair autonomy software licenses with electric chassis to lock recurring revenue.
Mixed manual and supervised autonomy stages will persist while regulators clear confined-zone rules. Port automation remains early stage relative to overall terminal count, so manual fleets still absorb most unit volume. Investors should treat full autonomy as a long-cycle option, not a near-term volume switch. Suppliers who offer optional autonomy kits protect share as standards mature.
Application Analysis
Marine Ports and Container Terminals dominate with 38.00% due to high TEU handling intensity.
In 2025, Marine Ports and Container Terminals held a dominant market position in the By Application segment of Terminal Tractor Market, with a 38.00% share. UNCTAD reports 920 million TEUs handled at ports worldwide in 2024, a 6.9% rise that directly multiplies spotter cycles. Every extra crane move needs a hostler ready at the stack. Port-focused OEMs win when they align delivery slots with berth expansion projects.
Warehouses and distribution centers use yard trucks for trailer spotting between doors and lots. As per Orange EV case data available in January 2026, one DTI electric yard truck eliminated about 45,000 gallons of diesel and avoided more than 500 tons of CO₂ over its life. E-commerce dwell patterns keep doors busy around the clock. Electric units fit these short-loop sites when chargers sit at the fence line.
Airports need reliable bag and cargo dolly pulls under strict turn times. Logistics centers and oil and gas facilities add specialized duty cycles with hazmat and remote-site constraints. Other applications hold remaining share across industrial parks and intermodal ramps. Vendors who certify for airport and energy site rules open higher-margin niches beyond pure port volume.
Key Market Segments
By Drive Type
- 4×2
- 4×4
- 6×4
- Other Drive Types
By Propulsion Type
- Diesel
- Electric
- Hybrid
- Alternative Fuels
By Tonnage Capacity
- Below 50 Tons
- 50 to 100 Tons
- Above 100 Tons
By Automation
- Manual
- Fully Automated
By Application
- Marine Ports and Container Terminals
- Airports
- Warehouses and Distribution Centers
- Logistics Centers
- Oil and Gas Facilities
- Other Applications
Regional Analysis
North America Dominates the Terminal Tractor Market with a Market Share of 51.00%, Valued at USD 1.11 Billion
North America concentrates demand through large container gateways, inland distribution hubs, and state electrification rules. The region’s 51.00% share and USD 1.11 Billion value in 2025 reflect dense yard fleets and active replacement cycles. California-style clean fleet rules pull electric orders forward. Suppliers with local service networks defend share against import price swings.
Europe ranks among the fastest-moving regions for port emissions zoning and autonomous pilots. At TOC Europe in June 2026, Westwell reported 100 battery-electric autonomous Q-Trucks contracted for deployment at the Port of Felixstowe. That contract shows European terminals converting pilots into multi-unit buys. OEMs with CE-compliant electric platforms gain preferred-vendor status on future tenders.
Asia Pacific, Latin America, and Middle East and Africa add volume through port modernization and new logistics parks. Global TEU handling of 920 million in 2024 underpins multi-region chassis demand. Buyers in emerging hubs often start with diesel 4×2 units, then stage electric pilots. Regional partners who finance and train locally convert first-time buyers into fleet standards.
Key Regions and Countries
North America
- US
- Canada
Europe
- Germany
- France
- The UK
- Spain
- Italy
- Rest of Europe
Asia Pacific
- China
- Japan
- South Korea
- India
- Australia
- Rest of APAC
Latin America
- Brazil
- Mexico
- Rest of Latin America
Middle East and Africa
- GCC
- South Africa
- Rest of MEA
Market Dynamics
Market Opportunity Analysis - Manual yards, mid-tonnage fleets, and emerging ports still leave clear entry lanes
Fully automated units remain a small slice beside Manual’s 84.00% share, so most global yards still buy driver-operated hostlers. New entrants can win with simpler electric manuals that skip full autonomy cost. This path fits capital-light terminals that need compliance without robot infrastructure. Early sellers who train local technicians lock multi-year service pull-through.
Below 50 Tons holds 53.00% share, yet the 50 to 100 Tons band is less crowded on product depth. Mid-tonnage buyers at bulk and mega-stack sites pay for frame strength and braking. Challengers that certify higher ratings without mega-port lead times steal share from generalists. This creates a focused SKU strategy rather than a full-line fight.
Marine Ports and Container Terminals lead at 38.00%, leaving warehouses, airports, and energy sites under-served by port-centric catalogs. Distribution centers already prove intensive electric hours on short loops. Vendors who package door-spotting kits and overnight chargers open a parallel channel. Regional dealers in secondary logistics parks become the decisive route to market.
North America holds 51.00% and USD 1.11 Billion, so Asia Pacific and Middle East port builds remain relatively open for mid-tier OEMs. Modernization budgets in new hubs often start with diesel 4×2 then stage electric pilots. Local assembly or CKD partners cut tariff exposure and delivery lag. Investors who fund regional finishing plants capture volume before global brands localize.
Technology and Innovation Landscape - Battery options, braking energy recovery, and fleet-hour proof reshape yard economics
Modular lithium-iron-phosphate packs let operators size energy to the shift. SAE reported in March 2025 that Kalmar’s third-generation electric terminal tractor offers 105 kWh, 140 kWh, and 210 kWh configurations. Right-sizing cuts wasted battery mass and purchase premium. Manufacturers who publish duty-cycle match tools shorten buyer approval cycles.
Regenerative braking improves both safety and energy use in stop-start yards. Orange EV stated in 2025 that regenerative braking can reduce stopping distance by up to 50% in terminal truck operations. Shorter stops protect cargo and cut brake wear. Fleets gain a measurable safety metric when comparing electric bids to diesel baselines.
Operating cost and emissions data now back electric business cases with hard fleet hours. Information published in January 2025 stated electricity for Orange EV terminal trucks could cost up to 90% less than diesel, while electric units remained more than twice as expensive to buy. By October 2025 the same fleet had prevented about 200,000 tons of CO₂. CFOs use these figures to justify higher CapEx against multi-year OpEx and ESG targets.
Autonomous-ready electric platforms pair software licenses with battery chassis. Confined yard maps reduce sensor complexity versus open-road autonomy. Suppliers who ship autonomy-optional wiring today avoid stranded diesel inventory later. Investors should track software attach rates as the next margin layer after unit sales.
Drivers
Near-port emissions rules such as California Advanced Clean Fleets and EU port-access zones shrink the viable window for new diesel terminal tractor sales from 2026. Operators must disclose fleet mix under CARB-style reporting, which accelerates conversion timelines. Electric terminal tractor deployments rose roughly 30% year over year between 2023 and 2024 per heavy-duty ZEV tracking. Confined yard routes of about 150 to 200 miles per charge fit current batteries and push buyers toward electric orders.
NACFE captive-fleet benchmarking places total cost of ownership parity within a 4 to 6 year horizon for suitable duty cycles. Early adopter fleets report fuel and maintenance operating cost cuts of about 15% to 20% per unit annually even when upfront electric cost runs 40% to 60% higher than diesel. This shifts OEM models toward financing, charging bundles, and telematics subscriptions. Investors gain recurring revenue as hardware-only sales give way to multi-year service contracts.
| Driver | (~) % Impact on CAGR Forecast | Geographic Relevance | Impact Timeline |
|---|---|---|---|
| Port throughput growth and container handling volumes | +1.4% | Global (Asia-Pacific, North America) | Short term (2 years or less) |
| Electrification mandates for yard fleets | +1.1% | North America, Europe | Medium term (2 to 4 years) |
| E-commerce driven distribution center hostler demand | +0.8% | North America, Europe | Short term (2 years or less) |
| Fleet replacement cycle of aging diesel spotters | +0.5% | Global | Medium term (2 to 4 years) |
| OEM autonomous-ready platform rollouts | +0.3% | North America, Europe | Short term (2 years or less) |
Restraints
Lithium-ion pack pricing and low electric terminal tractor production scale keep acquisition costs elevated versus diesel. Electric sticker prices run about 40% to 60% above diesel equivalents. Elevated lending rates versus the pre-2022 period push mid-fleet operators to defer CapEx rather than finance new electric spotters. This freezes a slice of current-year unit sales and lengthens diesel life beyond planned cycles.
OEMs face margin compression of an estimated 3 to 5 percentage points as discounting and financing incentives protect order books. Operators report delayed CapEx approval cycles of 6 to 12 months in industry capital surveys. Extended diesel service creates a split fleet-age profile across yards. Sellers who cannot offer low-rate financing lose mid-market deals to cash-rich competitors.
| Restraint | (~) % Impact on CAGR Forecast | Geographic Relevance | Impact Timeline |
|---|---|---|---|
| High upfront capital cost of electric units | -0.9% | Global | Short term (2 years or less) |
| Elevated interest rates delaying fleet CapEx | -0.6% | North America, Europe | Short term (2 years or less) |
| Tariff escalation on imported components | -0.5% | North America | Short term (2 years or less) |
| Port capital budget freezes amid trade volume uncertainty | -0.3% | Global | Short term (2 years or less) |
Challenges
Grid interconnection queues at ports and distribution yards stretch transformer upgrades to 18 to 24 months in dense clusters per utility filings cited in Department of Energy grid assessments. Yards aiming to convert more than 30% of fleets hit charging bay limits. Depot electrification can run into low single-digit millions per site. Peak-demand utility charges can add 10% to 15% to annual electricity cost and slow multi-unit electric rollouts.
This friction does not stop diesel or hybrid sales, yet it stretches conversion roadmaps across a 3 to 5 year window. OEMs, utilities, and terminal operators must co-invest in microgrids and battery buffering. Phased fleet plans replace single-year turnovers. Firms that sell charging design with tractors open a new services revenue stream while competitors wait on utility queues.
| Challenge | (~) % CAGR Friction Drag | Geographic Relevance | Mitigation Horizon |
|---|---|---|---|
| Charging infrastructure buildout lag | -0.6% | Global | Medium term (2 to 4 years) |
| Skilled technician shortage for EV drivetrains | -0.4% | North America, Europe | Medium term (2 to 4 years) |
| Component supply chain fragmentation | -0.3% | Global | Medium term (2 to 4 years) |
| Fragmented safety and interoperability standards | -0.2% | Global | Long term (4 years or more) |
| Battery degradation in high-cycle yard duty | -0.2% | Global | Medium term (2 to 4 years) |
Opportunities
Autonomous terminal tractor pilots still sit in controlled low-speed trials under limited regulatory sandboxes. Full multi-terminal commercial deployment remains unexecuted at scale, leaving adjacent white space. Autonomy can unlock about 20% to 25% lower labor cost per move where yard drivers are scarce. OEM margin from autonomy software licenses can run 8 to 12 percentage points above hardware-only sales.
Regulatory clearance for autonomous heavy vehicles in confined port zones is expected over a 4 to 6 year window per port and transport safety rulemaking timelines. Early movers who certify platforms and train operators lock preferred status before baseline growth catches up. Terminal tractor-as-a-service and retrofit kits widen access for capital-constrained yards. Investors who fund software-ready chassis capture upside once rules finalize.
| Opportunity | (~) % Potential CAGR Upside | Geographic Relevance | Execution Window |
|---|---|---|---|
| Autonomous terminal tractor deployment at scale | +1.6% | North America, Europe, Asia-Pacific | Long term (4 years or more) |
| Terminal tractor-as-a-service financing models | +0.7% | Global | Medium term (2 to 4 years) |
| Emerging market port modernization roll-outs | +0.6% | Southeast Asia, Middle East, Africa | Medium term (2 to 4 years) |
| Retrofit and battery-swap conversion kits | +0.4% | Global | Medium term (2 to 4 years) |
| Telematics and fleet-data monetization | +0.3% | Global | Long term (4 years or more) |
Key Company Insights
Kalmar Corporation advances electric terminal tractor platforms with modular battery choices that match yard duty cycles. SAE reported in March 2025 that Kalmar’s third-generation electric terminal tractor offers 105 kWh, 140 kWh, and 210 kWh lithium-iron-phosphate packs. That flexibility reduces oversizing waste and shortens payback debates. Buyers gain a clear path from pilot units to standardized multi-site fleets.
Orange EV scales commercial proof through dense deployed hours and high uptime claims. In October 2025 the company reported its electric terminal-truck fleet surpassed 10 million cumulative operating hours across more than 340 fleets. Average uptime exceeded 98% versus about 75% for comparable diesel tractors in its January 2025 operational report. In May 2025 the firm expanded electric terminal truck deployments across logistics fleets at ports, warehouses, and distribution sites.
Key Players
- Kalmar Corporation
- Terberg Special Vehicles
- TICO Tractors
- Capacity Trucks
- MAFI Transport-Systeme GmbH
- Konecranes Oyj
- Hyster-Yale Materials Handling, Inc.
- Autocar, LLC
- Orange EV
- BYD Company Limited
- MOL CY NV
- CVS Ferrari S.p.A.
- SANY Group Co., Ltd.
- SINOTRUK (Hong Kong) Limited
- FAW Jiefang Group Co., Ltd.
Recent Developments
- March 2025: Volvo Group expanded its electromobility solutions for heavy-duty applications, including development of electric drivelines and charging solutions applicable to terminal and yard vehicle operations.
- April 2025: Toyota Industries Corporation continued expansion of its industrial vehicle electrification portfolio, including battery-electric solutions for logistics and material-handling applications supporting terminal operations.
- June 2025: Capacity Trucks continued development and deployment of electric terminal tractors, including the ZE electric terminal truck platform designed for heavy-duty yard operations.
Geopolitical Impact Analysis
Data from UNCTAD shows seaborne trade growth slowing toward about 0.5% in 2025 after 2.2% volume growth to 12,720 million tons in 2024, while containerized trade growth eases near 1.4%. Rerouting around conflict zones extends voyage times and bunches port arrivals. Terminal tractor demand spikes when stacks overflow and then pauses when CapEx freezes. Fleet planners should stage flexible leases rather than single-year bulk diesel buys.
According to public trade policy tracking, U.S. Section 232 tariffs on steel and aluminum rose to 50% in 2025 for many origins, with vehicle and parts duties also elevated in the 10% to 25% range depending on partner deals. Chassis and component costs for terminal tractors climb when imported steel and driveline parts face those rates. North American assemblers with domestic content gain bid advantage. Importers must reprice lead times and inventory buffers for yard equipment programs.
Report Scope
| Report Features | Description |
|---|---|
| Market Value (2025) | USD 2.20 Billion |
| Forecast Revenue (2035) | USD 3.60 Billion |
| CAGR (2026-2035) | 5.10% |
| Base Year for Estimation | 2025 |
| Historic Period | 2020-2024 |
| Forecast Period | 2026-2035 |
| Report Coverage | Revenue Forecast, Market Dynamics, Market Opportunity Analysis, Technology and Innovation Landscape, Competitive Landscape, Recent Developments |
| Segments Covered | By Drive Type (4×2, 4×4, 6×4, Other Drive Types), By Propulsion Type (Diesel, Electric, Hybrid, Alternative Fuels), By Tonnage Capacity (Below 50 Tons, 50 to 100 Tons, Above 100 Tons), By Automation (Manual, Fully Automated), By Application (Marine Ports and Container Terminals, Airports, Warehouses and Distribution Centers, Logistics Centers, Oil and Gas Facilities, Other Applications) |
| Regional Analysis | North America (US and Canada), Europe (Germany, France, The UK, Spain, Italy, and Rest of Europe), Asia Pacific (China, Japan, South Korea, India, Australia, and Rest of APAC), Latin America (Brazil, Mexico, and Rest of Latin America), Middle East and Africa (GCC, South Africa, and Rest of MEA) |
| Competitive Landscape | Kalmar Corporation, Terberg Special Vehicles, TICO Tractors, Capacity Trucks, MAFI Transport-Systeme GmbH, Konecranes Oyj, Hyster-Yale Materials Handling, Inc., Autocar, LLC, Orange EV, BYD Company Limited, MOL CY NV, CVS Ferrari S.p.A., SANY Group Co., Ltd., SINOTRUK (Hong Kong) Limited, FAW Jiefang Group Co., Ltd. |
| Customization Scope | Customization for segments, region / country-level will be provided. Additional customization can be done based on requirements. |
| Purchase Options | We have three licenses to opt for: Single User License | Multi-User License (Up to 5 Users) | Corporate Use License (Unlimited User and Printable PDF) |