Quick Navigation
Report Overview
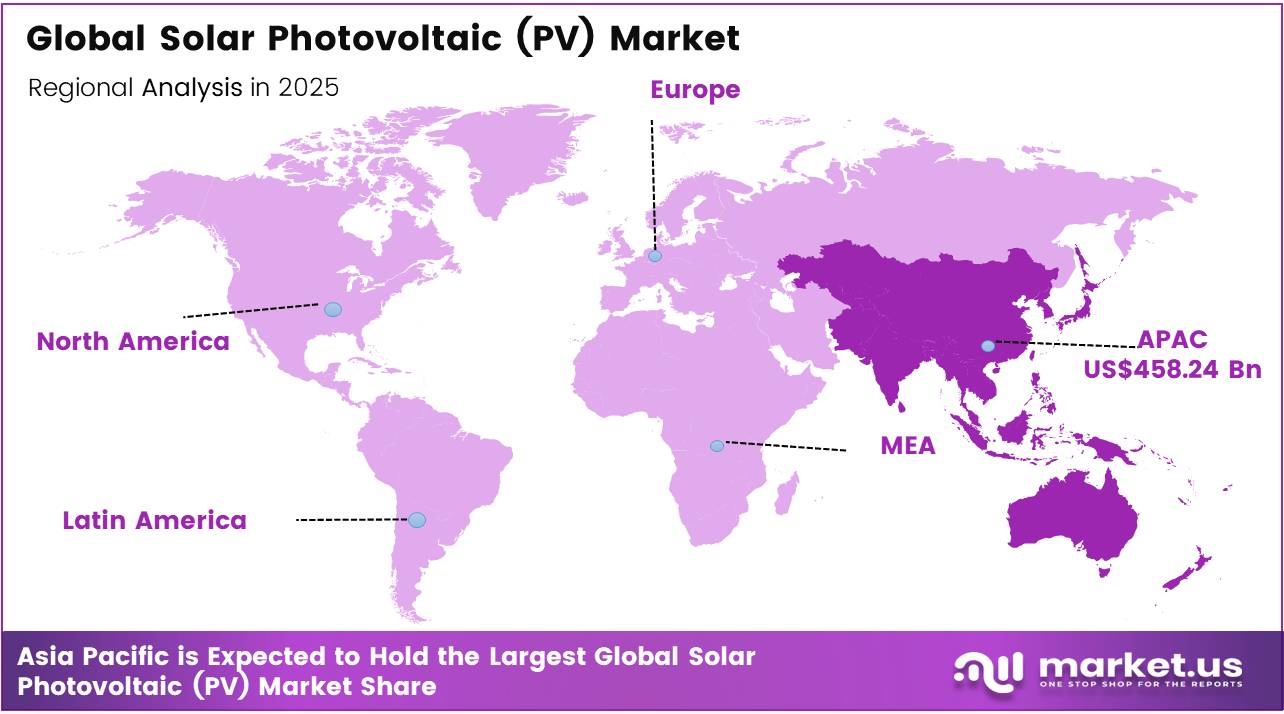
In 2025, the Global Solar Photovoltaic (PV) Market was valued at US$625.2 billion, and between 2026 and 2035, this market is estimated to register a CAGR of 10.9%, reaching about US$1,759.0 billion by 2035. In 2025, North America held a dominant market position, capturing more than a 73.30% share, holding USD 458.24 Billion revenue
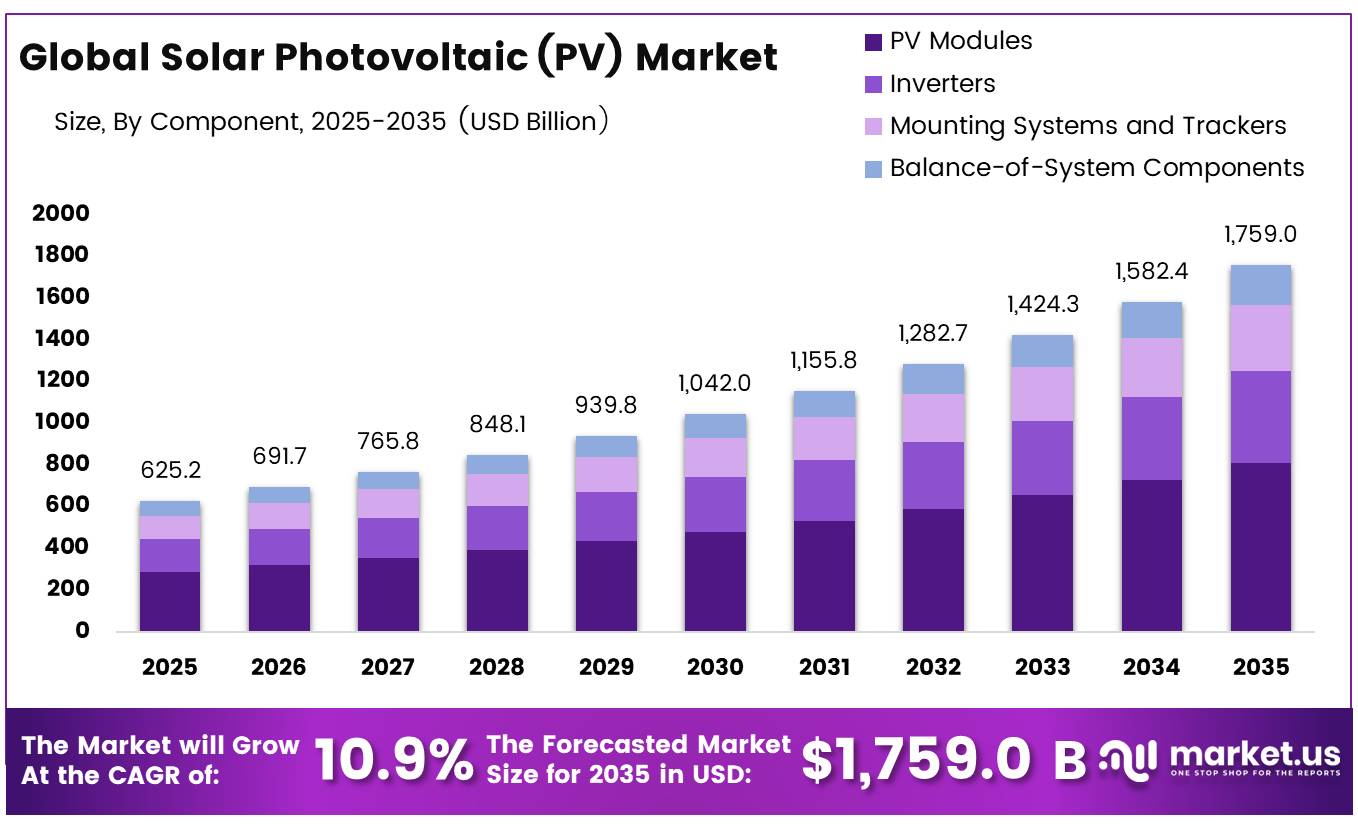
Solar photovoltaic (PV) technology converts sunlight directly into electricity through semiconductor cells. PV systems generally combine modules, inverters, mounting structures, monitoring equipment and grid-connection components, serving utility, commercial and residential applications.The global solar PV industry recorded strong expansion in 2025. Annual installations increased by around 12% and exceeded 600 GW, raising cumulative capacity to approximately 2,800 GW. Solar represented more than 75% of the record 800 GW of renewable capacity added worldwide, while 30 countries installed over 1 GW of solar capacity during the year.
Solar PV generation increased by approximately 600 TWh in 2025 to nearly 2,700 TWh, supplying more than 8% of global electricity. This additional output met around 70% of the annual increase in global electricity generation. Battery storage also supported solar integration, with additions rising by around 40% to almost 110 GW.
- Future growth opportunities remain strong in utility-scale plants, rooftops, floating solar, agrivoltaics, recycling, smart inverters and solar-plus-storage facilities. The IEA projects almost 4,600 GW of renewable additions during 2025–2030, with solar PV representing nearly 80% of this expansion.
The industry is increasingly focused on grid flexibility and reliable system integration. In the European Union, solar generation reached 275 TWh in 2025, rising 18%, while new installations totalled 56 GW. Grid congestion, connection delays, financing conditions and manufacturing pressure remain key challenges.
Key Takeaways
- The global Solar Photovoltaic (PV) market was valued at US$625.2 billion in 2025.
- The global Solar Photovoltaic (PV) market is projected to grow at a CAGR of 10.9% and is estimated to reach US$1,759.0 billion by 2035.
- On the basis of Technology, the Monocrystalline Silicon dominated the market, constituting 86.1% of the total market share.
- Based on the Component, the PV Modules dominated the Solar Photovoltaic (PV) market, with a substantial market share of around 46.0%.
- Based on the Grid Connectivity, On-Grid led the market, comprising 96.0% of the total market.
- Among the Installation, the Ground-Mounted held a major share in the Solar Photovoltaic (PV) market, 58.0% of the market share.
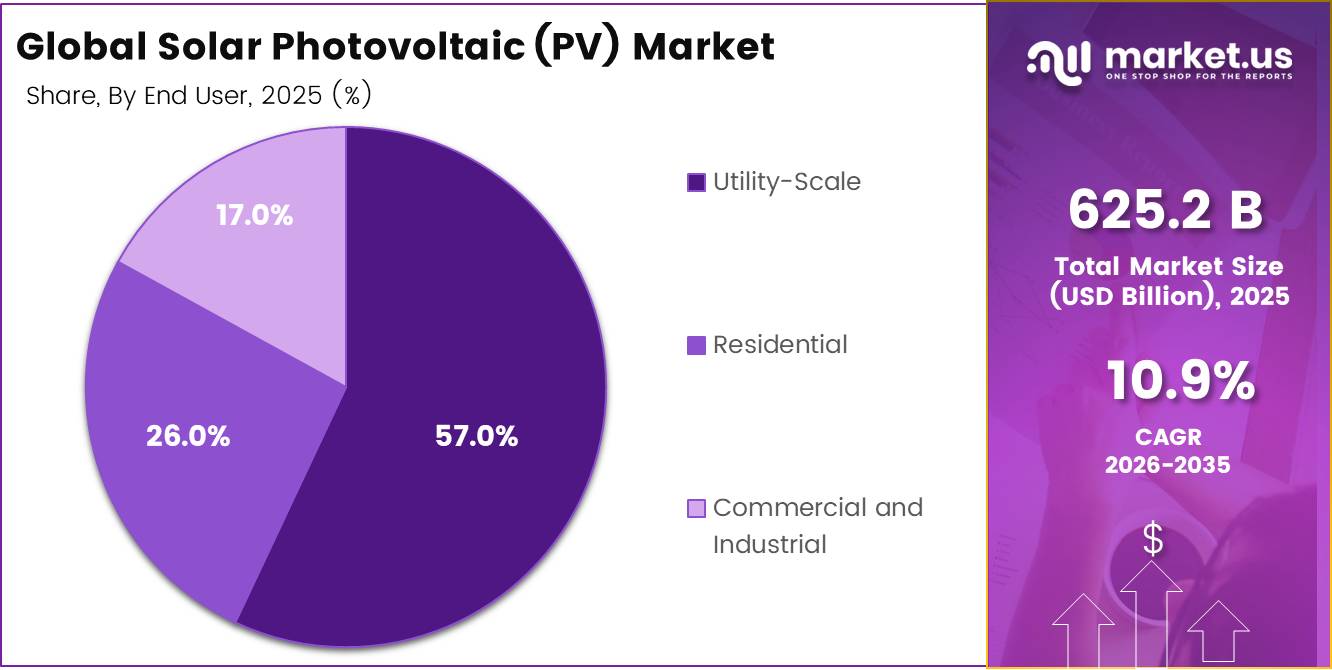
- Among the End User, the Utility-Scale is the most considerable within the market, accounting for around 57.0% of the revenue.
- In 2025, the Asia Pacific was the most dominant region in the Solar Photovoltaic (PV) market, accounting for 73.3% of the total global consumption.
Solar Photovoltaic (PV) Market Segments
Technology Analysis
Monocrystalline Silicon represents dominant Segment in the Market.
Monocrystalline silicon held the leading position, accounting for 86.10% of the Solar Photovoltaic (PV) Market. Its leadership is supported by high conversion efficiency, proven durability and compatibility with large-scale automated manufacturing. The U.S. Department of Energy reported that commercially produced silicon modules generally deliver 20%–22% efficiency, while laboratory monocrystalline cells can exceed 27%. Monocrystalline technology also represented 96% of global solar module shipments in 2022, demonstrating its established position across utility, commercial and rooftop installations. Its mature supply chain and dependable field performance continue to make it the preferred option for developers seeking greater electricity output from limited installation space.
Tandem/perovskite is emerging as the growing segment because it can capture a wider portion of the solar spectrum than conventional single-junction cells. According to the U.S. Department of Energy, perovskite cell efficiency has risen from approximately 3% in 2009 to more than 26%, while perovskite-silicon tandem cells have approached 34% efficiency. However, durability, large-area manufacturing and commercial bankability still require improvement.
Component Analysis
PV modules a significant Component.
PV modules held the leading position, capturing 46.00% of the Solar Photovoltaic Component Market. Modules remain essential because they directly convert sunlight into electricity and are required across rooftop, commercial and utility-scale projects. The U.S. Energy Information Administration reported that the country installed 27.2 GW of utility-scale solar capacity in 2025. Developers plan to add another 43.4 GW in 2026, representing a 60% annual increase, which is expected to support continued demand for efficient and durable PV modules.
Inverters are emerging as the growing component as solar installations increasingly require intelligent power conversion, voltage control, system monitoring and grid-support capabilities. The U.S. Department of Energy states that up to 80% of electricity could flow through power-electronic devices by 2030. This transition creates opportunities for smart, hybrid and grid-forming inverters that can improve solar integration, reliability and resilience.
Grid Connectivity Analysis
On-Grid Are the Most Widely Used Grid Connectivity.
On-grid systems held the leading position, capturing 96.00% of the Solar Photovoltaic Market. Their dominance is supported by utility-scale solar plants, commercial installations and grid-connected rooftops that can export excess electricity. The U.S. Energy Information Administration recorded 149,798.5 MW of utility-scale solar PV and 59,505.5 MW of small-scale solar PV capacity in 2025, bringing the total to 209,304 MW. This large connected base continues to drive demand for smart inverters, metering systems and grid-management equipment.
Off-grid solar is the growing segment, supported by remote communities and facilities requiring independent or emergency electricity. A U.S. Department of Energy-backed community microgrid project combines approximately 1,070 kW of solar PV with battery storage to provide autonomous electricity to eight essential facilities. Such projects demonstrate how off-grid solar can improve local resilience where conventional network access is unreliable or costly.
Installation Analysis
Ground-mounted systems Held a Major Share of the Solar Photovoltaic (PV) Market.
Ground-mounted systems held the leading position, capturing 58.00% of the Solar Photovoltaic Market. This format remains widely preferred for large power plants because developers can install extensive module arrays, use solar trackers and maintain equipment without building-related space restrictions. U.S. utility-scale solar PV capacity reached 122,061.8 MW in 2024, while these facilities generated approximately 216.7 TWh of electricity. This operating scale supports continued demand for ground foundations, tracking structures, high-capacity inverters and grid infrastructure.
Floating PV is the growing segment, as it allows clean electricity generation on reservoirs and artificial ponds where available land is limited. In 2026, an EU-supported floating solar plant in Mallorca reached 1.48 MW and occupied approximately 27% of the water basin. Such installations can expand solar capacity while supporting water conservation, although anchoring, corrosion control and environmental monitoring remain important.
End User Analysis
Solar Photovoltaic (PV)s Are Mostly Utilized in the Utility-Scale.
Utility-scale applications held the leading position, capturing 57.00% of the Solar Photovoltaic Market. Large solar farms remain attractive because they deliver bulk electricity, support long-term power procurement and allow developers to use high-capacity inverters, tracking systems and storage. U.S. utility-scale solar facilities generated 296,000 GWh of electricity during the year, representing a 34% increase from 2024. This strong output growth reinforces the segment’s importance in grid-scale renewable power development.
Residential solar is the growing segment, supported by household demand for lower electricity bills, backup power and greater energy independence. U.S. residential small-scale PV capacity reached 40,474.8 MW in 2025, while residential solar generation totalled 63,274 thousand MWh. Continued adoption of rooftop panels, batteries and smart energy controls is making residential systems more practical for homeowners.
Key Market Segments
By Technology
- Monocrystalline Silicon
- Polycrystalline Silicon
- Thin-Film
- Tandem/Perovskite
- Others
By Component
- PV Modules
- Inverters
- Mounting Systems and Trackers
- Balance-of-System Components
By Grid Connectivity
- On-Grid
- Off-Grid
By Installation
- Ground-Mounted
- Rooftop
- Building-Integrated Photovoltaics (BIPV)
- Floating PV
- Others
By End User
- Utility-Scale
- Residential
- Commercial and Industrial
Market Dynamics
Drivers
Restraints
Opportunity
Trends
Geopolitical Impact Analysis
Geopolitical Energy Shocks and Industrial Policy Reshaping Solar PV Supply Chains.
Geopolitical conflicts are strengthening the strategic value of solar PV by exposing economies to volatile fossil-fuel imports. The European Commission reported that the European Union imported €336.7 billion worth of energy products, while the latest Middle East conflict created an estimated €44 billion in additional energy costs. This pressure is encouraging governments to accelerate locally generated renewable electricity, strengthen transmission networks and combine solar plants with battery storage. The EU is now working toward at least 700 GW of installed solar capacity by the end of the decade. For solar developers, geopolitical instability is therefore creating stronger long-term demand, although grid congestion, permitting delays and higher financing costs may slow individual projects.
At the same time, governments are treating solar manufacturing as an energy-security priority rather than relying entirely on globally concentrated supply chains. The U.S. Department of Energy reported that more than 335 GW of solar supply-chain manufacturing capacity had been announced across the country, supported by nearly US$17 billion in planned investment across 118 new or expanded facilities. This localization can reduce exposure to shipping disruptions, trade disputes and sudden import restrictions while supporting domestic production of modules, cells, wafers, inverters and trackers. However, upstream manufacturing remains harder to expand than module assembly because facilities require significant capital, skilled workers and long construction periods. The market is consequently becoming more regional, with procurement decisions increasingly shaped by origin rules, delivery security, policy incentives and component traceability alongside price and performance.
Regional Analysis
Asia Pacific Held the Largest Share of the Global Solar Photovoltaic (PV) Market.
Asia Pacific held the leading position, capturing 73.30% of the Solar Photovoltaic Market. Its dominance is supported by large manufacturing networks, utility-scale developments and rising electricity demand across major economies. By June 2026, China’s installed solar power capacity had reached 1.27 billion kW, representing a 15.8% year-over-year increase. This scale strengthens regional demand for modules, inverters, trackers, storage systems and grid infrastructure.
Europe is the growing region, supported by energy-security policies, carbon-reduction targets and expanding rooftop and utility installations. Eurostat reported that solar electricity generation increased by 24.6% in 2025, making it the EU’s fastest-growing renewable electricity source. Solar also contributed 27.5% of renewable electricity generation, moving ahead of hydropower. This progress is creating opportunities in distributed PV, battery integration, smart inverters and grid modernization.
Key Regions and Countries Covered
- North America
- The US
- Canada
- Europe
- Germany
- France
- The UK
- Spain
- Italy
- Russia & CIS
- Rest of Europe
- APAC
- China
- Japan
- South Korea
- India
- ASEAN
- Rest of APAC
- Latin America
- Brazil
- Mexico
- Rest of Latin America
- Middle East & Africa
- GCC
- South Africa
- Rest of MEA
Key Players Analysis
Solar Photovoltaic (PV) manufacturers focus on strengthening product efficiency, manufacturing scale, and supply chain resilience to remain competitive. A key priority is continuous technology improvement, including the development of high-efficiency monocrystalline cells, bifacial modules, tandem structures, and advanced encapsulation materials that improve power output, durability, and performance under changing weather conditions. Companies also invest heavily in automated cell and module production, as precision manufacturing supports consistent quality, lower defect rates, and reduced unit costs.
Vertical integration across polysilicon, wafers, cells, modules, and inverters helps manufacturers secure material availability and manage pricing pressure. Strategic factory expansion across major solar-producing regions enables closer alignment with utility, rooftop, and commercial demand. In addition, manufacturers emphasize patent protection, digital quality control, product certification, and recyclable module designs to support long-term market access. Long-term supply agreements with project developers, utilities, and distributors further improve demand visibility, strengthen customer relationships, and support positioning in high-value solar applications.
The Major Players In The Industry
- LONGi Green Energy Technology Co., Ltd.
- JinkoSolar Holding Co., Ltd.
- Trina Solar Co., Ltd.
- JA Solar Technology Co., Ltd.
- Canadian Solar Inc.
- First Solar, Inc.
- Tongwei Co., Ltd.
- Hanwha Qcells
- Risen Energy Co., Ltd.
- Astronergy (CHINT Group)
- GCL System Integration Technology Co., Ltd.
- Wuxi Suntech Power Co., Ltd.
- Sharp Corporation
- Tata Power Solar Systems Ltd.
- Waaree Energies Ltd.
Key Development
- In July 2026, LONGi Green Energy Technology Co., Ltd. announced that its crystalline silicon-perovskite tandem solar cell achieved 5% conversion efficiency, independently certified by the European Solar Test Installation, setting a global photovoltaic efficiency record.
- In April 2026, JinkoSolar Holding Co., Ltd. reported 2025 module shipments of 86 GW and cumulative deliveries above 390 GW, while Tiger Neo series shipments surpassed 220 GW, showing commercial adoption of its N-type portfolio.
Report Scope
| Report Features | Description |
|---|---|
| Market Value (2025) | US$625.2 Bn |
| Forecast Revenue (2035) | US$1,759 Bn |
| CAGR (2026-2035) | 10.9% |
| Base Year for Estimation | 2025 |
| Historic Period | 2020-2024 |
| Forecast Period | 2026-2035 |
| Report Coverage | Revenue Forecast, Market Dynamics, Competitive Landscape, Recent Developments |
| Segments Covered | By Technology (Monocrystalline Silicon, Polycrystalline Silicon, Thin-Film, Tandem/Perovskite and Others), By Component (PV Modules, Inverters, Mounting Systems and Trackers and Balance-of-System Components), By Grid Connectivity (On-Grid and Off-Grid), By Installation (Ground-Mounted, Rooftop, Building-Integrated Photovoltaics (BIPV), Floating PV and Others), By End User (Utility-Scale, Residential and Commercial and Industrial). |
| Regional Analysis | North America – The US & Canada; Europe – Germany, France, The UK, Spain, Italy, Russia & CIS, Rest of Europe; APAC– China, Japan, South Korea, India, ASEAN & Rest of APAC; Latin America– Brazil, Mexico & Rest of Latin America; Middle East & Africa– GCC, South Africa, & Rest of MEA |
| Competitive Landscape | LONGi Green Energy Technology Co., Ltd., JinkoSolar Holding Co., Ltd., Trina Solar Co., Ltd., JA Solar Technology Co., Ltd., Canadian Solar Inc., First Solar, Inc., Tongwei Co., Ltd., Hanwha Qcells, Risen Energy Co., Ltd., Astronergy (CHINT Group), GCL System Integration Technology Co., Ltd., Wuxi Suntech Power Co., Ltd., Sharp Corporation, Tata Power Solar Systems Ltd., Waaree Energies Ltd.. |
| Customization Scope | Customization for segments, region/country-level will be provided. Moreover, additional customization can be done based on the requirements. |
| Purchase Options | We have three licenses to opt for: Single User License, Multi-User License (Up to 5 Users), Corporate Use License (Unlimited Users and Printable PDF) |