


Report Overview
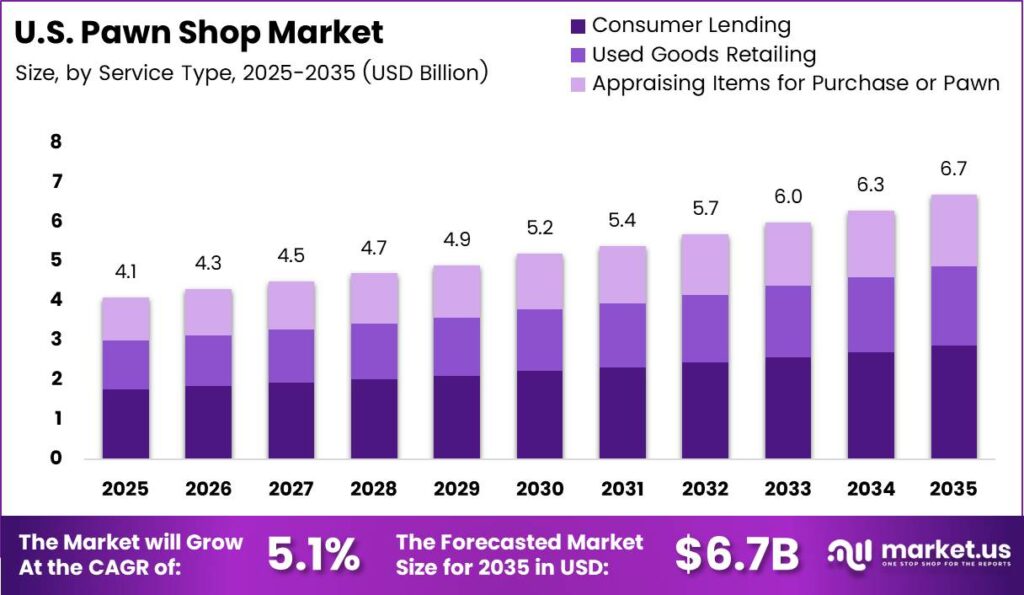
US Pawn Shop Market size is expected to be worth around USD 6.7 Billion by 2035 from USD 4.1 Billion in 2025, growing at a CAGR of 5.1% during the forecast period 2026 to 2035. This trajectory reflects sustained credit access gaps, elevated commodity prices, and the expanding role of pawn as a structured alternative to conventional financial services.
The U.S. pawn shop market operates across three core functions: consumer lending secured by personal collateral, retail resale of unredeemed goods, and appraisal services for items submitted for purchase or pawn. These functions serve underbanked households, financially distressed consumers, and value-seeking retail buyers simultaneously. This structure gives pawn operators dual revenue exposure across both credit and retail cycles.
Key Takeaways
- The U.S. Pawn Shop Market was valued at USD 4.1 Billion in 2025 and is forecast to reach USD 6.7 Billion by 2035.
- The market is projected to grow at a CAGR of 5.1% during the forecast period 2026 to 2035.
- By Service Type, Consumer Lending dominates with a 42.78% share in 2025.
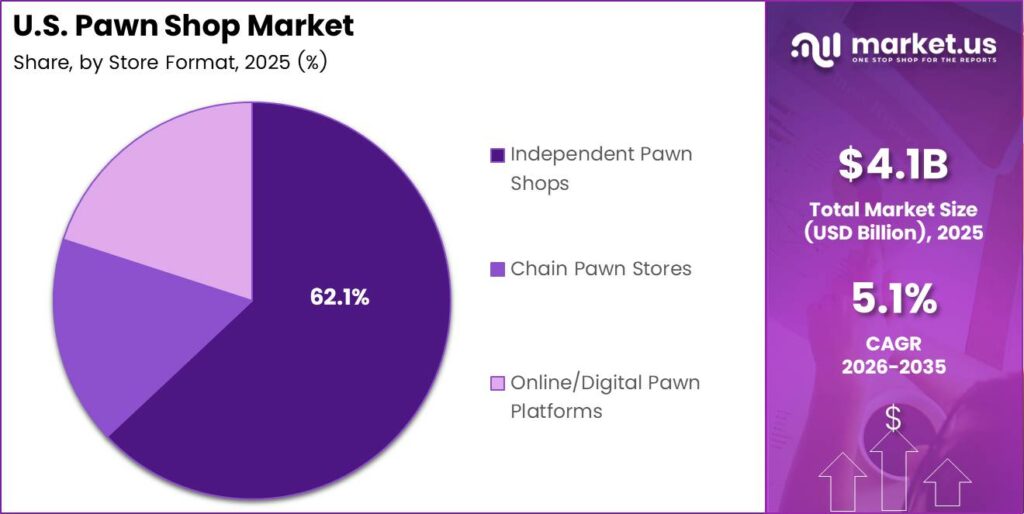
- By Store Format, Independent Pawn Shops hold the leading position with a 62.10% share in 2025.
- By End User, Baby Boomers represent the largest segment with a 40.00% share in 2025.
- Consumer Lending is the fastest-growing service type, while Online/Digital Pawn Platforms lead growth in store format, and Generation Y leads in end-user growth.
- The U.S. remains the sole regional market in scope for this report, with nationwide coverage across urban, suburban, and rural store networks.
State-level regulation continues to shape how pawn operators price and structure transactions. Oregon caps stated monthly interest at 3%, while Florida permits total pawn charges of up to 25% per 30-day period. The Military Lending Act caps the annual percentage rate at 36% for servicemembers. These constraints require jurisdiction-specific compliance systems and directly affect operator margin across different states.
As per our research, FirstCash’s U.S. pawn loan fees rose 15% and retail merchandise sales climbed 10% year over year in the second quarter of 2026. These dual gains show that both the lending and resale sides of the business strengthened together. Operators who optimize both revenue streams simultaneously hold a structural margin advantage over those managing only one side of the pawn cycle.
As per our research, FirstCash opened 11 pawn stores in Latin America during the fourth quarter of 2025, including 9 in Mexico and 2 in Guatemala. This geographic expansion signals how leading operators are deploying capital beyond saturated U.S. markets. Consequently, domestic operators who delay store network development risk ceding regional density to better-capitalized chains.
Service Type Analysis
Consumer Lending dominates with 42.78% due to persistent household credit access gaps.
In 2025, Consumer Lending held a dominant market position in the By Service Type segment of the U.S. Pawn Shop Market, with a 42.78% share. This segment generates revenue through pawn service charges on collateral-backed loans, capturing demand from households that cannot access conventional credit. Consumer Lending is also the fastest-growing service type, reflecting worsening debt delinquency and rising short-term liquidity pressure across lower-income demographics.
Used Goods Retailing captures resale revenue from unredeemed collateral and purchased merchandise. This segment benefits directly from rising consumer interest in discounted goods and the growing acceptance of secondhand retail. Data from FirstCash shows that U.S. retail merchandise sales increased 8% in 2025 with a retail sales margin of 42%, while EZCORP’s U.S. merchandise sales also rose 8% year over year with a gross margin of 38% in the quarter ended December 31, 2025. These margins confirm that resale holds strong pricing power within the pawn channel.
Appraising Items for Purchase or Pawn functions as a gateway service that determines loan values and purchase prices for submitted goods. Appraisal accuracy directly affects both loan-to-value ratios and resale profitability. In July 2024, FirstCash acquired 26 U.S. pawn stores through three transactions in North Carolina, Texas, and Florida, expanding its geographic appraisal and lending capacity across these high-volume states.
Store Format Analysis
Independent Pawn Shops dominate with 62.10% due to deep local market penetration and established community trust.
In 2025, Independent Pawn Shops held a dominant market position in the By Store Format segment of the U.S. Pawn Shop Market, with a 62.10% share. Independent operators maintain advantages in hyper-local pricing, flexible loan terms, and long-standing customer relationships. This segment’s share reflects the highly fragmented nature of the U.S. pawn industry, where thousands of single-location operators serve localized demand that national chains have not yet absorbed.
Chain Pawn Stores command a smaller share of total store count but generate disproportionate revenue through standardized operations, centralized compliance systems, and scaled purchasing. Chain operators use consistent appraisal protocols and integrated point-of-sale systems to drive throughput at each location. This operational consistency allows chains to maintain stronger resale margins and faster inventory turnover compared to independent operators.
Online/Digital Pawn Platforms represent the fastest-growing format within the segment. Digital platforms remove geographic constraints and expand the serviceable borrower base beyond walkable store catchment areas. As per our research, a scaled online resale marketplace achieved sell-through above 80%, demonstrating that digitally enabled pawn channels can outperform physical stores on inventory conversion when authentication and fulfillment are well executed.
End User Analysis
Baby Boomers dominate with 40.00% due to higher asset ownership and established pawn borrowing behavior.
In 2025, Baby Boomers held a dominant market position in the By End User segment of the U.S. Pawn Shop Market, with a 40.00% share. This cohort holds substantial quantities of jewelry, collectibles, tools, and electronics accumulated over decades, giving them a broader and higher-value collateral pool than younger borrowers. Their familiarity with pawn as a financial tool sustains repeat transaction volume and loan renewal behavior that supports predictable pawn receivable growth.
Generation X represents a secondary borrower segment with meaningful transaction volume. This cohort faces dual financial pressure from household debt obligations and declining real wages, positioning pawn lending as a viable short-term liquidity tool. Generation X borrowers typically pledge mid-value electronics, tools, and jewelry, supporting consistent collateral intake across mid-tier loan brackets.
Generation Y is the fastest-growing end-user segment. Younger consumers in this cohort carry elevated credit card balances and face structural barriers to conventional credit, driving pawn adoption as an alternative. Their comfort with digital channels also accelerates uptake of online pawn platforms, making this segment the primary growth driver for digital format operators over the forecast period.
Key Market Segments
By Service Type
- Consumer Lending
- Used Goods Retailing
- Appraising Items for Purchase or Pawn
By Store Format
- Independent Pawn Shops
- Chain Pawn Stores
- Online/Digital Pawn Platforms
By End User
- Baby Boomers
- Generation X
- Generation Y
Drivers
Household financial resilience remained constrained heading into the forecast period. In 2024, only 63% of U.S. adults could cover a benchmark emergency expense with cash or equivalent, and that share held flat at 63% in 2025. By Q3 2025, 4.5% of outstanding household debt was delinquent and credit card balances were 5.75% above the prior-year level. This liquidity gap sustains collateralized pawn lending as a primary short-term credit channel for borrowers outside conventional finance.
Pawn operators convert underused household assets into same-day funds without conventional underwriting, supporting an estimated +0.9% incremental contribution to the 5.1% baseline CAGR through higher pawn receivable volumes and repeat fee cycles. However, operators must manage redemption deterioration carefully because a 2 to 3 percentage-point decline in redemption rates can materially increase merchandise inventory and working capital requirements.
| Driver | (~) % Impact on CAGR Forecast | Geographic Relevance | Impact Timeline |
|---|---|---|---|
| Household Emergency-Liquidity Gap | +0.9% | Nationwide; lower-income communities | Short term (≤ 2 years) |
| Elevated Precious-Metal Values | +0.6% | Nationwide; jewelry-heavy markets | Short term (≤ 2 years) |
| Discounted Resale Demand | +0.4% | Urban and suburban markets | Medium term (2–4 years) |
| Sun Belt Population Growth | +0.3% | South and Southwest | Medium term (2–4 years) |
| Established Omnichannel Resale | +0.2% | Metropolitan and multistate networks | Medium term (2–4 years) |
| Mainstream-Credit Exclusion | +0.1% | Underbanked communities nationwide | Long term (≥ 4 years) |
Restraints
Pawn pricing operates under materially different state fee structures and federal borrower protections. Oregon limits stated monthly interest to 3% while separately permitting setup and storage charges, whereas Florida permits total pawn charges of up to 25% per 30-day period. The Military Lending Act caps the military annual percentage rate at 36%, and a 2025 federal settlement covering thousands of disputed pawn loans reinforced requirements for protected-borrower screening and compliant contract terms.
This regulatory fragmentation removes standardized national pricing and requires jurisdiction-specific transaction engines and legal controls. Effective yield can fall by 2 to 4 percentage points in constrained customer segments, while compliance expense adds approximately 50 to 100 basis points for smaller operators. The result is an estimated -0.8% drag against the 5.1% baseline CAGR, delaying store expansion into legally complex markets.
| Restraint | (~) % Impact on CAGR Forecast | Geographic Relevance | Impact Timeline |
|---|---|---|---|
| Fragmented Rate-Cap Regimes | -0.8% | Nationwide; state-dependent severity | Short term (≤ 2 years) |
| Elevated Working-Capital Costs | -0.5% | Nationwide; independent operators | Short term (≤ 2 years) |
| Fintech Credit Substitution | -0.4% | Digitally banked metropolitan markets | Medium term (2–4 years) |
| Restrictive Store Licensing | -0.3% | Municipality-specific urban markets | Long term (≥ 4 years) |
| Mandatory Collateral Holds | -0.2% | States with extended holding periods | Short term (≤ 2 years) |
| Falling Unbanked Incidence | -0.1% | Nationwide | Long term (≥ 4 years) |
Challenges
Counterfeit jewelry, watches, electronics, collectibles, and altered precious-metal items create direct principal-loss exposure when they pass frontline inspection. U.S. border authorities seized approximately 32.3 million counterfeit items in fiscal 2024, with watches, jewelry, electronics, and computer equipment among the monitored product categories. A modeled false-acceptance rate of only 1% across higher-risk collateral removes approximately 50 to 100 basis points from merchandise margin because recovery on fraudulent goods approaches 0%.
Enhanced inspection adds 5 to 15 minutes to intake time and suppresses transaction capacity during peak periods. Mitigation requires centralized authentication teams, precious-metal spectroscopy, device diagnostics, image-based model verification, and recurring staff certification. These controls increase near-term operating expense but are necessary to contain the estimated -0.6% friction drag on achievable CAGR and protect resale-channel credibility for operators building scaled retail portfolios.
| Challenge | (~) % CAGR Friction Drag | Geographic Relevance | Mitigation Horizon |
|---|---|---|---|
| Counterfeit Collateral Authentication | -0.6% | Nationwide; luxury-product hubs | Medium term (2–4 years) |
| Rapid Electronics Value Decay | -0.4% | Nationwide | Short term (≤ 2 years) |
| Skilled Appraiser Shortages | -0.3% | Secondary cities and rural markets | Long term (≥ 4 years) |
| Police Reporting Fragmentation | -0.2% | Multijurisdictional store networks | Medium term (2–4 years) |
| Cybersecurity and Privacy Exposure | -0.2% | Digitized operators nationwide | Long term (≥ 4 years) |
| Redemption Forecasting Volatility | -0.1% | Economically volatile local markets | Medium term (2–4 years) |
Opportunities
An interoperable online inventory network represents the most significant near-term revenue opportunity for scaled pawn operators. Existing omnichannel activity largely consists of individual-store listings with fragmented inventories, pricing records, fulfillment rules, and customer traffic. Public-company filings show that established pawn retail portfolios achieved approximately 42% merchandise gross margins and 8% annual sales growth in 2025, while a scaled online resale marketplace reported sell-through above 80% but returns of 24.2%.
A shared inventory exchange with standardized condition grading, authenticated listings, dynamic routing, and consolidated fulfillment could raise sell-through by 8 to 12 percentage points, reduce aged inventory by 15 to 25%, and expand merchandise margin by approximately 100 to 200 basis points after fulfillment and return costs equal to 6 to 9% of online sales. Successful execution would add an estimated +0.7% to the 5.1% baseline CAGR, lifting the achievable trajectory toward 5.8% without requiring equivalent growth in physical store count.
| Opportunity | (~) % Potential CAGR Upside | Geographic Relevance | Execution Window |
|---|---|---|---|
| Interoperable Online Inventory Network | +0.7% | Nationwide | Medium term (2–4 years) |
| AI-Assisted Collateral Underwriting | +0.5% | Multistate and high-volume operators | Medium term (2–4 years) |
| Repair and Refurbishment Services | +0.4% | Urban electronics markets | Medium term (2–4 years) |
| Independent-Store Roll-Up | +0.3% | Fragmented regional markets | Long term (≥ 4 years) |
| Mobile Rural Pawn Access | +0.2% | Rural and underserved counties | Long term (≥ 4 years) |
| Certified Luxury Consignment | +0.1% | Affluent metropolitan markets | Medium term (2–4 years) |
Key Company Insights
First Cash Financial Services Inc. reported consolidated revenue of USD 3.661 Billion and GAAP net income of USD 330.375 Million for 2025, operating 3,330 pawn locations globally at December 31, 2025, including 1,207 in the United States. Its U.S. pawn segment revenue rose 12% and same-store pawn receivables grew 12% in 2025. By Q2 2026, U.S. locations reached 1,212 and segment revenue jumped 22% year over year, reflecting accelerating domestic store performance driven by rising consumer credit stress.
EZCORP INC. operated 547 U.S. pawn stores at December 31, 2025, up from 542 a year earlier, generating USD 269.760 Million in U.S. segment revenue during the quarter ended December 31, 2025. U.S. pawn loans outstanding reached USD 239.9 Million, increasing 9% year over year. In January 2026, EZCORP acquired an 87.7% controlling interest in Founders One, adding 105 pawn stores across 12 countries. Earlier, in February 2026, FirstCash disclosed it had acquired 17 U.S. pawn stores through three transactions during Q4 2025 in Texas, Nebraska, Nevada, Arizona, and Utah.
Key Players
- First Cash Financial Services Inc.
- EZCORP INC.
- DFC Global Corp.
- Picasso Pawn
- Buckeye Pawn Shop
- Borro Private Finance
- Welsh Pawn
- Luxury Asset Capital
- Beverly Loan Company
- Big Store Pawn Shop
- Other Key Players
Recent Developments
- June 23, 2026 – FirstCash announced an agreement to acquire Ramsdens Holdings, which operated 174 U.K. pawn locations. The original offer valued its equity at approximately £206 Million, including a permitted dividend. This was an announced transaction, not a completed acquisition.
- May 15, 2026 – EZCORP, through Founders One, acquired 1,360.65 additional shares of Simple Management Group, increasing its ownership to 16,030.65 shares and representing 93% of the company.
- May 14, 2026 – EZCORP purchased the remaining 12.3% membership interest in Founders One, increasing its ownership to 100%.
- July 23, 2026 – FirstCash disclosed that it added 20 pawn locations during the second quarter of 2026: 7 acquired stores and 1 new store in the United States, plus 6 new stores each in Latin America and the United Kingdom.
- January 12, 2026 – EZCORP completed the acquisition of 12 Texas pawn stores for USD 27.5 Million.
Report Scope
| Report Features | Description |
|---|---|
| Market Value (2025) | USD 4.1 Billion |
| Forecast Revenue (2035) | USD 6.7 Billion |
| CAGR (2026-2035) | 5.1% |
| Base Year for Estimation | 2025 |
| Historic Period | 2020-2024 |
| Forecast Period | 2026-2035 |
| Report Coverage | Revenue Forecast, Market Dynamics, Market Opportunity Analysis, Technology and Innovation Landscape, Competitive Landscape, Recent Developments |
| Segments Covered | By Service Type (Consumer Lending, Used Goods Retailing, Appraising Items for Purchase or Pawn), By Store Format (Independent Pawn Shops, Chain Pawn Stores, Online/Digital Pawn Platforms), By End User (Baby Boomers, Generation X, Generation Y) |
| Regional Analysis | North America (US and Canada), Europe (Germany, France, The UK, Spain, Italy, and Rest of Europe), Asia Pacific (China, Japan, South Korea, India, Australia, and Rest of APAC), Latin America (Brazil, Mexico, and Rest of Latin America), Middle East and Africa (GCC, South Africa, and Rest of MEA) |
| Competitive Landscape | First Cash Financial Services Inc., EZCORP INC., DFC Global Corp., Picasso Pawn, Buckeye Pawn Shop, Borro Private Finance, Welsh Pawn, Luxury Asset Capital, Beverly Loan Company, Big Store Pawn Shop, Other Key Players |
| Customization Scope | Customization for segments, region/country-level will be provided. Additional customization can be done based on requirements. |
| Purchase Options | We have three licenses to opt for: Single User License, Multi-User License (Up to 5 Users), Corporate Use License (Unlimited User and Printable PDF) |








