Report Overview
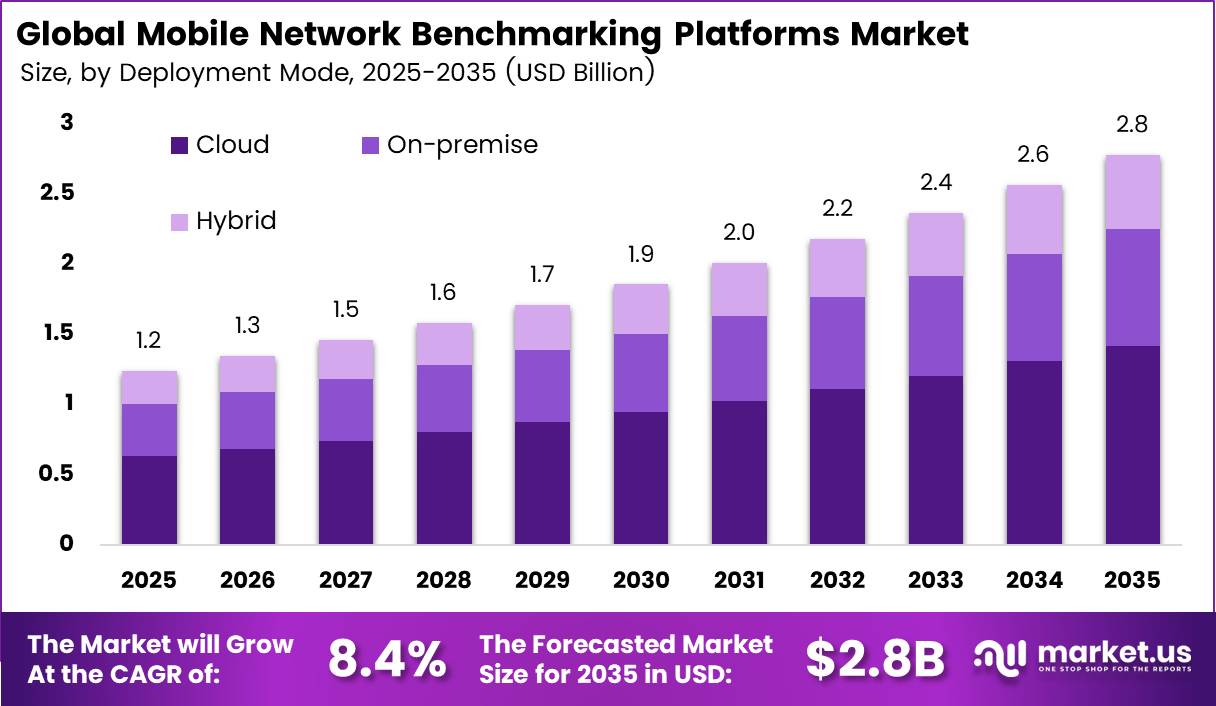
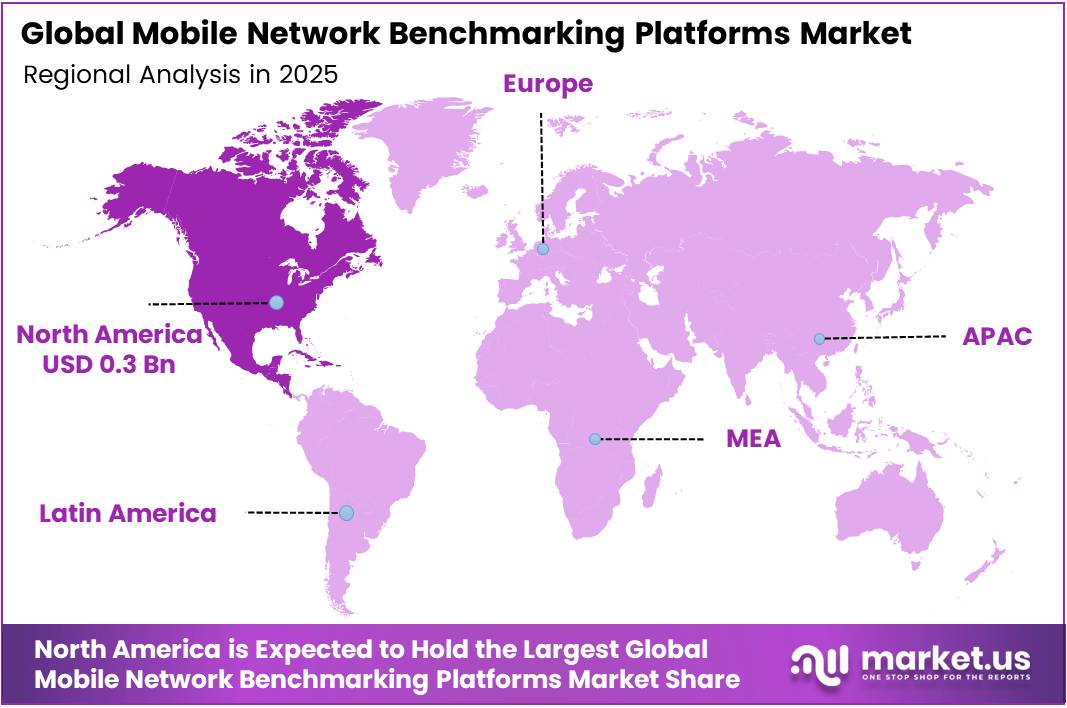
In 2025, the Global Mobile Network Benchmarking Platforms Market was valued at USD 1.2 billion. The market is projected to grow at a CAGR of 8.4% during 2026–2035, reaching approximately USD 2.8 billion by 2035. North America dominated the global market in 2025, accounting for more than 28.6% of the total market share and generating approximately USD 0.34 billion in revenue.
Fast growth in 5G drives this demand. According to the GSMA, global 5G connections passed 2 billion at the end of 2024, and 305 operators in 121 markets offered commercial 5G services. Another 80 operators in 60 markets announced plans to launch.
Each new network needs drive tests, site acceptance checks, and competitive scoring, and benchmarking platforms deliver these tasks. The GSMA also reported that mobile services added USD 6.5 trillion, or 5.8% of global GDP. When this much value depends on networks, operators must measure network quality all the time.
The North America region adopted 5G early. By the end of 2024, 5G made up more than half of mobile connections in North America, according to the GSMA. The US also runs the world’s largest 5G fixed wireless access market, with 11.6 million connections. US operators expect this to reach 11% of fixed broadband lines by the end of 2025.
Key Takeaways
- The Mobile Network Benchmarking Platforms Market reached USD 1.2 billion in 2025 and will reach USD 2.8 billion by 2035. At a CAGR of 8.4% from 2026 to 2035.
- Software leads the offerings segment with a 66.7% share and is also the fastest-growing offering.
- Cloud leads the deployment segment with a 58.9% share and is also the fastest-growing deployment model.
- Competitive Network Benchmarking leads the application segment with a 31.9% share.
- 4G and LTE-Advanced Networks lead the network generation segment with a 48.7% share.
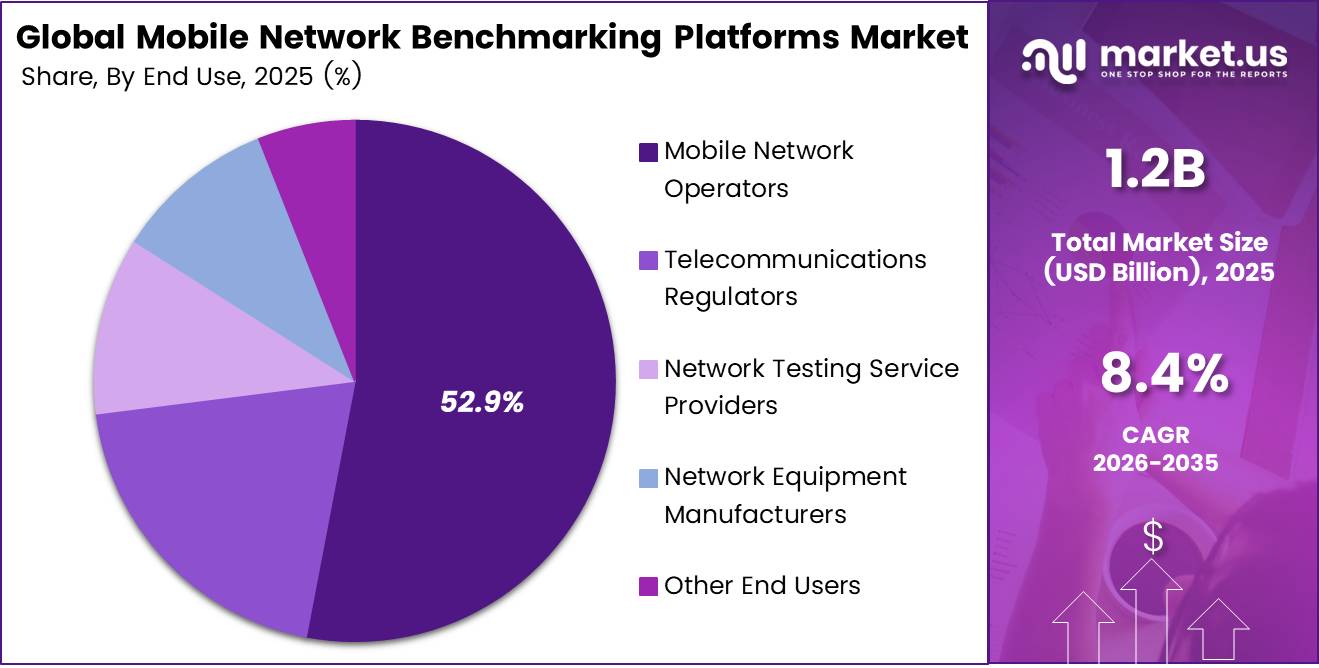
- Mobile Network Operators lead the end user segment with a 52.9% share.
- North America leads with a 28.6% share and USD 0.34 billion in revenue.
By Offerings
Software dominates with 66.7% due to scalable analytics without new field equipment.
Software leads because operators need fast, repeatable tests across very large networks. Mobile services created $7.6 trillion in value in 2025, equal to 6.4% of global GDP, so even small network faults now cost real money. Software tools let teams collect drive-test data, crowd data, and app scores, then compare rivals on one dashboard without buying new boxes for each test. This saves time and keeps costs predictable.
Software is also the fastest-growing offering, because networks never stop changing. Operators added 162 million 5G subscriptions in just the third quarter of 2025, and each new user puts fresh load on cells, spectrum, and core links. Software updates can add new test cases, bands, and KPIs overnight. Hardware probes, by contrast, need shipping, setup, and field crews.
By Deployment
Cloud dominates with 58.9% due to elastic storage for growing test data.
Cloud holds the top spot because benchmarking now runs on large, shared data sets that grow every day. Mobile broadband traffic grows about 19% each year, which quickly fills local servers. Cloud platforms let operators keep test logs, crowd samples, and coverage maps in one place, and scale storage up or down when traffic spikes.
Cloud also grows fastest because the user base keeps widening. About 74% of the world’s people now use the internet, yet 2.2 billion remain offline, so operators keep expanding into new areas that need fresh tests. Cloud tools let engineers in one country check results from sites in another, with no new data centre. Many smaller operators also lack the IT staff to run their own servers.
By Application
Competitive Network Benchmarking dominates with 31.9% due to operators marketing measurable network quality leadership.
Operators sell on network quality, and they need proof to win and keep customers. That is why Competitive Network Benchmarking is the largest application. In high-income countries, 89% of urban residents have 5G coverage, so many cities have several strong networks chasing the same users. Side-by-side tests on speed, call drops, and video quality give marketing and strategy teams clear numbers for ads and pricing.
Network Optimization and Troubleshooting is the fastest-growing application because coverage gaps stay wide outside cities. ITU finds that 66% of urban people worldwide have 5G access, against only 40% in rural areas, a gap of 26 percentage points. As operators push into rural zones, they need tools that find weak cells, interference, and handover faults fast.
By Network Generation
4G and LTE-Advanced Networks dominate with 48.7% due to the largest active subscriber base worldwide today.
4G and LTE-Advanced Networks still carry most mobile users, which keeps them in first place. GSMA data shows 4G made up 56% of global mobile connections in 2025, while 2G and 3G together held only 23%. Operators must keep testing these busy layers, since 4G still handles most voice-over-LTE calls, video, and backup coverage when 5G signals fade. Many emerging markets still rely on 4G networks.
5G is the fastest-growing generation because users are moving to it quickly. Ericsson reports that 4G subscriptions fell by 55 million in the first quarter of 2025 alone, and it expects 5G to pass 4G as the main access technology in 2027. Each new 5G band, standalone core, and network slice brings new metrics, such as latency and uplink speed, that older tools cannot measure well.
By End User
Mobile Network Operators dominate with 52.9% due to direct ownership of network quality risk.
Mobile Network Operators own the networks and carry the direct risk of poor service, which makes them the biggest buyers. They spend heavily on tests before and after every launch, upgrade, and spectrum move. They also use benchmark data to plan capital spending, set prices, and answer customer complaints with facts.
Telecommunications Regulators are the fastest-growing user group because governments now treat coverage and quality as public policy goals. ITU data shows 5G reaches 84% of people in high-income countries but only 4% in low-income countries. Coverage in Africa stands at just 12%, against 74% in Europe.
Key Market Segments
By Offerings
- Software
- Hardware
By Deployment
- Cloud
- On-premises
- Hybrid
By Application
- Competitive Network Benchmarking
- Network Optimization and Troubleshooting
- Rollout Validation and Site Acceptance
- Other
By Network Generation
- 2G and 3G Networks
- 4G and LTE-Advanced Networks
- 5G
By End User
- Mobile Network Operators
- Telecommunications Regulators
- Network Testing Service Providers
- Network Equipment Manufacturers
- Other
Geopolitical Impact Analysis
Trade tensions between the US and China raise the cost of benchmarking hardware. Drive test kits, scanners, and probe units use chipsets, RF modules, and test phones that factories in Asia build. In 2025, the US raised tariffs on many Chinese electronics by up to 145% before cutting them back to about 30% under a short truce.
The WTO cut its 2025 forecast for world goods trade volume to a fall of 0.2%, down from an earlier forecast of 3% growth. Shipping problems add more cost. UNCTAD reported that Suez Canal transits fell by more than 50% after the Red Sea attacks. Ships going around the Cape of Good Hope add about 10 to 14 days to Asia-to-Europe trips.
Prices for key metals also change quickly. China placed export controls on gallium and germanium, and gallium prices in Europe rose by more than 150%, according to World Bank commodity tracking. Both metals go into RF front ends and test receivers. Vendors pass part of this cost on through higher hardware prices.
These pressures move buyers toward software and cloud tools. Crowdsourced and cloud platforms rely less on shipped hardware, so they avoid tariffs and port delays. This helps explain why software holds most of the market and cloud deployment grows fastest.
Regional Analysis
North America dominates the Mobile Network Benchmarking Platforms Market, holding a 28.6% share and generating USD 0.34 billion in revenue. The US hosts many of the largest benchmarking vendors, including Keysight, VIAVI, NETSCOUT, and Ookla. Keysight alone earned USD 5.4 billion in fiscal 2025 revenue.
Asia Pacific is the fastest-growing region in the market. China, Japan, and South Korea run some of the world’s densest 5G networks, and 5G passed half of all connections in Greater China and developed Asia Pacific by the end of 2024. India adds scale. It had 2.3 million 5G fixed wireless connections at the end of 2024, which may reach 10% of its fixed broadband lines.
Europe holds a strong position because of strict quality rules and competitive testing. Mobile services generate about 5% of the region’s GDP, according to the GSMA. Germany, the UK, and France run yearly public network tests that operators use in marketing. Rohde and Schwarz and Infovista, both based in Europe, support local demand.
Key Regions and Countries
North America
- US
- Canada
Europe
- Germany
- France
- The UK
- Spain
- Italy
- Rest of Europe
Asia Pacific
- China
- Japan
- South Korea
- India
- Australia
- Rest of APAC
Latin America
- Brazil
- Mexico
- Rest of Latin America
Middle East and Africa
- GCC
- South Africa
- Rest of MEA
Market Dynamics
Drivers
| Driver | (~) % Impact on CAGR Forecast | Geographic Relevance | Impact Timeline |
|---|---|---|---|
| 5G Standalone Rollout Validation Needs | +2.1% | Global, led by North America, China, South Korea | Short term (2 years or less) |
| Regulatory Coverage Obligation Audits | +1.4% | Europe, India, United States | Short term (2 years or less) |
| Crowdsourced QoE Analytics Adoption | +1.2% | Global | Medium term (2 to 4 years) |
| Operator Marketing Claims Competition | +0.8% | North America, Europe, Middle East | Short term (2 years or less) |
| Cloud-Native Test Automation Shift | +0.9% | North America, Asia Pacific | Medium term (2 to 4 years) |
5G Standalone Rollout Validation Needs
The main driver is the move from non-standalone to standalone 5G cores. Under standalone networks, benchmarking budgets go toward checking network slicing, latency, and uplink performance, not just simple coverage drive tests.
GSMA Intelligence tracking counted more than 60 operators running commercial 5G SA networks by 2025. Ericsson Mobility Report data projected global 5G subscriptions would pass 2.9 billion by the end of 2025, at about one-third of all mobile subscriptions. Each slice-based SLA needs ongoing, independent proof of performance.
Operator investor disclosures from T-Mobile US and Reliance Jio point to latency targets under 20 ms for premium enterprise slices. Vendor annual reports show that recurring revenue can raise gross margins by 10 to 15 percentage points compared with drive-test hardware.
Restraints
| Restraint | (~) % Impact on CAGR Forecast | Geographic Relevance | Impact Timeline |
|---|---|---|---|
| Operator CapEx Contraction Cycle | -1.6% | Global, acute in Europe and North America | Short term (2 years or less) |
| Data Privacy Consent Restrictions | -0.9% | European Union, India, California | Short term (2 years or less) |
| Mobile OS Background Data Limits | -0.7% | Global | Medium term (2 to 4 years) |
| Operator Consolidation Reducing Buyers | -0.5% | Europe, Latin America | Medium term (2 to 4 years) |
| High Financing Costs for Vendors | -0.4% | North America, Europe | Short term (2 years or less) |
Operator CapEx Contraction Cycle
The main restraint comes from operators cutting radio spending once peak 5G investment has passed. Benchmarking and drive-test contracts are usually discretionary Opex tied to rollout phases. Dell’Oro Group equipment tracking found that global RAN revenue fell about 11% in 2024.
AT&T and Verizon earnings calls guided annual capital spending down toward USD 22 billion and USD 17.5 billion, respectively. ETNO annual reports show European operator returns on capital still below their cost of capital, at around 5% to 7%.
The result is direct pressure on procurement: drive-test campaigns are being deferred 6 to 12 months, multi-year benchmarking contracts are being renegotiated at 10% to 20% discounts, and vendor margins are shrinking as fixed field-engineering costs stay in place.
Challenges
| Challenge | (~) % CAGR Friction Drag | Geographic Relevance | Mitigation Horizon |
|---|---|---|---|
| Methodology Standardization Gaps | -0.8% | Global | Medium term (2 to 4 years) |
| RF and Data Science Talent Shortage | -0.6% | North America, Europe, India | Long term (4 years or more) |
| Multi-Vendor Open RAN Complexity | -0.5% | United States, Japan, Europe | Medium term (2 to 4 years) |
| Test Device Supply Lag | -0.3% | Asia Pacific, Global | Short term (2 years or less) |
| Crowdsourced Sample Bias Risk | -0.4% | Emerging markets | Medium term (2 to 4 years) |
Methodology Standardization Gaps
The biggest challenge is that measurement methods differ. Crowdsourced, drive-test, and network-side benchmarks often produce rankings that conflict, which weakens buyer trust and lengthens sales cycles. ETSI and ITU-T work on QoS and QoE recommendations, such as ITU-T E.804, still leaves room for interpretation on sampling, sample weighting, and indoor attribution.
Ofcom and India’s TRAI have published reports showing gaps of 15% to 30% in reported median download speeds across methods. FCC broadband data collection challenges have shown similar disputes over coverage maps.
Vendors are responding with long-term changes: hybrid data fusion, third-party audited methodologies, and active participation in standards bodies. Compliance and validation work can take up 5% to 8% of R&D budgets.
Opportunities
| Opportunity | (~) % Potential CAGR Upside | Geographic Relevance | Execution Window |
|---|---|---|---|
| Network Slice SLA Assurance Monetization | +1.5% | North America, China, Europe | Medium term (2 to 4 years) |
| Non-Terrestrial Network Benchmarking | +1.0% | Global, rural regions | Long term (4 years or more) |
| Private 5G Enterprise Verification | +0.9% | Germany, Japan, United States | Medium term (2 to 4 years) |
| Data Licensing to Non-Telecom Buyers | +0.7% | Global | Short term (2 years or less) |
| Africa and South Asia Expansion | +0.6% | Sub-Saharan Africa, South Asia | Long term (4 years or more) |
Network Slice SLA Assurance Monetization
Slice SLA assurance is still largely untapped. Today’s benchmarking checks network performance, but no established market yet exists for independent, contractually binding proof that enterprise and wholesale slice SLAs have been met.
Based on software-segment disclosures from listed test and assurance vendors such as Keysight and Spirent, gross margins could rise from roughly 55% to 70% or more. Automated probes and API-driven verification could also cut the cost per measurement point by 30% to 40% compared with field campaigns.
Key Players Analysis
Keysight Technologies leads Tier 1. It earned USD 5,375 million in fiscal 2025, up 8%, and spent USD 1,007 million on R&D. In October 2025, it bought Spirent Communications for USD 1,564 million in cash. This added service assurance and test automation to its 5G portfolio. Spirent became part of Keysight, so it no longer competes on its own.
Rohde and Schwarz, Anritsu, and VIAVI round out Tier 1, each with wide reach across drive testing and lab tools. VIAVI paid USD 399 million to buy Spirent’s high-speed Ethernet, network security, and channel emulation lines from Keysight. This deal grew VIAVI’s lab and field test business. NETSCOUT and EXFO add strength in service assurance and active probe testing for operator cores.
Ookla leads the crowdsourced side of the market. It reported USD 231 million in revenue for 2025. Accenture agreed to buy Ookla from Ziff Davis for USD 1.2 billion in March 2026. The deal includes Speedtest, Downdetector, Ekahau, and RootMetrics.
Tier 2 challengers include Infovista, Opensignal, Tutela, and Accuver. Infovista leads in drive test and RF planning software. Opensignal and Tutaela compete on crowdsourced analytics that regulators and investors use. Accuver holds a strong niche in drive test tools across Asia.
Top Key Players in the Market
- Keysight Technologies, Inc.
- Rohde & Schwarz GmbH & Co. KG
- Infovista SAS
- Anritsu Corporation
- VIAVI Solutions Inc.
- Spirent Communications plc
- Ookla, LLC
- Opensignal Limited
- Tutela Technologies Ltd.
- Accuver Co., Ltd.
- EXFO Inc.
- NETSCOUT SYSTEMS, INC.
Recent Developments
- In October 2025, Keysight Technologies bought all shares of Spirent Communications for USD 1,564 million in cash, at 199 pence per share.
- In October 2025, VIAVI Solutions bought Spirent’s high-speed Ethernet, network security, and channel emulation lines from Keysight for USD 399 million.
- In 2026, Accenture completed its USD 1.2 billion purchase of Ookla. Ookla earned USD 231 million in revenue in 2025.
Report Scope
| Report Features | Description |
|---|---|
| Market Value (2025) | USD 1.2 Billion |
| Forecast Revenue (2035) | USD 2.8 Billion |
| CAGR (2026-2035) | 8.4% |
| Base Year for Estimation | 2025 |
| Historic Period | 2020-2024 |
| Forecast Period | 2026-2035 |
| Report Coverage | Revenue Forecast, Market Dynamics, Competitive Landscape, Recent Developments |
| Segments Covered | By Offerings (Software, Hardware); By Deployment (Cloud, On-premises, Hybrid); By Application (Competitive Network Benchmarking, Network Optimization and Troubleshooting, Rollout Validation and Site Acceptance, Other); By Network Generation (2G and 3G Networks, 4G and LTE-Advanced Networks, 5G); By End User (Mobile Network Operators, Telecommunications Regulators, Network Testing Service Providers, Network Equipment Manufacturers, Other) |
| Regional Analysis | North America – US, Canada; Europe – Germany, France, The UK, Spain, Italy, Rest of Europe; Asia Pacific – China, Japan, South Korea, India, Australia, Singapore, Rest of APAC; Latin America – Brazil, Mexico, Rest of Latin America; Middle East & Africa – GCC, South Africa, Rest of MEA |
| Competitive Landscape | Keysight Technologies, Inc., Rohde & Schwarz GmbH & Co. KG, Infovista SAS, Anritsu Corporation, VIAVI Solutions Inc., Spirent Communications plc, Ookla, LLC, Opensignal Limited, Tutela Technologies Ltd., Accuver Co., Ltd., EXFO Inc., NETSCOUT SYSTEMS, INC. |
| Customization Scope | Customization for segments and region/country-level will be provided. Moreover, additional customization can be done based on the requirements. |
| Purchase Options | We have three licenses to opt for: Single User License, Multi-User License (Up to 5 Users), Corporate Use License (Unlimited Users and Printable PDF) |