


Report Overview
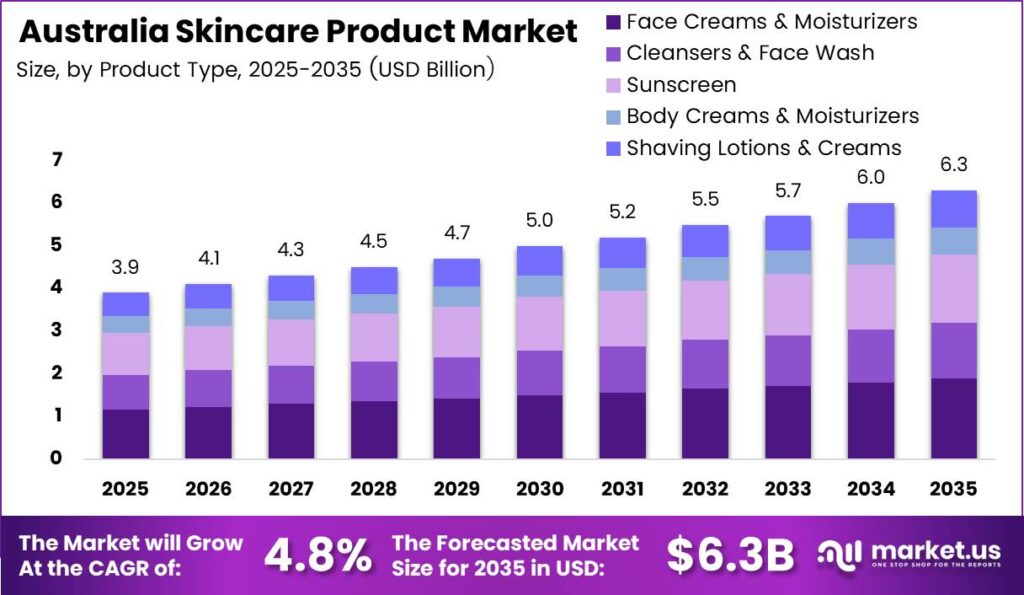
The Australia Skincare Product Market is expected to reach USD 6.3 billion by 2035, compared with USD 3.9 billion in 2025. The forecast assumes a CAGR of 4.8% during 2026 to 2035. Skincare products cleanse, moisturise, protect and support the skin barrier through daily consumer routines. Commercial returns depend on repeat purchasing, clear product benefits and distribution economics rather than product launches alone.
Australia’s skincare market connects consumer brands, ingredient suppliers, manufacturers and retail distributors serving household users. According to Cosmetics Europe, European skincare retail sales reached EUR 32.3 billion in 2025, providing an overseas category benchmark rather than Australian revenue. Skincare’s established role within personal care supports investment in repeat-use products. Australian suppliers should use overseas comparisons to assess positioning, without treating foreign spending patterns as local forecasts.
Key Takeaways
- The Australia Skincare Product Market was valued at USD 3.9 billion in 2025 and is expected to reach USD 6.3 billion by 2035, growing at a CAGR of 4.8% during 2026 to 2035.
- Face Creams & Moisturizers represent the leading product segment, with a stated share of 63.45% in 2026.
- Cleansers & Face Wash are identified as the fastest-growing product segment.
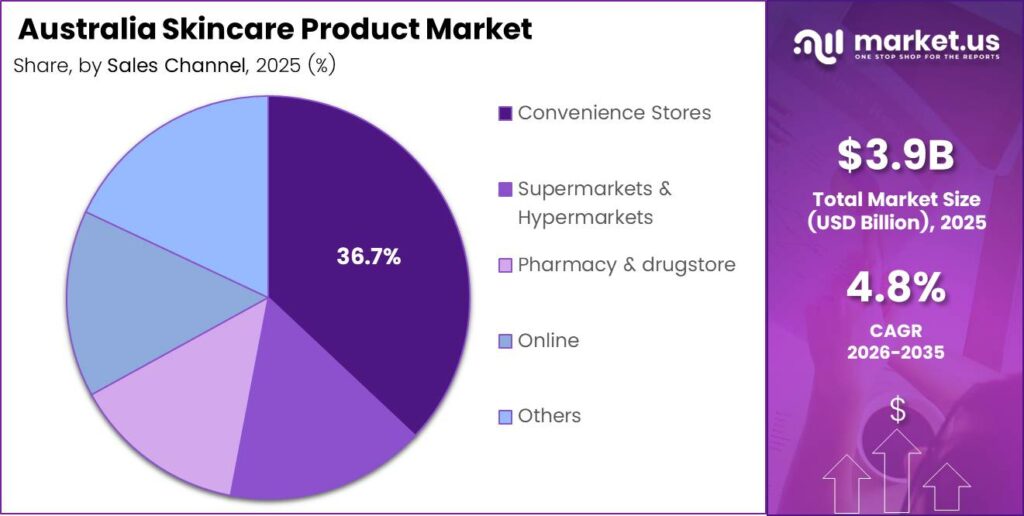
- Convenience Stores hold a stated sales-channel share of 36.78% in 2026 and are identified as the fastest-growing sales channel.
- The report covers Australia, with a forecast period extending from 2026 to 2035.
Retail networks determine whether skincare brands can turn product awareness into regular purchases across different household budgets and shopping occasions. As reported by Sigma Healthcare, Chemist Warehouse’s total retail-network sales reached AUD 10.3 billion in FY2025. That figure covers broader merchandise and multiple markets, not Australian skincare alone. Network scale nevertheless highlights the commercial importance of retailer negotiations, promotional planning and dependable replenishment for brands seeking shelf access.
Skin-health programmes can strengthen category education without directly representing retail revenue or guaranteeing purchases of premium products across Australian consumer groups. Data from L’Oréal shows its March 2025 Act for Dermatology announcement committed EUR 20 million over five years to skin-health access. The global programme signals sustained investment beyond individual product launches. Australian brands still need local evidence, appropriate claims and accessible pricing to convert awareness into purchases.
Australia requires a domestic distribution strategy rather than a global regional-share framework. Metropolitan outlets can support frequent replenishment, while regional coverage requires careful inventory placement and service planning. Regional market leadership remains unquantified, so distribution infrastructure provides context rather than proof of revenue dominance. Investors should compare retailer access, fulfilment capability and repeat purchase economics before selecting geographic expansion priorities, especially where delivery costs can weaken store-level margins.
Product Type Analysis
Face Creams & Moisturizers carry a stated 63.45% share for 2026, reflecting their central role in regular skincare routines rather than occasional treatment purchases. Olay indicates that Super Cream carried a US MSRP of USD 34.99, illustrating overseas price positioning rather than Australian pricing. Moisturisers combine water retention with barrier support, making replenishment commercially important. Suppliers must justify premium pricing through useful formulation benefits and consistent product performance.
Cleansers & Face Wash establish the first purchase occasion in many skincare routines by removing surface impurities before other products reach the skin. Figures from CeraVe Australia show a manufacturer claim of up to 24-hour hydration for its Hydrating Cleanser. The formulation links cleansing with moisture-barrier support, reducing the trade-off between removal and comfort. Brands can compete through daily usability, but this claim does not establish segment growth leadership.
Sunscreen competes on protective performance, skin feel and compatibility with daily routines, rather than protection claims alone across every consumer purchase occasion. According to Kenvue, Neutrogena Oil Control 50+ sunscreen contains 2% niacinamide, illustrating a product that combines sun protection with skincare ingredients. Such combinations can reduce the number of separate products consumers apply. Suppliers should validate claims and local availability before treating overseas formulation examples as Australian commercial benchmarks.
Sales Channel Analysis
Convenience Stores carry a stated 36.78% channel share for 2026, although that allocation remains an editorial assumption rather than a verified retail measurement. As reported by Ampol, its network included 622 company-operated sites at December 2025 year-end, including 46 U-GO locations. Site numbers do not establish skincare stocking or sales. Brands considering this channel should test assortment fit, shelf productivity and replenishment economics before committing national distribution budgets.
Supermarkets & Hypermarkets place skincare within broader household shopping trips, allowing suppliers to compete for planned replenishment rather than specialist beauty visits alone. Data from Coles Group shows an Australian network of 860 supermarkets at FY2025 year-end. That footprint provides supermarket context, not a separate hypermarket measurement or skincare revenue estimate. Suppliers need clear shelf communication and reliable availability because competing household purchases can weaken conversion for discretionary upgrades.
Pharmacy & Drugstore distribution connects skincare with specialist retail environments, where product positioning can address specific skin concerns without replacing medical advice or treatment. Sigma Healthcare indicates that its FY2025 reporting covered 588 Australian Chemist Warehouse franchise stores under its stated network definition. Pharmacy access can support targeted assortments, but store counts do not establish sales productivity. Brands should evaluate margin terms, promotional obligations and outlet-level repeat purchasing before expansion.
Key Market Segments
By Product Type
- Face Creams & Moisturizers
- Cleansers & Face Wash
- Sunscreen
- Body Creams & Moisturizers
- Shaving Lotions & Creams
By Sales Channel
- Convenience Stores
- Supermarkets & Hypermarkets
- Pharmacy & Drugstore
- Online
- Others
Market Dynamics
Australian skincare competition depends on connecting product selection, delivery convenience and repeat purchasing across retail channels rather than treating each channel as an isolated business. Data from Woolworths Group shows eComX e-commerce penetration ended FY2025 at 15.1%, a general retail metric rather than skincare penetration. Digital fulfilment can support replenishment, but promotions and delivery costs can weaken contribution margins. Brands should measure profitable customer retention alongside online revenue.
Drivers
Population expansion enlarges the potential purchaser base before brands secure higher spending per customer. Australia added approximately 552,000 residents in the year to June 2024, followed by approximately 420,000 in the year to June 2025. The later period recorded 1.5% population growth, including approximately 306,000 net overseas migrants. Suppliers can target introductory routines and growing suburbs, while avoiding assumptions that every new resident immediately adopts premium products.
The population scenario attributes 0.45 percentage points of annual category growth to consumer-base expansion. The calculation assumes 30% of recent population growth converts into category growth after purchase timing and household sharing. Total driver contributions of 1.15 percentage points remain embedded within the 4.8% forecast baseline. Investors should therefore assess brand execution against this scenario rather than add the driver total again to projected market growth.
| Driver | (~) % Impact on CAGR Forecast | Geographic Relevance | Impact Timeline |
|---|---|---|---|
| Population-led consumer-base expansion | +0.45% | Nationwide; metropolitan growth corridors | Short term (≤ 2 years) |
| Age-related moisturisation demand | +0.25% | Nationwide; Tasmania and South Australia | Long term (≥ 4 years) |
| Routine replenishment purchases | +0.20% | Nationwide; established skincare users | Short term (≤ 2 years) |
| Premium active-ingredient product mix | +0.15% | Major metropolitan markets | Medium term (2–4 years) |
| Omnichannel purchasing convenience | +0.10% | Nationwide; digitally connected households | Short term (≤ 2 years) |
Restraints
Household debt servicing can reduce spending on premium upgrades, additional serums and other discretionary skincare purchases. The household scenario assumes 20% of category spending faces material pressure, with spending growth falling 1.75 percentage points within that cohort. The resulting market-level deduction equals 0.35 percentage points. Brands facing this scenario should protect essential products and price accessibility rather than assume promotional discounts will fully restore premium-product purchase frequency.
The restraint framework assigns a combined 0.80 percentage-point deduction to purchasing pressure, sunscreen withdrawals, claims restrictions, listing access and minimum-order funding barriers. These contributions represent embedded baseline assumptions rather than measured causal effects or fresh forecast cuts. A separate stress applying that deduction to the 4.8% baseline would leave 4.0% growth. Investors should distinguish lower market growth from contraction and examine how discounting affects operating margins.
| Restraint | (~) % Impact on CAGR Forecast | Geographic Relevance | Impact Timeline |
|---|---|---|---|
| Household debt-service spending squeeze | -0.35% | Nationwide; mortgage-exposed households | Short term (≤ 2 years) |
| Sunscreen recalls and product withdrawals | -0.20% | Nationwide; therapeutic sunscreen segment | Short term (≤ 2 years) |
| Therapeutic-claim market-entry restrictions | -0.10% | Nationwide; treatment-positioned entrants | Medium term (2–4 years) |
| Retail listing access barriers | -0.10% | National pharmacy and beauty chains | Short term (≤ 2 years) |
| Minimum-order funding barriers | -0.05% | Small domestic brands and entrants | Short term (≤ 2 years) |
Challenges
Ocean freight uncertainty can interrupt ingredient supply, packaging deliveries and finished-product availability without changing underlying consumer preferences. The operating scenario assumes an additional 10 to 20 days of transit variability and safety-stock cover rising from 6 to 8 weeks. Inventory requirements would increase by approximately 33% at unchanged demand. Brands must balance service protection against working-capital costs rather than treat larger stockholdings as a cost-free response.
The freight scenario assigns a 0.20 percentage-point growth drag to temporary availability gaps and slower launches rather than permanent purchase restrictions. Combined operating challenges contribute an illustrative 0.55 percentage-point friction estimate. Applying both challenge and restraint totals as fresh downside stresses would reduce baseline growth to 3.45%, without implying contraction. Suppliers should prioritise alternative sourcing, compatible components and forecast discipline where those measures reduce stockouts without excessive inventory.
| Challenge | (~) % CAGR Friction Drag | Geographic Relevance | Mitigation Horizon |
|---|---|---|---|
| Ocean Freight Schedule Volatility | -0.20% | Import-dependent brands; Europe-linked routes | Short term (≤ 2 years) |
| Formulation Scale-Up Yield Variability | -0.12% | Domestic contract-manufacturing clusters | Medium term (2–4 years) |
| Regional Last-Mile Delivery Complexity | -0.10% | Regional and remote Australia | Medium term (2–4 years) |
| Demand Forecasting SKU Complexity | -0.08% | Multi-brand retailers and broad-range suppliers | Short term (≤ 2 years) |
| Specialist Cosmetic Chemist Availability | -0.05% | Domestic formulation and development teams | Long term (≥ 4 years) |
Opportunities
Closed-loop refill platforms offer conditional upside when repeat purchases expand rather than simply replace existing packs. The illustrative cost scenario assumes packaging represents 15% to 20% of manufacturing cost, with refills reducing that component by 30% to 40%. Potential gross manufacturing savings therefore range from 4.5% to 8% before handling and validation. Brands must preserve hygiene, compatibility and product stability before translating packaging savings into customer value.
The refill scenario targets gross-margin improvement of 1 to 2 percentage points after added costs and incentives, with conditional CAGR upside of 0.25 percentage points. The full opportunity portfolio adds a capped 0.80 percentage points, taking the scenario baseline to 5.6% if execution succeeds. Menopause programmes, workplace procurement, Indigenous-led botanicals and accessible packaging require distinct product strategies. Early movers should test incremental purchases, retention and unit margins before wider investment.
| Opportunity | (~) % Potential CAGR Upside | Geographic Relevance | Execution Window |
|---|---|---|---|
| Closed-loop refill platform expansion | +0.25% | Dense metropolitan retail catchments | Medium term (2–4 years) |
| Menopause-specific skincare programmes | +0.20% | Nationwide; midlife consumers | Medium term (2–4 years) |
| Occupational skin-care procurement | +0.15% | Healthcare, cleaning and industrial workplaces | Medium term (2–4 years) |
| Indigenous-led botanical commercialisation | +0.10% | Northern and regional sourcing communities | Long term (≥ 4 years) |
| Accessible packaging product platforms | +0.10% | Nationwide; consumers with dexterity limitations | Medium term (2–4 years) |
Key Company Insights
L’Oréal SA
L’Oréal operates across beauty categories, giving its skincare businesses access to broader research, brand management and distribution resources across markets rather than Australia alone. According to L’Oréal’s annual financial reporting, global group sales reached EUR 44.05 billion in 2025. That figure does not measure Australian skincare revenue or market share. Investors should assess how group scale translates into local product relevance, retailer access and profitable repeat purchasing.
L’Oréal’s December 2025 Galderma announcement connected its beauty portfolio with a larger strategic interest in skin health, subject to the transaction’s stated approval process. As reported by L’Oréal Finance, the additional 10% interest would bring ownership to 20%, with completion then expected in early 2026. The announcement did not establish a completed transaction or Australian revenue contribution. Investors should separate ownership strategy from demonstrated local commercial benefits.
Procter & Gamble Company
Procter & Gamble’s Beauty business gives its skincare portfolio a substantial global operating base, but segment scale alone does not establish an Australian competitive ranking. Data from its 2025 Annual Report shows Beauty segment net sales of USD 14,964 million. The segment includes activities beyond Australian skincare, so direct market-share comparisons would misstate its relevance. Local performance depends on assortment fit, price positioning and reliable execution through retail partners.
Procter & Gamble’s August 2026 Olay announcement refreshed its Repair Serum Body Wash Collection and introduced Enrich Boosting Body Oil for the US market. Olay indicates that the oil uses a 3-in-1 complex containing argan oil, rosehip oil and collagen peptide. The launch extends skincare positioning into body routines rather than proving Australian availability. Investors should assess whether portfolio extensions attract additional purchases or merely redirect existing spending.
Unilever PLC
Unilever’s Beauty & Wellbeing business combines skincare with other personal-care and wellbeing activities, creating a broader resource base than a standalone Australian skincare supplier. Figures from Unilever’s 2025 Annual Report show global business-group turnover of EUR 12.8 billion. That total includes categories and countries outside this market. Australian investment decisions should therefore focus on local brand performance, distribution terms and consumer retention rather than global turnover alone.
Unilever’s August 2024 corporate announcement described Vaseline Healthy Bright Gluta-Hya Serum Burst Lotion launches in Thailand, Indonesia and Vietnam rather than an Australian rollout. According to Unilever, the extension incorporated SPF 50, combining body-care positioning with sun protection. The example highlights a route for extending familiar brands into additional routine benefits. Australian commercial adoption would still require appropriate local products, substantiated claims and retailer support rather than assumed regional transferability.
Key Players
- L’Oréal SA
- KORA Organics
- Procter & Gamble Company
- Unilever PLC
- Estée Lauder Companies Inc.
- Kenvue Inc.
- Beiersdorf AG
- Shiseido Company Limited
- L’Occitane Group
- Clarins Group
- The Clorox Company
- Other Key Players
Recent Developments
2026
- October 2026: Estée Lauder Companies announced a EUR 5.7 million manufacturing investment at its Oevel campus in Belgium. As reported by its official investor register, the investment concerns group manufacturing and should not be treated as exclusively Australian skincare capacity.
- September 2026: Kenvue introduced Neutrogena Cloud-Tech sunscreen technology in US facial products carrying SPF 60 and SPF 70. Data from Kenvue describes a technology and product launch, not Australian regulatory approval or distribution.
- September 2026: Beiersdorf launched NIVEA FACE+ across Europe with four moisturizers. Beiersdorf indicates that the range addresses different skincare needs, offering an overseas assortment example without establishing an Australian launch.
- September 2026: Procter & Gamble introduced Olay Regenerist Retinol24 Starter Night Repairing Lotion in the US at USD 27.49 MSRP. Figures from Olay’s launch announcement provide a price-positioning reference rather than an Australian selling price.
- March 2026: Beiersdorf launched its second-generation Skin Care Innovation Fund with EUR 100 million. According to Beiersdorf, typical initial investments range from EUR 0.5 million to EUR 5 million, supporting an external innovation pipeline rather than immediate retail revenue.
- February 2026: Procter & Gamble introduced a five-product Olay Regenerist Treatments collection in the US. As reported by Olay’s company-issued release, each treatment carried USD 34.99 MSRP, positioning the collection around targeted skincare purchases.
- January 2026: L’Oréal unveiled a prototype LED Face Mask developed with I-Smart Developments. Data from L’Oréal specifies 10-minute sessions using 630 nm and 830 nm light, with launch expected in 2027 rather than completed during 2026.
2025
- June 2025: Beiersdorf broke ground on its Hamburg Innovation Center. Beiersdorf indicates an investment of EUR 139 million and approximately 14,000 square metres of planned space, with opening scheduled for 2028. The project represents future research capacity rather than current Australian production.
- March 2025: Kenvue launched Neutrogena Ultra Sheer Face Liquid Mineral Sunscreen SPF 70 in the US. Figures from Kenvue’s announcement establish the product specification, while Australian availability remains outside the announcement’s geographic scope.
- January 2025: L’Oréal unveiled Cell BioPrint, developed with NanoEntek. According to the company-issued announcement, the device provides skin analysis in five minutes, extending personalised product-selection tools rather than establishing skincare-product sales.
2024
- May 2024: Estée Lauder Companies completed the acquisition of DECIEM’s remaining interests, announced in June. As reported by the company, the final purchase cost approximately USD 860 million, bringing total investment to approximately USD 1.7 billion net of cash and subject to adjustments.
Geopolitical Impact Analysis
Red Sea disruption extended shipping routes and weakened the predictability of Europe-linked supply chains serving importers. Data from UNCTAD shows Suez Canal ship tonnage remained approximately 70% below the 2023 average by early May 2025. UNCTAD also recorded a 5.9% increase in global seaborne ton-miles during 2024, reflecting longer shipping distances. Australian skincare suppliers importing finished creams, emollients, surfactants, bottles and dispensing pumps can face disrupted arrival schedules on exposed routes. Longer routes can delay component matching, leaving manufacturers unable to complete batches despite holding other ingredients. Distributors should review supplier lead times, transport options and stock buffers without treating global shipping indicators as measured Australian skincare cost increases.
Global trade conditions provide a separate baseline for procurement decisions, rather than a direct measure of Australian skincare tariff exposure. Figures from the WTO show merchandise trade volume increased 4.6% in 2025, while nominal merchandise exports reached USD 26.26 trillion. The volume measure describes physical trade activity; the dollar measure also reflects prices and exchange-rate effects. Australian buyers sourcing active ingredients, emulsifiers, plastic containers and glass packaging should distinguish supplier price changes from changes in traded quantities. Manufacturers should also separate currency exposure, freight charges and any applicable duties when comparing landed costs. Procurement teams can then assess supply resilience without attributing every cost movement to geopolitical disruption.
Report Scope
| Report Features | Description |
|---|---|
| Market Value (2025) | USD 3.9 billion |
| Market Value (2026) | No separately confirmed annual value |
| Forecast Revenue (2035) | USD 6.3 billion |
| CAGR (2026 to 2035) | 4.8% |
| Market-Size Reference Year | 2025 |
| Forecast Starting Year | 2026 |
| Forecast Period | 2026 to 2035 |
| Report Coverage | Revenue Forecast, Market Dynamics, Market Opportunity Analysis, Technology and Innovation Landscape, Competitive Landscape, Recent Developments |
| Segments Covered | By Product Type (Face Creams & Moisturizers, Cleansers & Face Wash, Sunscreen, Body Creams & Moisturizers, Shaving Lotions & Creams), By Sales Channel (Convenience Stores, Supermarkets & Hypermarkets, Pharmacy & Drugstore, Online, Others) |
| Regional Analysis | Australia only. Selected distribution analysis covers New South Wales and Australian Capital Territory, Victoria, and Queensland. No state-level market shares or revenue estimates are assigned. |
| Competitive Landscape | L’Oréal SA, KORA Organics, Procter & Gamble Company, Unilever PLC, Estée Lauder Companies Inc., Kenvue Inc., Beiersdorf AG, Shiseido Company Limited, L’Occitane Group, Clarins Group, The Clorox Company, Other Key Players. |
| Evidence Treatment | Global company figures, overseas launches and retail infrastructure remain contextual evidence. Scenario contributions are illustrative rather than measured causal effects. Segment shares and growth rankings remain editorial assumptions. |
| Customization Scope | Additional segment and Australian regional analysis can be specified separately. |
| Purchase Options | Single User License | Multi-User License, up to 5 users | Corporate Use License, unlimited users and printable PDF. |








