


Report Overview
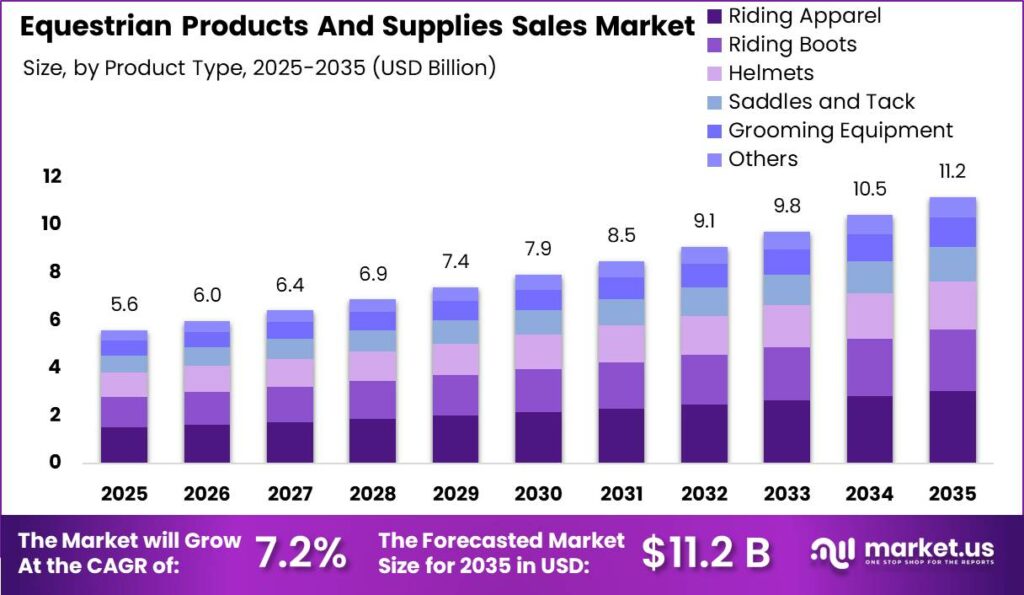
Global Equestrian Products and Supplies Sales Market size is expected to be worth around USD 11.2 Billion by 2035 from USD 5.6 Billion in 2025, growing at a CAGR of 7.2% during the forecast period 2026 to 2035.
The equestrian products and supplies market covers all goods and services used in horse care, rider safety, and competitive or recreational riding. This includes riding apparel, helmets, saddles and tack, grooming equipment, and riding boots. The market serves professional athletes, recreational riders, horse owners, and equestrian facilities across all major global regions.
Key Takeaways
- Equestrian Products and Supplies Sales Market value in 2025 stands at USD 5.6 Billion, forecast to reach USD 11.2 Billion by 2035.
- The market grows at a CAGR of 7.2% from 2026 to 2035.
- Recreational application dominates with a 67.6% share by application segment.
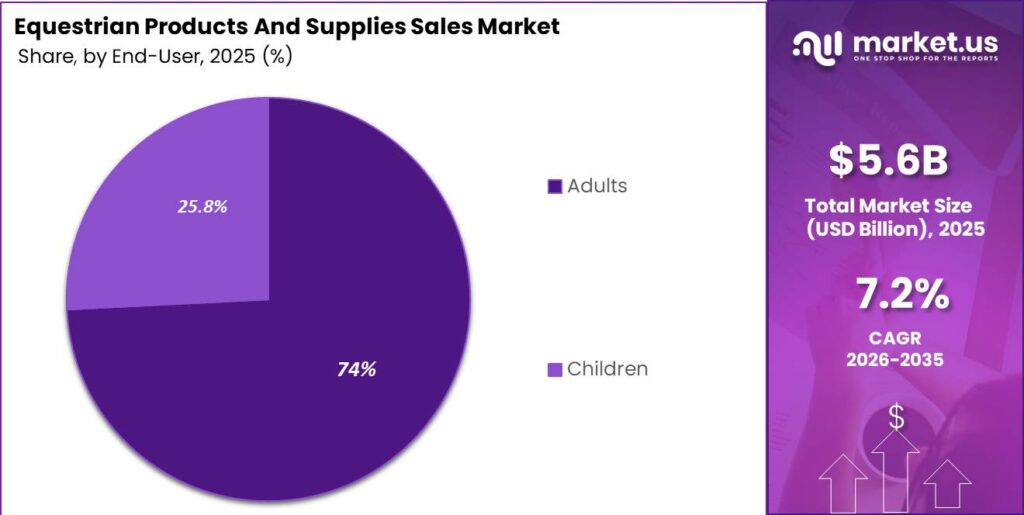
- Adults dominate the end-user segment with a 74.2% share.
- Riding Apparel leads the product type segment with a 27.3% share.
- Specialty Stores lead the distribution channel segment with a 35.80% share.
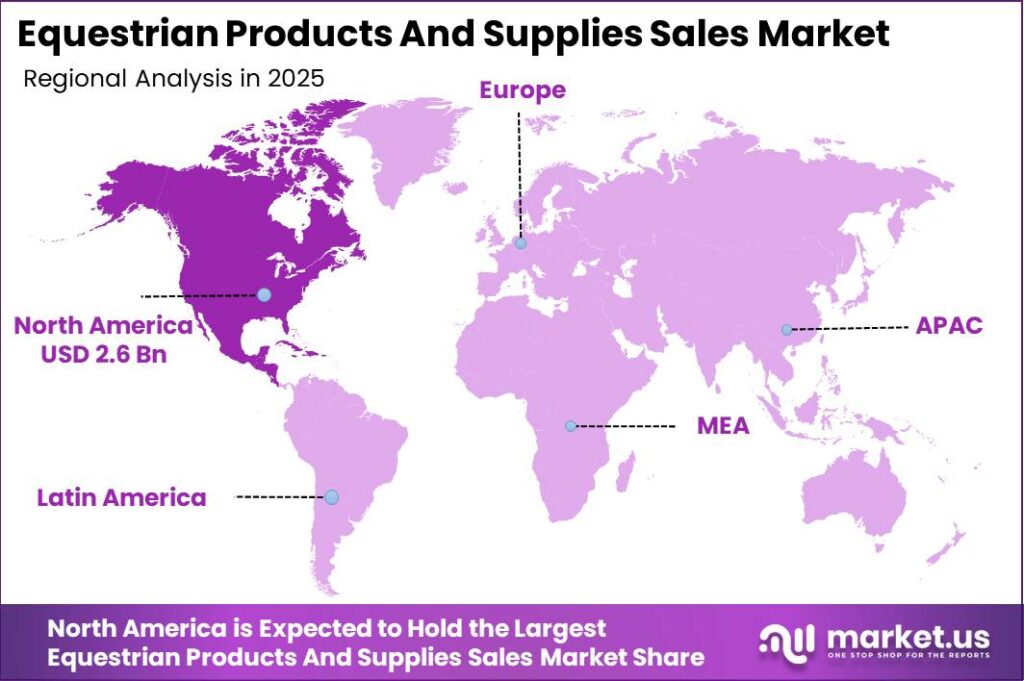
- North America holds the dominant regional position with a 36.8% share, valued at USD 2.6 Billion.
Government bodies and equestrian federations are applying direct regulatory pressure on product standards. The FEI mandates that from 1 January 2026, all competition riders must wear helmets certified under at least one newly approved safety standard. From 1 January 2028, helmets must comply with at least two approved standards. This creates a non-discretionary replacement cycle that vendors can plan around with precision.
According to the American Horse Council, the United States held approximately 6.65 million horses in 2023, forming one of the world’s largest consumer bases for equestrian products. This volume of horses directly supports purchases across feed, tack, supplements, and stable supplies. Vendors targeting the US market face a structurally large and stable demand base that supports multi-category growth strategies.
Data from the American Horse Council shows the US horse industry contributed approximately USD 177 Billion to the economy and supported 2.2 million jobs in 2023. This economic scale signals that equestrian products are not a niche consumer category but a commercially significant sector. Investors and manufacturers entering this market are tapping into an ecosystem with deep economic roots and institutional support.
Product Type Analysis
Riding Apparel dominates with 27.3% due to high purchase frequency across all rider segments.
In 2025, Riding Apparel held a dominant market position in the By Product Type segment of the Equestrian Products and Supplies Sales Market, with a 27.3% share. Apparel is replaced more frequently than hard goods such as saddles, driving repeat purchase cycles. Vendors with strong apparel lines benefit from consistent revenue that is less dependent on one-time capital purchases.
Riding Boots occupy a structurally important position within the product type segment, serving both safety and performance functions for competitive and recreational riders. Boot purchases are often tied to entry points in the sport, meaning riding school expansion and new participant onboarding directly drive this sub-segment. Brands that distribute through riding schools gain first-purchase advantage with new riders.
Helmets represent one of the highest-stakes categories in the equestrian products market due to direct regulatory involvement from the FEI. Mandatory helmet standard upgrades in 2026 and 2028 create a forced replacement cycle independent of discretionary spending. Manufacturers holding multi-certified helmet portfolios are positioned to capture mandatory compliance purchases ahead of less-prepared competitors.
Application Analysis
Recreational dominates with 67.6% due to a larger base of non-professional horse owners.
In 2025, Recreational held a dominant market position in the By Application segment of the Equestrian Products and Supplies Sales Market, with a 67.6% share. According to the American Horse Council, the US recreation horse segment generated approximately USD 36.7 Billion in economic impact in 2023. This scale confirms that recreational riders are the primary commercial engine of the equestrian products market.
Professional application, while smaller in share, generates disproportionate spending per rider due to premium equipment requirements and event participation costs. As reported by the FEI, more than 4,500 international equestrian events take place annually across over 130 countries, driving consistent demand for competition-grade apparel, saddles, bridles, and horse care products. Vendors supplying professional riders access a high-value segment with strong brand visibility at international events.
Distribution Channel Analysis
Specialty Stores dominate with 35.80% due to expert product knowledge and rider trust.
In 2025, Specialty Stores held a dominant market position in the By Distribution Channel segment of the Equestrian Products and Supplies Sales Market, with a 35.80% share. Riders purchasing saddles, tack, and protective gear typically require expert guidance that general retailers cannot provide. Specialty stores maintain their lead by offering product knowledge that builds customer loyalty across high-value categories.
Online Stores represent a structurally growing channel for equestrian products, particularly for replenishment categories such as grooming supplies, apparel, and feed supplements. The lower overhead structure of online retail allows vendors to offer broader product selections and competitive pricing. This channel is especially important for small and independent horse owners who lack proximity to specialist physical retail outlets.
Supermarkets and Hypermarkets capture a share of lower-involvement equestrian purchases, such as basic grooming products and stable maintenance supplies. These outlets compete on convenience and price rather than product expertise. However, their limited product depth keeps them outside the competitive range for premium tack, safety equipment, and performance riding gear.
End-User Analysis
Adults dominate with 74.2% due to higher purchasing power and long-term engagement in the sport.
In 2025, Adults held a dominant market position in the By End-User segment of the Equestrian Products and Supplies Sales Market, with a 74.2% share. Based on American Pet Products Association data, consumer willingness to invest in animal welfare and premium care products is increasing, a trend that directly influences adult equestrian spending across health, nutrition, and performance categories. Adult riders represent the highest-value long-term customers in this market.
Children represent a strategically important growth segment, as early participation in equestrian activities typically converts into lifelong engagement and sustained spending. Riding schools and junior competition programs serve as the primary acquisition channel for this sub-segment. Brands that supply riding schools or sponsor youth programs gain early brand exposure that supports long-term customer retention.
Key Market Segments
By Product Type
- Riding Apparel
- Riding Boots
- Helmets
- Saddles and Tack
- Grooming Equipment
- Others
By Application
- Professional
- Recreational
By Distribution Channel
- Specialty Stores
- Online Stores
- Supermarkets/Hypermarkets
- Others
By End-User
- Adults
- Children
Drivers
The phased revision of FEI competition helmet standards is creating a regulatory-driven replacement cycle within the equestrian equipment industry. From 1 January 2026, riders in FEI competitions must wear helmets certified under at least one newly approved safety standard, rendering several older certifications ineligible. The requirements tighten further from 1 January 2028, when helmets must comply with at least two approved standards and carry a recognized quality-testing mark.
This creates a mandatory upgrade pathway that operates independently of consumer spending cycles or economic conditions. Helmets account for approximately 29.1% of the equestrian equipment market by product type, making safety headgear one of the industry’s most commercially important categories. Manufacturers holding dual- and multi-certified product portfolios are positioned to capture compliance-driven purchases ahead of less-prepared competitors.
| Driver | (~) % Impact on CAGR Forecast | Geographic Relevance | Impact Timeline |
|---|---|---|---|
| Rising Equestrian Sports Participation and Riding School Expansion | +1.4% | North America core, Western Europe, APAC corridors | Short Term (≤ 2 years) |
| FEI Mandatory Helmet Standard Phased Upgrade (2026–2028) Driving Non-Discretionary Replacement Demand | +1.1% | Global FEI-affiliated markets; North America, Europe, Oceania core | Short Term (≤ 2 years) |
| Accelerating E-Commerce and Social Commerce Adoption in Equestrian Retail | +1.3% | North America, UK, Germany, Australia; APAC emerging | Short–Medium Term (1–3 years) |
| Premiumization of Horse Care and Rising Per-Horse Ownership Expenditure | +1.2% | North America, EU, GCC, affluent APAC | Medium Term (2–4 years) |
| Structurally Expanding Equine Healthcare, Feed and Nutraceutical Demand | +1.0% | North America dominant; Europe, Australia follow-on | Medium Term (2–4 years) |
| LA 2028 Olympics Visibility Effect and Growing Female–Youth Demographic Volume | +0.8% | Europe, North America, India, Southeast Asia spill-over | Medium–Long Term (2–5 years) |
Restraints
The high cost of participation remains a structural restraint on the equestrian products and supplies market, particularly for new and younger riders. Entering the sport typically requires purchasing essential equipment including helmets, riding boots, breeches, gloves, and protective gear before regular riding expenses are considered. Industry assessments in 2025 confirmed that cost pressures continue to affect participation and long-term engagement despite sustained interest in equestrian activities.
Rising expenses related to lessons, transportation, competitions, and horse care are making progression more difficult for lower- and middle-income households. As a result, some riders reduce lesson frequency or delay equipment upgrades, which directly limits demand for premium products. The development of rental programs, shared-equipment models, and more accessible riding facilities is increasingly viewed as a structural necessity for broadening market participation.
| Restraint | (~) % Impact on CAGR Forecast | Geographic Relevance | Impact Timeline |
|---|---|---|---|
| Access Cost Barrier | -1.6% | UK, EU, North America core | Medium term (2-4 years) |
| Riding Centre Fragility | -1.4% | UK, EU, North America | Short term (≤ 2 years) |
| Workforce Shortage | -1.2% | UK, EU, North America core | Medium term (2-4 years) |
| Compliance Replacement Burden | -0.9% | FEI markets, EU, Oceania | Short term (≤ 2 years) |
| Welfare Trust Deficit | -0.8% | UK, EU regulatory hubs | Long term (≥ 4 years) |
| Sustainability Capex Burden | -0.7% | UK, EU, Australia | Medium term (2-4 years) |
Challenges
A structural shortage of skilled instructors, grooms, stable managers, saddle fitters, therapists, and event personnel is emerging as a long-term challenge for the equestrian industry. Sector assessments in 2025 confirmed that equestrian centres continue to face staffing pressures despite increasing participation. Riding facilities operating 10–15% below optimal staffing levels often experience reduced lesson availability and slower rider onboarding, which directly suppresses equipment and apparel purchases.
Workforce constraints reduce horse utilization efficiency by 5–8% and associated equipment and apparel purchases by 3–5% due to fewer customer interactions. The shortage of technically trained product specialists also limits adoption of advanced safety and performance equipment. Businesses are redirecting resources toward employee retention and cross-skilling rather than expansion, and workforce replenishment typically requires 4–6 years of training before new personnel reach operational competency.
| Challenge | (~) % CAGR Friction Drag | Geographic Relevance | Mitigation Horizon |
|---|---|---|---|
| Workforce Pipeline Erosion | -1.2% | UK, EU, North America core | Long term (≥ 4 years) |
| Facility Cost Inflation | -1.0% | UK, EU, North America | Medium term (2-4 years) |
| Safety Compliance Reset | -0.8% | FEI markets, Oceania, EU hubs | Medium term (2-4 years) |
| Access Affordability Compression | -1.1% | UK, EU urban belts, North America suburbs | Long term (≥ 4 years) |
| Sustainability Upgrade Burden | -0.7% | EU regulatory hubs, UK, Australia | Medium term (2-4 years) |
| Fragmented Demand Geography | -0.9% | APAC corridors, MENA, secondary Western regions | Long term (≥ 4 years) |
Opportunities
Wearable technology is creating a concrete opportunity to modernize equine health monitoring and horse management. Smart devices including biometric halters, gait-analysis sensors, GPS trackers, and connected saddle pads enable continuous monitoring of horse activity, movement, and health indicators. Approximately 14% of adult horses are affected by equine asthma, highlighting a measurable need for early detection and preventive monitoring tools that wearable platforms can address.
Wearable-driven analytics can identify signs of lameness, colic, fatigue, and respiratory distress before symptoms become severe, improving care outcomes and reducing unexpected veterinary costs. Subscription-based digital platforms are increasingly used to consolidate health records, training data, and performance insights in one ecosystem. The integration of physical equestrian products with digital health platforms remains limited, which creates a clear entry point for companies that can build connected ecosystems combining equipment, health monitoring, and data-driven decision-making.
| Opportunity | (~) % Potential CAGR Upside | Geographic Relevance | Execution Window |
|---|---|---|---|
| Equine Health-Tech and IoT Wearable Ecosystems | +2.8% | North America, Western Europe, Australia | Short Term (≤ 2 years) |
| SaaS and D2C Subscription Monetization (Feed, Supplements and Consumables) | +2.2% | North America, UK, Germany, Netherlands | Short–Medium Term (1–3 years) |
| APAC and GCC Emerging Market Penetration | +3.1% | India, China, Saudi Arabia, UAE, Japan | Medium Term (2–4 years) |
| Equine-Assisted Therapy (EAT) Product Verticalization | +1.8% | North America, EU, Australia | Medium Term (2–4 years) |
| Circular Economy and Authenticated Resale Platform | +1.5% | Western Europe, North America | Medium–Long Term (3–5 years) |
| Bolt-On M&A Roll-Up of Fragmented Specialty Brands | +2.4% | Global (North America as consolidation core) | Long Term |
Regional Analysis
North America Dominates the Equestrian Products and Supplies Sales Market with a Market Share of 36.8%, Valued at USD 2.6 Billion
North America holds the largest regional share at 36.8%, valued at USD 2.6 Billion in 2025. The American Horse Council reports that approximately 12.5 million acres of land are owned or leased for horse-related purposes in the United States. This land base drives consistent purchases of fencing, shelters, pasture equipment, and maintenance supplies, supporting multi-category revenue across the regional market.
Europe holds a structurally significant position in the equestrian market, supported by a dense network of FEI-affiliated competitions, established riding club infrastructure, and active regulatory involvement in equipment safety standards. The FEI helmet standard revisions taking effect in 2026 and 2028 will drive mandatory equipment replacement cycles across European markets. Vendors with compliant product portfolios are positioned to capture this replacement demand ahead of less-prepared competitors.
Asia Pacific represents the highest-upside regional growth corridor for equestrian products, driven by rising high-income household formation and expanding equestrian sport infrastructure in markets such as China, India, Japan, and Australia. FEI data shows the organization operates across more than 130 countries, with APAC markets forming a growing share of event participation. Early-mover brands that establish distribution in APAC now face lower competitive intensity than in mature Western markets.
Key Regions and Countries
North America
- US
- Canada
Europe
- Germany
- France
- The UK
- Spain
- Italy
- Rest of Europe
Asia Pacific
- China
- Japan
- South Korea
- India
- Australia
- Rest of APAC
Latin America
- Brazil
- Mexico
- Rest of Latin America
Middle East and Africa
- GCC
- South Africa
- Rest of MEA
Competitive Analysis
Ariat International Inc. built its market position on performance footwear and apparel for equestrian athletes and Western riders. The brand’s direct-to-consumer capabilities and broad retail partnerships give it pricing and distribution control across North American and European markets. In February 2025, Ariat launched its redesigned Heritage Paddock Boot, reinforcing its commitment to rider-focused product innovation and premium positioning.
Horseware Ireland competes through a broad portfolio of horse rugs, rider apparel, and stable accessories distributed across international markets. The company’s acquisition strategy, which targets complementary brands to fill product and geographic gaps, creates a compounding competitive advantage. Figures from the American Horse Council show the US competition horse segment generated approximately USD 37.3 Billion in economic impact in 2023, reflecting the scale of the market Horseware is targeting through its expansion moves.
Key Players
- Ariat International Inc.
- Horseware Ireland
- WeatherBeeta Pty Ltd.
- Kerrits Equestrian Apparel
- Charles Owen and Co.
- Troxel LLC
- Devon-Aire Inc.
- Noble Outfitters LLC
- Tredstep Ireland
- Mountain Horse
Recent Developments
- January 2025 – Horseware Ireland announced a merger with EquiFit, a US-based manufacturer of advanced equestrian equipment and performance gear, to expand its global product portfolio and strengthen its presence across international equestrian markets.
- February 2025 – Ariat launched its redesigned Heritage Paddock Boot featuring enhanced comfort technology, updated branding, improved flexibility, and a rider-focused traction outsole for everyday riding and stable activities.
Report Scope
| Report Features | Description |
|---|---|
| Market Value (2025) | USD 5.6 Billion |
| Forecast Revenue (2035) | USD 11.2 Billion |
| CAGR (2026-2035) | 7.2% |
| Base Year for Estimation | 2025 |
| Historic Period | 2020-2024 |
| Forecast Period | 2026-2035 |
| Report Coverage | Revenue Forecast, Market Dynamics, Market Opportunity Analysis, Technology and Innovation Landscape, Competitive Landscape, Recent Developments |
| Segments Covered | By Product Type (Riding Apparel, Riding Boots, Helmets, Saddles and Tack, Grooming Equipment, Others), By Application (Professional, Recreational), By Distribution Channel (Specialty Stores, Online Stores, Supermarkets/Hypermarkets, Others), By End-User (Adults, Children) |
| Regional Analysis | North America (US and Canada), Europe (Germany, France, The UK, Spain, Italy, and Rest of Europe), Asia Pacific (China, Japan, South Korea, India, Australia, and Rest of APAC), Latin America (Brazil, Mexico, and Rest of Latin America), Middle East and Africa (GCC, South Africa, and Rest of MEA) |
| Competitive Landscape | Ariat International Inc., Horseware Ireland, WeatherBeeta Pty Ltd., Kerrits Equestrian Apparel, Charles Owen and Co., Troxel LLC, Devon-Aire Inc., Noble Outfitters LLC, Tredstep Ireland, Mountain Horse |
| Customization Scope | Customization for segments, region/country-level will be provided. Additional customization can be done based on requirements. |
| Purchase Options | We have three licenses to opt for: Single User License, Multi-User License (Up to 5 Users), Corporate Use License (Unlimited User and Printable PDF) |





































