


Report Overview
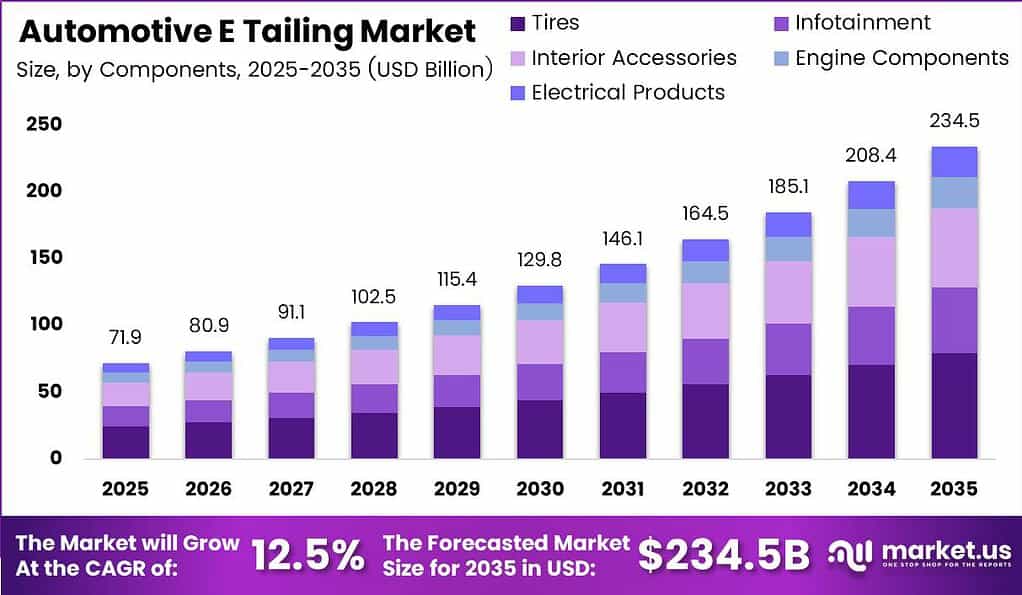
Global Automotive E-Tailing Market size is expected to be worth around USD 234.5 Billion by 2035 from USD 80.9 Billion in 2026, growing at a CAGR of 12.5% during the forecast period 2026 to 2035.
The automotive e-tailing market covers the online retail of vehicle parts, accessories, tires, and electronic components sold through branded storefronts, third-party marketplaces, and OEM-linked digital channels. Buyers range from individual DIY consumers to fleet operators and professional workshops sourcing replacement parts and upgrades. The market spans both passenger and commercial vehicle segments and is structured around product type, vendor model, vehicle category, and price label.
Key Takeaways
- The global automotive e-tailing market is valued at USD 80.9 Billion in 2026 and is forecast to reach USD 234.5 Billion by 2035 at a CAGR of 12.5%.
- By Components, Tires holds the largest revenue share at 32.11% and is the fastest-growing sub-segment.
- By Product Level, Counterfeit holds the fastest-growing position with a 35.02% share.
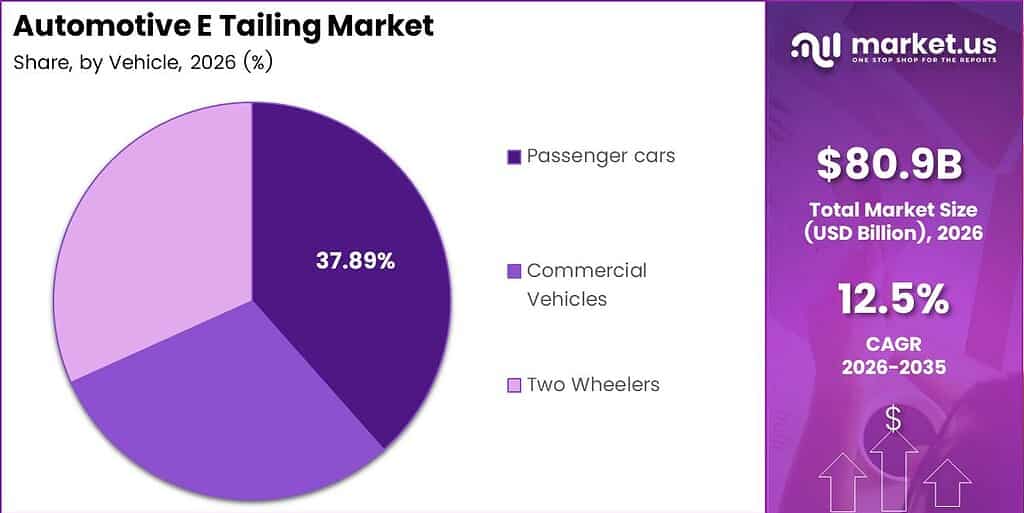
- By Vehicle, Passenger Cars dominates with a 37.89% share, while Two Wheelers is the fastest-growing vehicle segment.
- By Vendor, Third-Party Vendors lead with a 61.8% share over OEM Vendors.
- By Product Label, Branded products hold a dominant 69.6% share over Counterfeit.
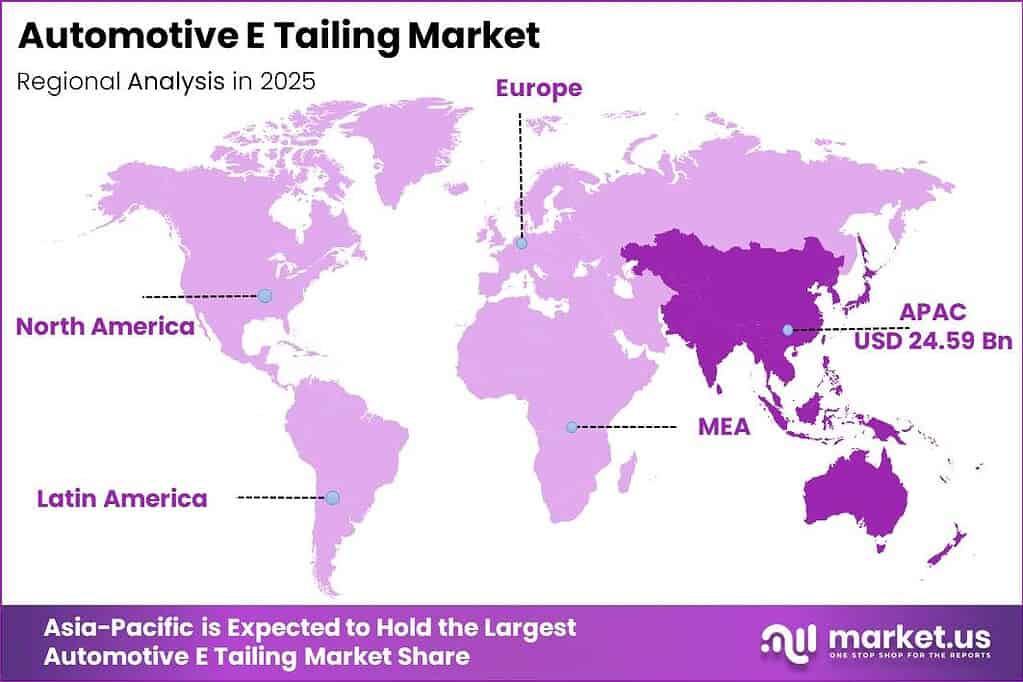
- North America is the dominant region, holding 34.21% market share valued at USD 24.59 Billion.
- Asia-Pacific is the fastest-growing region.
As per our research, counterfeit and pirated goods represented up to USD 464 Billion, or 2.5% of world trade, in 2019. This scale confirms that counterfeit automotive parts are not a fringe problem but a structural market force. Platforms and regulators that close authentication gaps will define who captures branded-parts revenue at scale.
Global trade in goods and services increased by USD 2.5 Trillion to USD 35 Trillion in 2025. This expansion directly widens the addressable base for cross-border automotive parts sourcing. Sellers with localized fulfillment and multi-currency checkout will benefit most as trade volumes rise across emerging markets.
AutoZone opened 142 stores and closed one store during its fourth fiscal quarter, producing 141 net new stores. This signals aggressive physical-network expansion running in parallel with digital growth. Omnichannel retailers that match digital convenience with local fulfillment speed hold a structural advantage over pure-play online sellers.
Components Analysis
Tires dominates with 32.11% due to high repurchase frequency and online price transparency.
In 2025, Tires held a dominant market position in the By Components segment of the Automotive E-Tailing Market, with a 32.11% share. Tire replacement is a non-discretionary, recurring purchase that consumers actively price-compare online before buying. Bridgestone announced an approximately USD 85 Million investment in India, including capacity for an additional 1.1 Million tires annually by 2029, signaling that tier-one producers are investing to meet rising e-channel demand. Yokohama Rubber also announced a USD 380 Million Mexican tire plant targeting annual production capacity of 5 Million tires, reinforcing supply-side expansion for this sub-segment.
Infotainment products represent the second-largest component category and benefit from strong consumer interest in vehicle upgrades. Buyers in this segment are typically younger, digitally native, and comfortable sourcing hardware online without in-store guidance. This buyer profile makes infotainment a natural fit for platform-led selling, where rich product content and compatibility filters replace the need for in-person consultation.
Interior Accessories and Engine Components collectively serve distinct buyer motivations. Interior Accessories attract lifestyle-driven buyers seeking personalization, while Engine Components draw technically proficient DIY consumers and independent workshops. As per our research, Worldpac offered more than 185,000 SKUs for imported and domestic vehicle lines in 2019, illustrating how catalog depth drives competitive positioning in the components segment.
Electrical Products round out the components segment and are gaining share as vehicle electrification accelerates. Global electric light-commercial-vehicle sales exceeded 430,000 units in 2025, increasing 45%, according to IEA data. This growth creates a pipeline of EV-specific electrical components that traditional aftermarket catalogs have yet to fully address, opening a direct entry point for specialized e-tailers.
Product Level Analysis
Counterfeit dominates with 35.02% due to price sensitivity and limited consumer verification tools.
In 2025, Counterfeit held a dominant market position in the By Product Level segment of the Automotive E-Tailing Market, with a 35.02% share. OECD data shows that 20% of counterfeit automotive spare parts purchased in Sweden were purchased knowingly, indicating that a measurable share of demand is deliberate rather than accidental. This complicates platform enforcement strategies since removing supply does not eliminate buyer intent. Sellers of genuine parts must compete on price transparency and certification visibility to convert cost-sensitive buyers away from counterfeit alternatives.
Branded products generate the majority of platform revenue even where counterfeit volume is high, because average order values and return rates favor authenticated goods. Buyers who select branded parts accept a price premium in exchange for warranty compliance, fit confidence, and liability protection. This segment rewards platforms that invest in brand verification, OEM partnerships, and fitment-accuracy guarantees.
Vehicle Analysis
Passenger Cars dominates with 37.89% due to the largest global vehicle parc and highest parts turnover.
In 2025, Passenger Cars held a dominant market position in the By Vehicle segment of the Automotive E-Tailing Market, with a 37.89% share. According to ACEA, the average European travels more than 12,000 kilometres annually by passenger car, generating predictable wear-and-replacement cycles that translate directly into recurring e-tailing demand. Data from SIAM shows Indian passenger-vehicle sales reached a record 4.3 Million units in FY2024-25, increasing 2%, expanding the addressable fleet in the fastest-growing major economy. Together, these dynamics make passenger cars the most reliable long-term volume driver in the vehicle segment.
Commercial Vehicles represent a high-value sub-segment where fleet operators prioritize parts availability and total-cost-of-ownership over price alone. ACEA data shows more than 30 Million vans were in circulation in the European Union, with an average age of 12.5 years. The average EU truck was 14.1 years old in 2023. These aging fleets require consistent maintenance spend, creating predictable demand for commercial-grade parts through e-channels that can guarantee fast, accurate fulfillment. North American electric-truck sales reached 20,000 units in 2025, increasing 25%, adding a new EV-parts layer on top of existing fleet demand.
Two Wheelers is the fastest-growing vehicle sub-segment and is powered by electrification and export momentum. IEA data shows global electric two-wheeler sales approached 10 Million units in 2025, increasing 15% and representing around 14% of total two-wheeler sales. SIAM data shows India exported 4.2 Million two-wheelers in FY2024-25, increasing 21.4%. This combination of domestic production scale and export reach creates a durable demand pipeline for two-wheeler-specific parts and accessories sold online.
Vendor Analysis
Third-Party Vendor dominates with 61.8% due to broader catalog access and competitive pricing.
In 2025, Third-Party Vendor held a dominant market position in the By Vendor segment of the Automotive E-Tailing Market, with a 61.8% share. Third-party platforms aggregate inventory from multiple suppliers, giving buyers access to a wider range of parts at competitive prices than any single OEM channel can match. This structural advantage makes third-party vendors the default starting point for most consumer and professional buyers. OEM Vendors hold the remaining share and compete on brand trust, fitment guarantees, and warranty-compliant parts for newer vehicle models.
Product Label Analysis
Branded dominates with 69.6% due to buyer preference for warranty compliance and fitment certainty.
In 2025, Branded held a dominant market position in the By Product Label segment of the Automotive E-Tailing Market, with a 69.6% share. Branded products command this position because professional workshops, fleet operators, and safety-conscious consumers are unwilling to risk fitment failures or warranty voidance on unverified parts. This buyer base creates a stable revenue floor that is less price-elastic than the counterfeit segment. Counterfeit holds the remaining share and competes primarily on price in consumer-facing channels where enforcement is inconsistent.
Key Market Segments
By Components
- Tires
- Infotainment
- Interior Accessories
- Engine Components
- Electrical Products
By Product Level
- Counterfeit
- Branded
By Vehicle
- Passenger Cars
- Commercial Vehicles
- Two Wheelers
By Vendor
- Third-Party Vendor
- OEM Vendor
By Product Label
- Branded
- Counterfeit
Regional Analysis
North America Dominates the Automotive E-Tailing Market with a Market Share of 34.21%, Valued at USD 24.59 Billion
North America holds the largest regional share at 34.21%, valued at USD 24.59 Billion, supported by a mature vehicle parc, deep DIY culture, and an established network of omnichannel retailers. In January 2025, Hyundai and Amazon launched Hyundai vehicle purchasing through Amazon Autos in 54 US markets representing 71% of Hyundai’s sales volume. This integration of vehicle commerce and parts ecosystems within a single platform compresses the buyer journey and reinforces North America’s structural lead in automotive e-commerce adoption.
Asia-Pacific is the fastest-growing region, driven by rapid vehicle-fleet expansion, rising smartphone-led purchasing, and strong two-wheeler and EV adoption across India, China, and Southeast Asia. SIAM data shows India’s automobile industry recorded 7.3% domestic-sales growth in FY2024-25, adding millions of new vehicles to a parc that increasingly sources replacement parts online. This growth trajectory positions Asia-Pacific as the primary volume engine for the automotive e-tailing market through 2035.
In June 2024, Toyota announced a USD 531 Million, 500,000-square-foot drivetrain-parts facility in Texas supporting more than 400 jobs. In September 2024, Stellantis announced investments exceeding USD 406 Million in three Michigan facilities, including USD 235.5 Million at Sterling Heights. These manufacturing investments deepen the North American supply base, reducing lead times for OEM-sourced parts sold through digital channels and reinforcing regional fulfillment competitiveness.
Key Regions and Countries
North America
- US
- Canada
Europe
- Germany
- France
- The UK
- Spain
- Italy
- Rest of Europe
Asia Pacific
- China
- Japan
- South Korea
- India
- Australia
- Rest of APAC
Latin America
- Brazil
- Mexico
- Rest of Latin America
Middle East and Africa
- GCC
- South Africa
- Rest of MEA
Market Dynamics
Market Opportunity Analysis - Underserved vehicle categories and emerging regions offer high-return entry points for focused e-tailers
The Two Wheelers segment is the fastest-growing vehicle category in this market yet remains underserved by dedicated e-tailing platforms. Most major automotive e-tailers built catalogs around passenger-car fitment data, leaving two-wheeler-specific SKU depth underdeveloped. New entrants that build two-wheeler-first catalogs in India and Southeast Asia, where export and EV adoption are accelerating simultaneously, can establish a defensible position before generalist platforms prioritize this segment.
Commercial vehicle fleets represent a structurally underexploited B2B channel for e-tailing operators. Fleet managers prioritize guaranteed availability and scheduled replenishment over price, but most automotive e-tailing platforms are built around individual consumer purchasing behavior. A platform or service layer designed around fleet procurement workflows, consolidated invoicing, and predictive replenishment would address an unmet structural need in this segment.
The Counterfeit product level, despite holding a 35.02% share, points directly to an underexploited opportunity in authentication-as-a-service. Platforms that integrate verified-genuine labeling, QR-linked provenance tracking, and OEM certification visibility can convert price-sensitive buyers who currently default to counterfeit due to a lack of accessible trust signals. This positions authenticity infrastructure as a revenue-generating differentiator, not a compliance cost.
Asia-Pacific as the fastest-growing region contains multiple sub-markets where automotive e-tailing penetration remains low relative to vehicle-parc size. Countries outside China and India, including Vietnam, Indonesia, and Thailand, have large two-wheeler and commercial-vehicle fleets but limited access to structured, fitment-accurate online parts catalogs. These markets offer first-mover advantages for e-tailers willing to invest in local language, local logistics, and local fitment data partnerships.
Technology and Innovation Landscape - Digital infrastructure and electrification drive a new competitive baseline for automotive e-tailers
The integration of vehicle-data access enabled by the EU Data Act, which became applicable on 12 September 2025, creates the technical foundation for predictive parts commerce. Platforms that build consent management and vehicle-identification decoding systems now will be positioned to trigger automated parts-and-service recommendations at mileage thresholds or diagnostic alerts. This shifts the e-tailing model from passive catalog browsing to active demand generation.
AI visual diagnostics represent a near-term technology deployment that reduces the technical barrier for consumer self-service. A buyer who can photograph a worn component and receive an accurate fitment-matched replacement recommendation completes a purchase without requiring deep technical knowledge. This conversion tool is particularly relevant in emerging markets where professional workshop guidance is less accessible and DIY repair is the primary parts consumption channel.
Fitment data automation is the core infrastructure challenge that technology investment must address. The sensitivity model shows each 1-percentage-point increase in avoidable misfit returns can remove 40 to 80 basis points from contribution margin. Automated vehicle-identification decoding, supplier-level data governance, and real-time supersession tracking are the three technology layers that directly protect margin at scale. Platforms without these capabilities face structural cost disadvantages as catalog depth increases.
Electrification is reshaping the SKU architecture of the entire automotive parts market. Global electric light-commercial-vehicle sales exceeded 430,000 units in 2025, increasing 45%, while electric two-wheeler sales approached 10 Million units. Each new EV platform introduces a distinct set of battery, electrical, and drivetrain components that require dedicated fitment data and supplier relationships. E-tailers that build EV-specific catalog infrastructure ahead of mainstream fleet turnover will hold a durable data and inventory advantage.
Drivers
Automotive e-tailing growth is being driven by a fundamental shift in how buyers research and complete parts purchases. By 2024, specialty-parts expenditure was split approximately 50/50 between online and offline channels, and the 2025 aftermarket outlook indicated 4.6% online growth excluding major third-party marketplaces. When those marketplaces were included, annualized channel growth reached approximately 6.7%. This migration rewards integrated inventory models over pure physical retail.
Omnichannel conversion, aging vehicle parcs in North America and Europe, and price-seeking consumer behavior collectively add an estimated +1.9%, +1.4%, and +1.0% to the baseline CAGR. Rapid fulfilment expansion and the DIY maintenance ecosystem contribute an additional +0.7% and +0.5%. Sellers that invest in click-and-collect infrastructure, real-time inventory visibility, and competitive pricing tools will capture a disproportionate share of this structural shift.
| Driver | (~) % Impact on CAGR Forecast | Geographic Relevance | Impact Timeline |
|---|---|---|---|
| Omnichannel Purchasing Migration | +1.9% | Global | Short term (≤ 2 years) |
| Ageing Vehicle Parc | +1.4% | North America and Europe | Short term (≤ 2 years) |
| Price-Seeking Consumer Behavior | +1.0% | Global | Short term (≤ 2 years) |
| Rapid Fulfilment Expansion | +0.7% | North America, Europe and Asia-Pacific | Medium term (2–4 years) |
| DIY Maintenance Ecosystem | +0.5% | North America, Europe and Australia | Medium term (2–4 years) |
| Expanding Vehicle Parc | +0.4% | Asia-Pacific, Latin America and Africa | Long term (≥ 4 years) |
Restraints
The withdrawal of duty-free treatment for low-value US shipments directly weakens cross-border fulfillment economics for inexpensive parts. The 2025 policy suspended the former USD 800 exemption and established postal-package duties of USD 80, USD 160, or USD 200, depending on the applicable tariff rate band. On a hypothetical USD 100 order, even the lowest USD 80 duty equals 80% of merchandise value before delivery charges. Sellers must localize inventory or consolidate consignments to absorb this cost.
This tariff shock, combined with inventory financing intensity and hazardous-goods shipping restrictions, collectively drags an estimated -1.7%, -1.1%, and -0.8% from the baseline CAGR. Safety-critical trust barriers and warranty channel restrictions add a further -0.6% and -0.4%. Smaller retailers without capital to localize fulfillment or absorb margin compression face the steepest operational risk under current cross-border trade conditions.
| Restraint | (~) % Impact on CAGR Forecast | Geographic Relevance | Impact Timeline |
|---|---|---|---|
| De Minimis Tariff Shock | -1.7% | United States and cross-border exporters | Short term (≤ 2 years) |
| Inventory Financing Intensity | -1.1% | Global, particularly smaller retailers | Short term (≤ 2 years) |
| Hazardous-Goods Shipping Restrictions | -0.8% | Global cross-border channels | Short term (≤ 2 years) |
| Safety-Critical Trust Barrier | -0.6% | Global | Medium term (2–4 years) |
| Warranty Channel Restrictions | -0.4% | North America, Europe and Asia-Pacific | Medium term (2–4 years) |
| Workshop Procurement Lock-In | -0.3% | Global independent aftermarket | Long term (≥ 4 years) |
Challenges
Fitment data fragmentation remains the most structurally damaging challenge in the automotive e-tailing market. Every listing must map a part number against vehicle year, make, model, engine, drivetrain, and configuration while maintaining product attributes and digital assets across separate fitment and product-information structures. Each 1-percentage-point increase in avoidable misfit returns can remove approximately 40 to 80 basis points from contribution margin after return transport, inspection, and markdowns.
The modeled -1.4% friction drag from fitment fragmentation alone demands sustained investment in product-information management and automated validation rather than one-time upgrades. Reverse-logistics complexity and cybersecurity exposure add a further -0.9% and -0.6%. Platforms that solve fitment accuracy first will hold the strongest competitive position, because every percentage point of misfit reduction directly improves margin and return rates simultaneously.
| Challenge | (~) % CAGR Friction Drag | Geographic Relevance | Mitigation Horizon |
|---|---|---|---|
| Fitment Data Fragmentation | -1.4% | Global | Medium term (2–4 years) |
| Reverse-Logistics Complexity | -0.9% | Global | Medium term (2–4 years) |
| Cybersecurity and Fraud Exposure | -0.6% | Global | Long term (≥ 4 years) |
| Installer Orchestration Gaps | -0.4% | North America, Europe and Asia-Pacific | Medium term (2–4 years) |
| Long-Tail Inventory Forecasting | -0.3% | Global | Long term (≥ 4 years) |
| Specialist Talent Shortages | -0.2% | Emerging and mid-sized markets | Medium term (2–4 years) |
Opportunities
Connected-vehicle predictive commerce represents the highest-value near-term revenue stream in this market. The European Union’s Data Act became applicable on 12 September 2025, allowing connected-product users to share vehicle data with third parties including aftermarket providers. A predictive-commerce model built on this foundation could reduce paid-acquisition costs by 15 to 25% and inventory markdowns by 10 to 15%, while expanding gross margins by 2 to 4 percentage points.
This single opportunity carries a potential CAGR upside of +1.2% above the 12.5% baseline. Circular parts marketplaces and fleet replenishment subscriptions add a further +0.8% and +0.6% in long and medium-term windows. Early movers who build consent management and vehicle-data normalization capabilities before these systems reach commercial scale will lock in structural cost advantages that latecomers cannot easily replicate.
| Opportunity | (~) % Potential CAGR Upside | Geographic Relevance | Execution Window |
|---|---|---|---|
| Connected-Vehicle Predictive Commerce | +1.2% | Europe, followed by North America and Asia-Pacific | Medium term (2–4 years) |
| Circular Parts Marketplaces | +0.8% | Europe and North America | Long term (≥ 4 years) |
| Fleet Replenishment Subscriptions | +0.6% | Global commercial fleets | Medium term (2–4 years) |
| AI Visual Diagnostics | +0.5% | Global consumer and workshop channels | Medium term (2–4 years) |
| Embedded Installation Bundles | +0.4% | Urban markets globally | Medium term (2–4 years) |
| Niche Catalog Roll-Ups | +0.3% | Fragmented regional markets | Long term (≥ 4 years) |
Key Company Insights
Robert Bosch GmbH generated €90.969 Billion in group sales in 2025, with Bosch Mobility contributing €55.8 Billion, or 61.4% of total group revenue. Bosch Power Tools expanded its direct digital retail network to 1,600 retailers by adding 164 online partners. This scale of digital distribution signals that Bosch is building an e-tailing infrastructure that competitors without equivalent manufacturing breadth cannot replicate quickly.
Continental AG generated €19.676 Billion in 2025 sales, with US tire plants carrying annual production capacity exceeding 16 Million tires. Continental invested more than USD 85 Million to expand its Mount Pleasant facility and added more than 1,000 wheel-bearing, chassis, and steering products to its European aftermarket portfolio. However, total revenue declined 2% from €20.077 Billion in 2024, signaling that portfolio expansion alone has not yet offset pricing or volume pressure at group level.
Key Players
- Robert Bosch GmbH
- Continental AG
- AutoZone Inc.
- Amazon.com Inc.
- Alibaba Group Holding Ltd.
- Wal-Mart Stores Inc.
- eBay Inc.
- Delticom AG
- Advance Auto Parts, Inc.
- Other Key Players
Recent Developments
- May 26, 2026 – AutoZone opened 82 stores during its third fiscal quarter and projected approximately 355 to 365 store openings for the full fiscal year.
- August 1, 2025 – Johnson Controls completed the USD 8.1 Billion sale of its residential and light-commercial HVAC business to Bosch.
- November 18, 2025 – Toyota announced a USD 912 Million investment across five US plants supporting 252 new manufacturing jobs.
- October 14, 2025 – Stellantis announced a USD 13 Billion four-year US investment program supporting five new vehicles and more than 5,000 jobs.
- August 22, 2024 – Advance Auto Parts agreed to sell Worldpac to Carlyle for USD 1.5 Billion in cash.
- December 10, 2024 – Stellantis and CATL announced an investment of up to €4.1 Billion in a Spanish battery joint venture targeting capacity of up to 50 GWh.
- October 2, 2024 – Toyota announced an additional USD 500 Million investment in Joby Aviation through two equal tranches.
- February 22, 2024 – Michelin, Antin and Scandinavian Enviro Systems finalized plans for a tire-recycling facility with annual capacity of approximately 35,000 tonnes and up to 40 jobs.
Report Scope
| Report Features | Description |
|---|---|
| Market Value (2026) | USD 80.9 Billion |
| Forecast Revenue (2035) | USD 234.5 Billion |
| CAGR (2026-2035) | 12.5% |
| Base Year for Estimation | 2025 |
| Historic Period | 2020-2024 |
| Forecast Period | 2026-2035 |
| Report Coverage | Revenue Forecast, Market Dynamics, Market Opportunity Analysis, Technology and Innovation Landscape, Competitive Landscape, Recent Developments |
| Segments Covered | By Components (Tires, Infotainment, Interior Accessories, Engine Components, Electrical Products), By Product Level (Counterfeit, Branded), By Vehicle (Passenger Cars, Commercial Vehicles, Two Wheelers), By Vendor (Third-Party Vendor, OEM Vendor), By Product Label (Branded, Counterfeit) |
| Regional Analysis | North America (US and Canada), Europe (Germany, France, The UK, Spain, Italy, and Rest of Europe), Asia Pacific (China, Japan, South Korea, India, Australia, and Rest of APAC), Latin America (Brazil, Mexico, and Rest of Latin America), Middle East and Africa (GCC, South Africa, and Rest of MEA) |
| Competitive Landscape | Robert Bosch GmbH, Continental AG, AutoZone Inc., Amazon.com Inc., Alibaba Group Holding Ltd., Wal-Mart Stores Inc., eBay Inc., Delticom AG, Advance Auto Parts Inc., Other Key Players |
| Customization Scope | Customization for segments, region/country-level will be provided. Additional customization can be done based on requirements. |
| Purchase Options | We have three licenses to opt for: Single User License, Multi-User License (Up to 5 Users), Corporate Use License (Unlimited User and Printable PDF) |








